

GBP price, news and analysis:
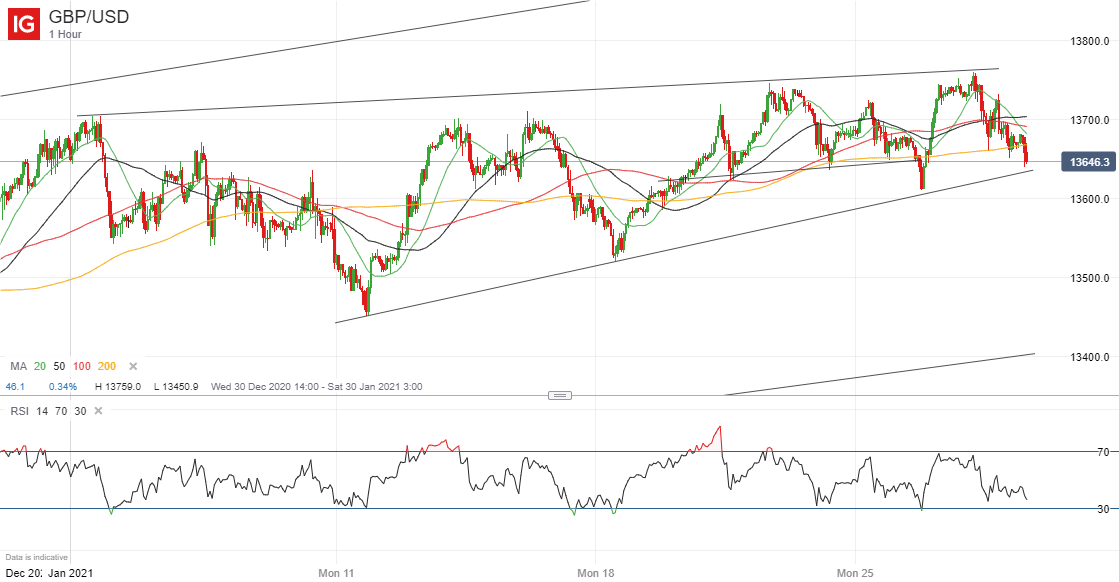
- GBP/USD is testing support from a trendline that marks the lower boundary of a rising channel in place on the chart since January 11.
- A ‘risk off’ move in the markets has led to a flow of money from other currencies into the safe-haven US Dollar and that could provide the catalyst for a break lower.
GBP/USD under downward pressure
GBP and other currencies are falling against the US Dollar Thursday as a deterioration in sentiment leads to another flow of money into the safe haven USD. For GBP/USD, much will depend on whether and when confidence returns but in the near-term the pair is again testing trendline support and, if it breaks, further near-term losses can be expected.
GBP/USD Price Chart, One-Hour Timeframe (December 30, 2020 – January 28, 2021)
Source: IG (You can click on it for a larger image)
The trendline currently checks in around 1.3630 and any fall below there could easily take GBP/USD down to 1.36. Note though that the trendline has been tested before and each time it has held. If that happens again there could be a swift move back to 1.37 and above.

Recommended by Martin Essex, MSTA
Download our fresh Q1 GBP forecast
From a fundamental perspective, there has been little news to explain why sentiment has deteriorated in the markets generally but it could be seen as a healthy correction lower that will be followed by further gains for stocks and currencies like GBP, AUD, NZD and CAD.
| Change in | Longs | Shorts | OI |
| Daily | 7% | -32% | -19% |
| Weekly | 5% | -14% | -7% |
We look at currencies regularly in the DailyFX Trading Global Markets Decoded podcasts that you can find here on Apple or wherever you go for your podcasts
— Written by Martin Essex, Analyst
Feel free to contact me on Twitter @MartinSEssex
Be the first to comment