

GBP/USD Price, Chart, and Analysis
- Politics may kick in on mooted UK tax rise.
- UK economic calendar is fairly quiet next week.
Keep up to date with all market-moving data releases and events by using the DailyFX Calendar
The UK economic calendar is fairly thin next with little in the way of market-moving news ahead of Friday’s latest look at GDP data. The calendar as a whole is thin apart from three central bank meetings – RBA, BoC and, ECB – leaving these Sterling crosses vulnerable ahead of and after these rate decisions.
The US jobs report (NFP) has given GBP/USD a boost going into the weekend with the headline number missing expectations by a large margin – 235k vs. 750k expectations and revised 1053k prior – and keeping downward pressure on the US dollar. While the headline number was poor, average earnings on a month-on-month and a year-on-year basis were robust, likely limiting further greenback weakness.
US Dollar Drops, Gold Spikes Initially on NFP Headline Shock
The British Pound may come under pressure next week if reports, from normally reliable sources, are true about a hike in UK National Insurance contributions. Media reports that a rise in NI may affect 25 million people with a mooted 1% hike raising GBP10 billion to fund social care plans. The Daily Telegraph reports that Health Secretary Sajid David wants a 2% increase, putting him at odds with both the PM and taxpayer. If these reports are correct, then PM Johnson will be breaking one of the Conservative election manifesto pledges of not raising income tax, VAT, or National Insurance. This may be another test of the PM’s popularity which has been on the wane of late.
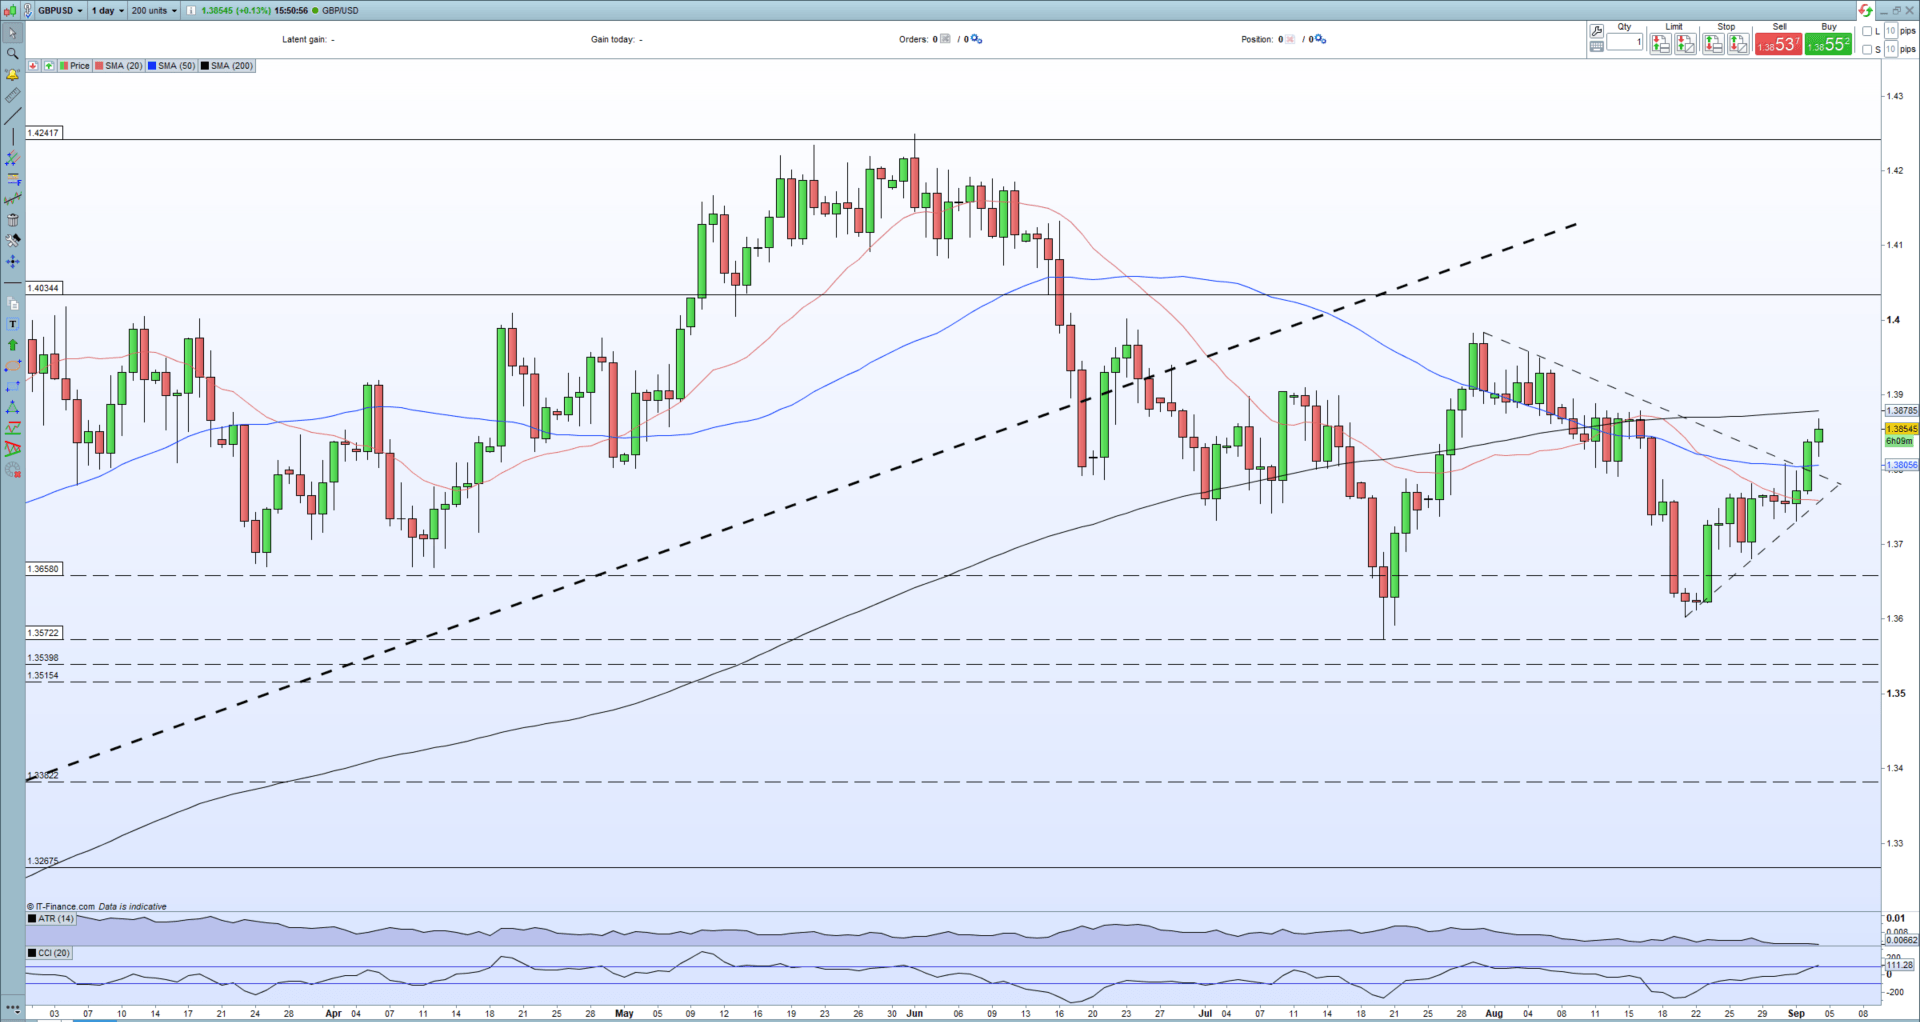
As noted earlier, the recent weakness in the US dollar has allowed GBP/USD to push back to a two-week high and break above recent pennant resistance. For the pair to show a true breakout higher then a cluster of recent highs between 1.3890 and 1.3984 will need to be navigated which may prove difficult unless there is some Sterling-positive news. The pair are also nearing overbought territory using the CCI indicator adding a further anchor on upside price action.
GBP/USD Daily Price Chart September 3, 2021
Retail trader data show shows 51.11% of traders are net-long with the ratio of traders long to short at 1.05 to 1. The number of traders net-long is 11.00% lower than yesterday and 23.47% lower from last week, while the number of traders net-short is 13.58% higher than yesterday and 29.20% higher from last week.
We typically take a contrarian view to crowd sentiment, and the fact traders are net-long suggests GBP/USD prices may continue to fall.Yet traders are less net-long than yesterday and compared with last week. Recent changes in sentiment warn that the current GBP/USD price trend may soon reverse higher despite the fact traders remain net-long.
{{SENTIMENT|GBP/USD}}
What is your view on GBP/USD– bullish or bearish?? You can let us know via the form at the end of this piece or you can contact the author via Twitter @nickcawley1.
Be the first to comment