

GBP/USD extended its decline below the 1.3500 support zone before correcting higher. GBP/JPY is rising and it could gain pace if it clears the 150.60 level.
Important Takeaways for GBP/USD and GBP/JPY
· The British Pound traded as low as 1.3411 before it started a fresh increase against the US Dollar.
· There was a break above a key bearish trend line with resistance near 1.3455 on the hourly chart of GBP/USD.
· GBP/JPY found support near 149.20 and started a decent increase.
· There is a major bearish trend line forming with resistance near 150.60 on the hourly chart.
GBP/USD Technical Analysis
This past week, the British Pound saw a drop below the 1.3650 support level against the US Dollar. The GBP/USD pair even broke the 1.3600 and 1.3500 support levels.
It traded as low as 1.3411 on FXOpen before it started a fresh increase. There was a steady increase above the 1.3450 resistance level. The price surpassed the 1.3500 resistance level and the 50 hourly simple moving average.
There was also a break above a key bearish trend line with resistance near 1.3455 on the hourly chart of GBP/USD. Besides, the pair surpassed the 38.2% Fib retracement level of the key decline from the 1.3717 swing high to 1.3411 low.
The pair even climbed above 1.3550 and retested the 1.3560 resistance levels. However, the pair is now facing resistance near the 1.3575 level. It is also struggling near the 50% Fib retracement level of the key decline from the 1.3717 swing high to 1.3411 low.
A close above the 1.3575 level could open the doors for more gains. The next major hurdle is near 1.3620, above which the pair could surge towards 1.3750. An immediate support is near the 1.3525 level.
The next major support is near the 1.3480 level and the 50 hourly simple moving average. If there is a break below the 1.3480 support, the pair could test the 1.3420 support. If there are additional losses, the pair could decline towards the 1.3350 level.
GBP/JPY Technical Analysis
The British Pound also declined and broke the 150.00 support zone against the Japanese Yen. The GBP/JPY pair traded as low as 149.22 before starting an upside correction.
The pair traded above the 149.80 and 150.00 resistance levels. The pair even climbed above the 23.6% Fib retracement level of the recent decline from the 152.56 high to 149.22 low.
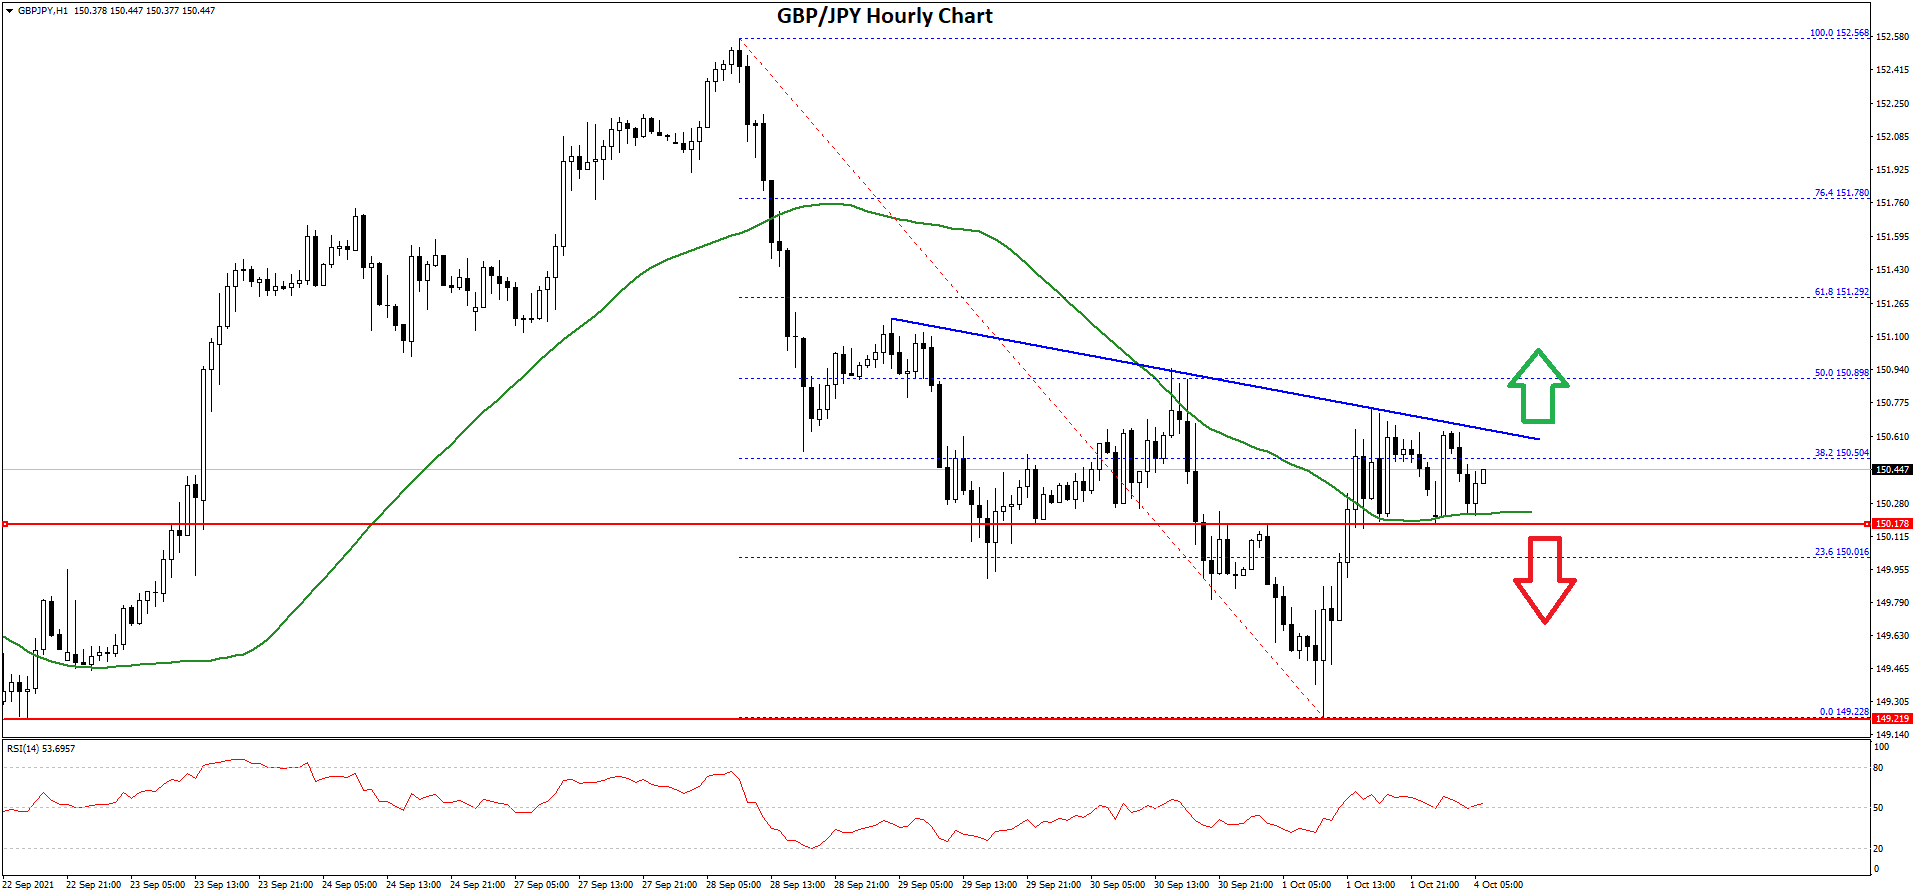
There was a close above the 150.20 level and the 50 hourly simple moving average. However, the pair is now facing resistance near the 150.60 level. There is also a major bearish trend line forming with resistance near 150.60 on the hourly chart.
The next key resistance could be 150.90 or the 50% Fib retracement level of the recent decline from the 152.56 high to 149.22 low. A clear break above the 151.00 resistance could push the pair towards the 152.00 resistance.
On the downside, an initial support is near the 150.15 level and the 50 hourly simple moving average. The next major support is near 150.00. If there is a downside break below the 150.00 support, the pair could accelerate lower towards the 149.25 level. The next major support is near 148.50.
This forecast represents FXOpen Markets Limited opinion only, it should not be construed as an offer, invitation or recommendation in respect to FXOpen Markets Limited products and services or as financial advice.

Be the first to comment