

GBP/USD started a fresh decline from well above the 1.3120 level. EUR/GBP is rising and might attempt an upside break above the 0.8300 resistance zone.
Important Takeaways for GBP/USD and EUR/GBP
· The British Pound started a fresh decline from well above 1.3120 against the US Dollar.
· There was a break below a key contracting triangle with support near 1.3060 on the hourly chart of GBP/USD.
· EUR/GBP formed a base above 0.8250 and is currently rising.
· There is a major bearish trend line forming with resistance near 0.8290 on the hourly chart.
GBP/USD Technical Analysis
The British Pound struggled to settle above the 1.3120 resistance zone against the US Dollar. The GBP/USD pair started a fresh decline below the 1.3080 support zone.
There was a clear move below the 1.3050 level and the 50 hourly simple moving average. The bears pushed the pair below the 50% Fib retracement level of the upward move from the 1.2972 swing low to 1.3146 high (formed on FXOpen).
Besides, there was a break below a key contracting triangle with support near 1.3060 on the hourly chart of GBP/USD.
The pair is now trading near 1.3020. The next major support sits near the 1.3110 level. It is near the 76.4% Fib retracement level of the upward move from the 1.2972 swing low to 1.3146 high. Any more losses could lead the pair towards the 1.2975 support zone or even 1.2950.
On the upside, an initial resistance is near the 1.3040 level. The next main resistance is near the 1.3070 zone and the 50 hourly simple moving average. A clear upside break above the 1.3070 and 1.3100 resistance levels could open the doors for a steady increase in the near term.
EUR/GBP Technical Analysis
The Euro gained bearish momentum after it broke the 0.8320 support zone against the British Pound. The EUR/GBP pair declined below the 0.8300 level and tested the 0.8250 support.
A low is formed near 0.8250 and the pair is now correcting losses. The pair was able to recover above the 0.8280 resistance zone and the 50 hourly simple moving average. It also moved above the 23.6% Fib retracement level of the key decline from the 0.8379 swing high to 0.8250 low.
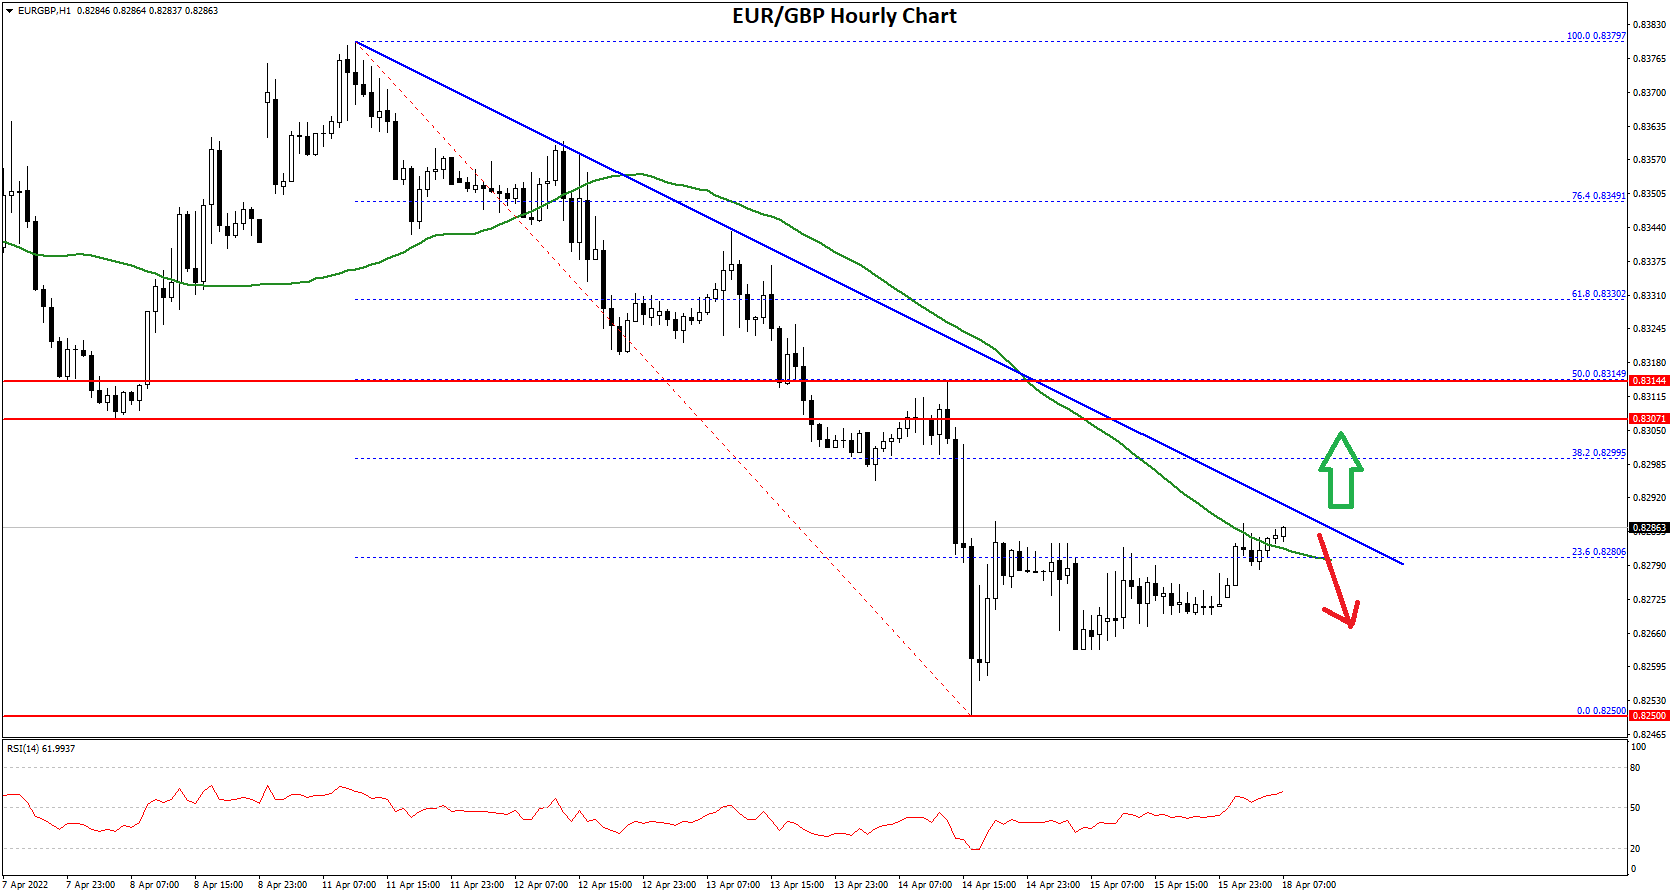
It is now consolidating losses and trading near the 0.8285 level. On the upside, the pair is facing resistance near the 0.830 level. There is also a major bearish trend line forming with resistance near 0.8290 on the hourly chart.
The next major resistance for the bulls is near the 0.8320 level or the 50% Fib retracement level of the key decline from the 0.8379 swing high to 0.8250 low. A clear move above the 0.8320 resistance might push the price higher.
The next main resistance on the upside is near the 0.8350 level, above which the pair could even climb above the 0.8400 resistance or 0.8420.
On the downside, an initial support is near the 0.8260 level. The next major support is near 0.8250 level. A downside break below the 0.8260 and 0.8250 support levels might call for more downsides. In the stated case, the pair could decline towards the 0.8200 support level in the near term.
This forecast represents FXOpen Markets Limited opinion only, it should not be construed as an offer, invitation or recommendation in respect to FXOpen Markets Limited products and services or as financial advice.

Be the first to comment