

GBP/USD climbed towards 1.2000 before it faced sellers. USD/CAD is rising and might gain pace above the 1.3450 resistance zone.
Important Takeaways for GBP/USD and USD/CAD
· The British Pound was able to move above the 1.1800 and 1.1900 resistance levels.
· There is a key bearish trend line forming with resistance near 1.1900 on the hourly chart of GBP/USD.
· USD/CAD tested the 1.3220 zone and started a recovery wave.
· There is a major bullish trend line forming with support at 1.3370 on the hourly chart.
GBP/USD Technical Analysis
After forming a base above the 1.1500, the British Pound started a steady increase against the US Dollar. GBP/USD gained pace for a move above the 1.1650 and 1.1800 resistance levels.
There was a move above the 1.1900 resistance and the 50 hourly simple moving average. The pair even moved above the 1.2000 level and traded as high as 1.2027 on FXOpen. It is now correcting gains and trading below the 1.1950 level.
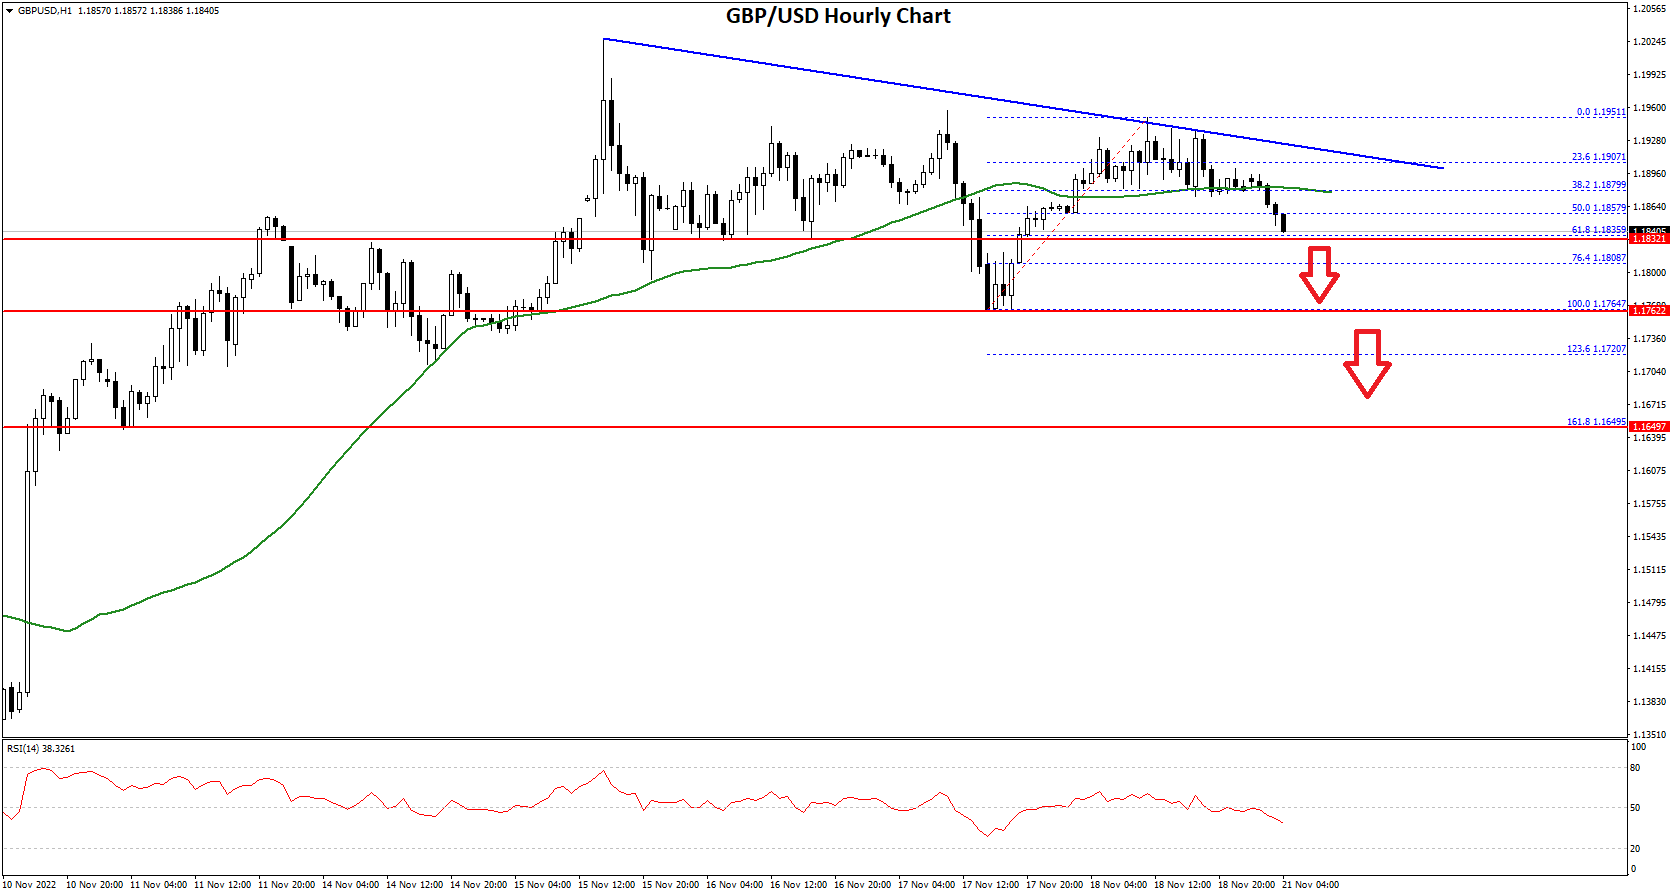
Recently, there was a move below the 1.1920 and 1.1880 support levels. The pair declined below the 50% Fib retracement level of the upward move from the 1.1764 swing low to 1.1951 high.
It is now trading below the 1.1880 level and the 50 hourly simple moving average. On the downside, an initial support is near the 1.1835 area. It is near the 61.8% Fib retracement level of the upward move from the 1.1764 swing low to 1.1951 high.
The next major support is near the 1.1765 level. If there is a break below 1.1765, the pair could extend its decline. The next key support is near the 1.1650 level. Any more losses might call for a test of the 1.1550 support.
An immediate resistance is near the 1.1880 level. There is also a key bearish trend line forming with resistance near 1.1900 on the hourly chart of GBP/USD.
The next resistance is near the 1.1920 level. The main resistance is near the 1.2000 level. If there is an upside break above the 1.2000 zone, the pair could rise towards 1.2120. The next key resistance could be 1.2200.
USD/CAD Technical Analysis
The US Dollar started a fresh decline from well above the 1.3550 zone against the Canadian Dollar. USD/CAD declined below the 1.3400 and 1.3300 levels.
It even spiked below the 1.3250 level and traded as low as 1.3226. Recently, it started a recovery wave above the 1.1320 level. The pair even climbed above the 1.3350 level and the 50 hourly simple moving average.
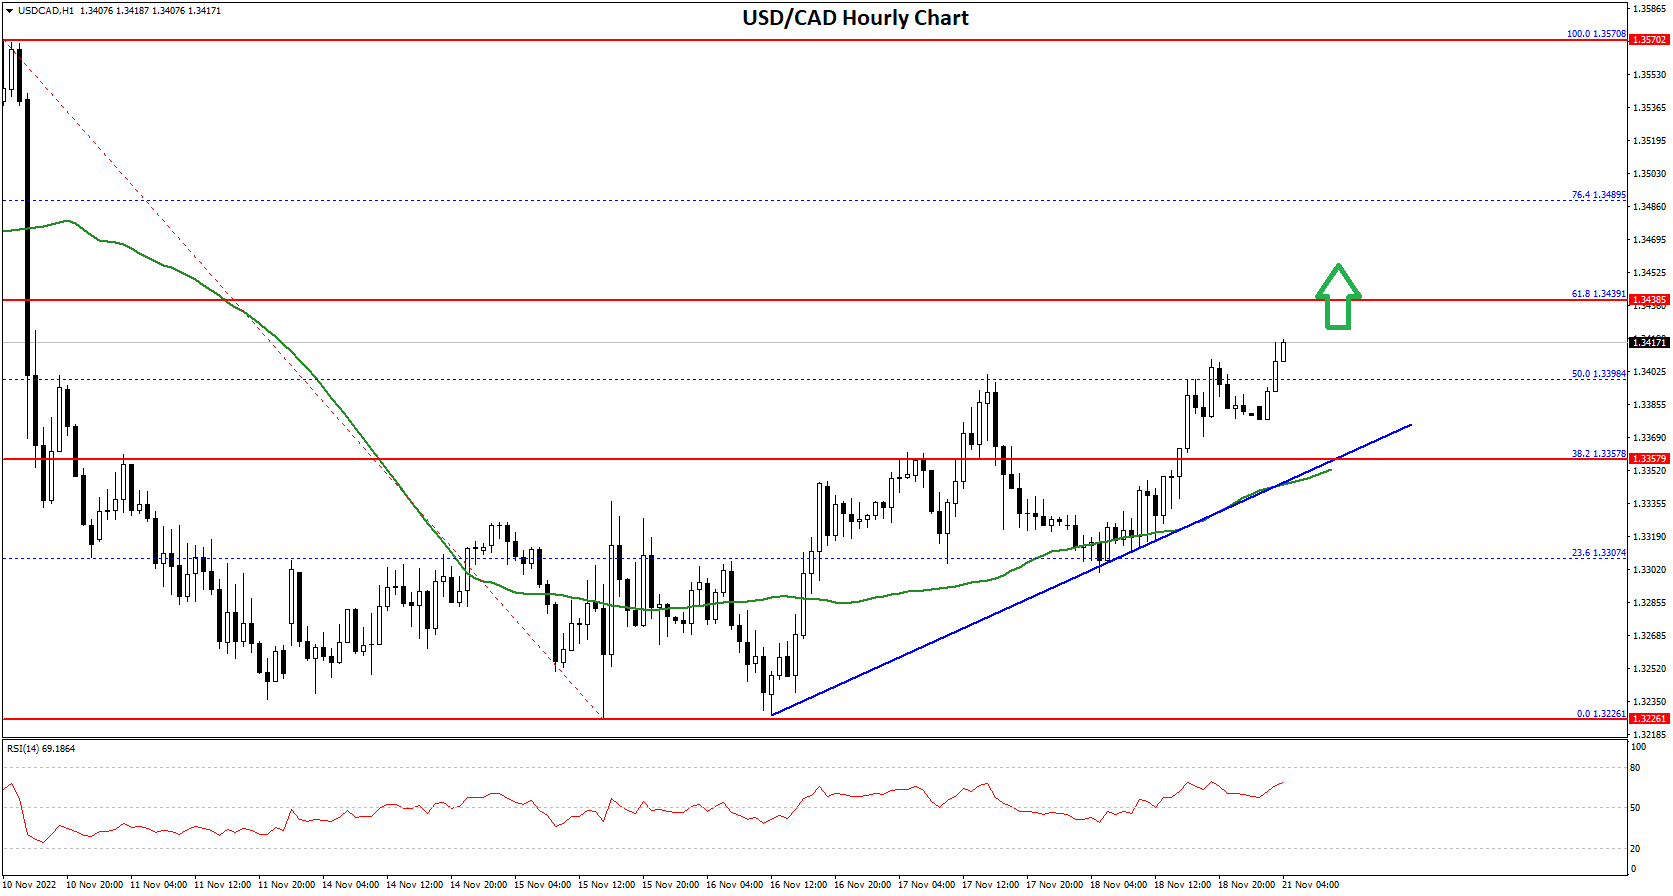
There was a move above the 50% Fib retracement level of the downward move from the 1.3570 swing high to 1.3226 low. It is now facing resistance near the 1.3440 zone.
The 61.8% Fib retracement level of the downward move from the 1.3570 swing high to 1.3226 low is also near the 1.3440 zone. The next major resistance is near the 1.3500 level. A clear break above the 1.3500 level could open the doors for more gains.
The next major resistance is near the 1.3570 level, above which USD/CAD could rise steadily towards the main 1.3750 resistance zone.
An immediate support is near the 1.3370 level. There is also a major bullish trend line forming with support at 1.3370 on the hourly chart. The first major support is near the 1.3320 level. Any more losses may possibly open the doors for a drop towards the 1.3225 support zone in the near term.
This forecast represents FXOpen Companies opinion only, it should not be construed as an offer, invitation or recommendation in respect to FXOpen Companies products and services or as financial advice.
Be the first to comment