

Moussa81/iStock via Getty Images
Introduction
Note: Galiano Gold (NYSE:GAU) currently operates and manages the Asanko gold mine or AGM, located in Ghana, West Africa, jointly owned with Gold Fields (GFI). Also, Galiano Gold owns the Asumura project indicated below.
I recommend reading my recent article on GFI published on March 23, 2022, by clicking here.
GAU: Map Presentation (Galiano Gold)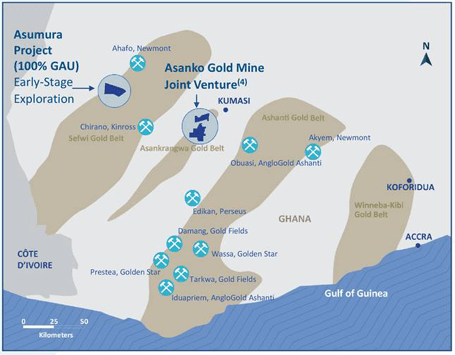
On March 29, 2022, Galiano Gold reported financial results for the fourth quarter and full-year 2021.
1 – 4Q21 and full-year 2021 Snapshot
Galiano Gold reported that gold production at the Asanko gold mine in Ghana was 50,278 ounces during 4Q21, down 23.3% from 65,571 ounces produced in 4Q20.
The annual gold production was 210,241 ounces, below the revised 2021 production guidance of 215K‐ 220K ounces, as mined grades were lower than planned.
Total cash costs per ounce were $1,257, and all-in sustaining costs (“AISC”) were $1,539/oz during the quarter.
On March 23, 2022, we learned that Mr. Fausto Di Trapani stepped down to pursue another opportunity and continue serving as CFO until his departure in early May 2022. According to its succession plan, the company plans to appoint Matt Freeman, current SVP of Finance, as its new CFO.
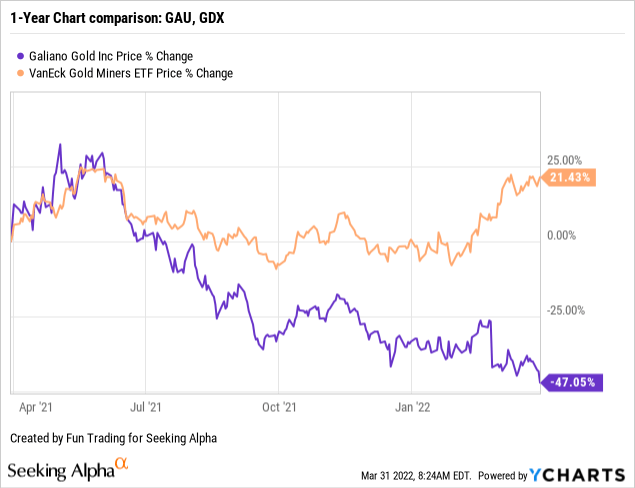
2 – Stock performance
Galiano Gold has significantly underperformed the VanEck Gold Miners ETF (GDX) and is now down 38% on a one-year basis.
3 – Investment Thesis
As I said in my preceding article, Galiano Gold’s business model is too limited to be considered “safe” from a long-term investor’s perspective.
The sole interest here is to use GAU as a trading tool.
Thus, I recommend trading essentially short-term LIFO GAU using technical analysis.
Galliano Gold – 4Q21 Balance Sheet. The Raw Numbers
Note: The Joint Venture is split 50/50 for the 90% economic interest, with Ghana Government holding 10%. Therefore, Galiano Gold owns 45% of the Joint Venture.
| Galiano Gold | 4Q20 | 1Q21 | 2Q21 | 3Q21 | 4Q21 |
| Total Revenues $ million (100% basis) | 111.10 | 110.80 | 95.20 | 85.28 | 91.08 |
| Quarterly Earnings $ million | 17.67 | 13.03 | 5.00 | 4.12 | -14.48 |
| EBITDA $ million | 17.71 | 13.08 | 5.06 | 4.17 | -83.55* |
| EPS (diluted) $ per share | 0.08 | 0.06 | 0.02 | 0.02 | -0.40 |
| Operating Cash Flow $ million | -1.56 | -4.68 | -3.13 | -2.84 | -2.29 |
| CapEx in $ million | 0.02 | 1.49 | 0.00 | 0.00 | 0.03 |
| Free Cash Flow | -1.58 | -6.16 | -3.14 | -2.84 | -2.32 |
| Total cash in $ million (100% basis) | 62.15 | 61.24 | 58.55 | 55.84 | 53.52 |
| Total LT Debt (incl. current) in $ million | 0.00 | 0.00 | 0.00 | 0.00 | 0.00 |
| Shares Outstanding (diluted) in million | 225.37 | 225.02 | 225.29 | 225.07 | 224.94 |
Source: Company release. Fun Trading files.
* Indicated by the company
Analysis: Revenues, Free Cash Flow, Debt, and Gold Production
1 – Quarterly revenues were $91.08 million in 4Q21 (100% basis)
GAU: Quarterly Balance sheet data History (Fun Trading )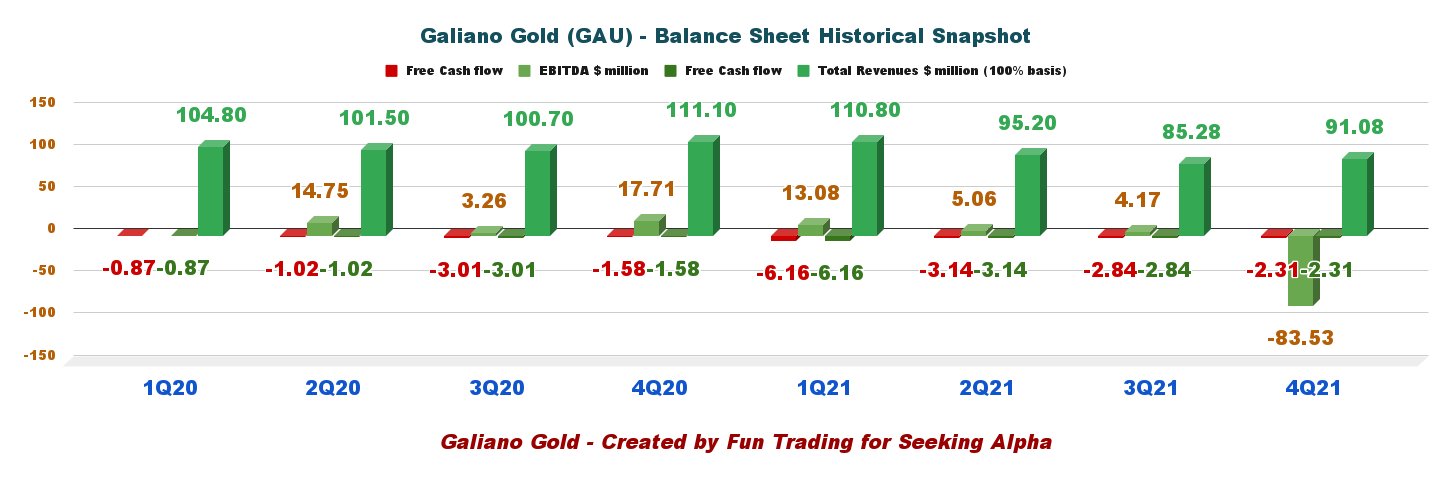
Galiano Gold announced that 4Q21 gold revenue was $91.075 million based on 51,368 ounces sold at an average gold realized price of $1,771 per ounce. Net loss in 4Q21 was $14.48 million or 0.40 per share. The adjusted net loss was $14.5 million or $0.06 per share.
As the AGM was not in a position to declare mineral reserves, the Joint Venture recorded a $153.2 million impairment charge against its mineral properties, plant, and equipment, and, accordingly, the JV reported a net loss for the year totaling $114.5 million and an adjusted net income1 of $38.7 million.
2021 gold revenue was $381.7 million was generated from 216,076 gold ounces sold at an average realized price of $1,767/oz and Adjusted EBITDA of $76.7 million.
2 – Free cash flow was a loss estimated at $2.31 million in 4Q21
Free cash flow is cash flow from operations minus CapEx. Trailing 12-month free cash flow ttm was a loss of $14.45 million with an estimated loss of $2.31 million in 4Q21.
3 – Still, no debt in 4Q21 and total cash of $53.52 million.
GAU: Chart Quarterly Cash History (Fun Trading)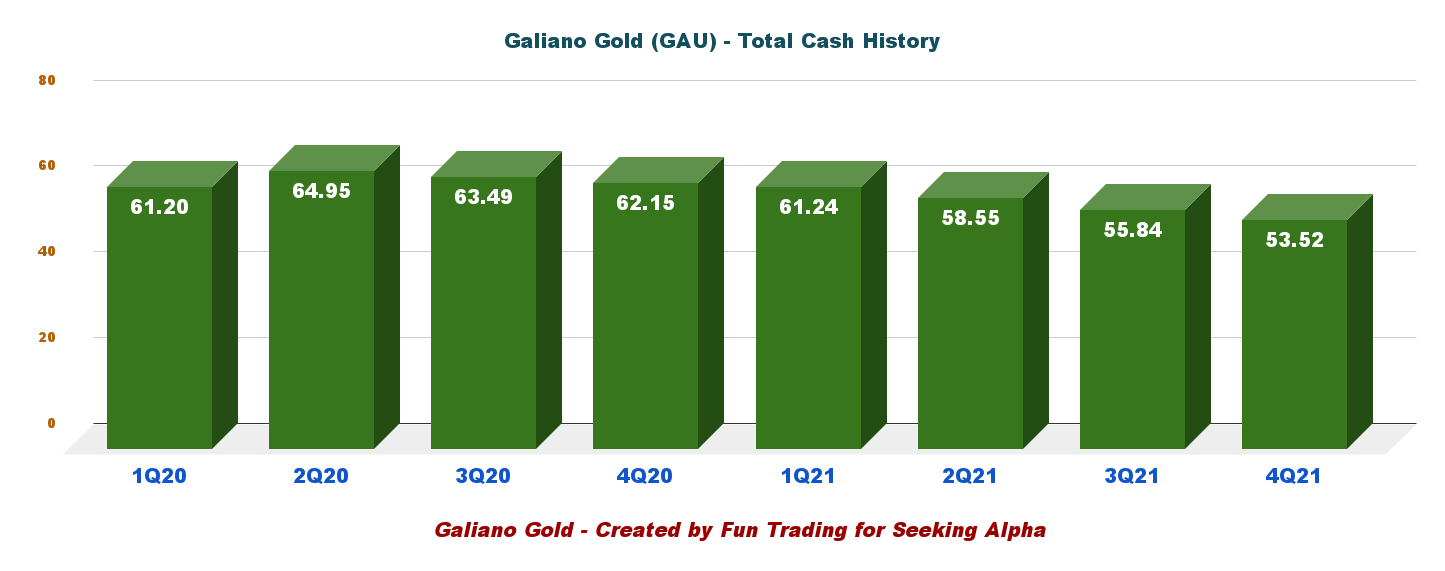
The cash position is going down, as seen in the chart above. However, during the year ended December 31, 2021, the JV repaid the $30.0 million in full, then outstanding on the revolver with Rand Merchant Bank.
Important Note: On June 25, 2020, the Company entered into an ATM agreement with H.C. Wainwright & Co. and Cormark Securities (the “Agents”). At its discretion and from time to time during the term of the ATM agreement, the Company may sell through the Agents common shares of the Company for aggregate gross proceeds to the Company of up to $50.0 million. As of December 31, 2021, the Company had not issued any common shares under the Offering.
4 – Quarterly gold production analysis
Galiano Gold reported that gold production at the Asanko gold mine in Ghana was 50,278 ounces during 4Q21 and sold 51,368 ounces, down 23.3% compared to 4Q20.
The loss from mine operations for 4Q21 totaled $8.9 million compared to an income from mine operations of $46.3 million in 4Q20. The reduction in income from mine operations was due to a $20.0 million decrease in revenue and a $35.2 million increase in the cost of sales.
During 4Q21, the AGM primarily sourced ore from the Esaase Main pit, which delivered 1.5Mt of ore at an average gold grade of 1.3g/t and a strip ratio of 4.3:1. At the Akwasiso pit, waste stripping activities for the Cut 3 pushback were completed, with 0.1Mt of ore mined during the quarter at an average gold grade of 1.2g/t.
GAU: Quarterly Gold production history (Fun Trading)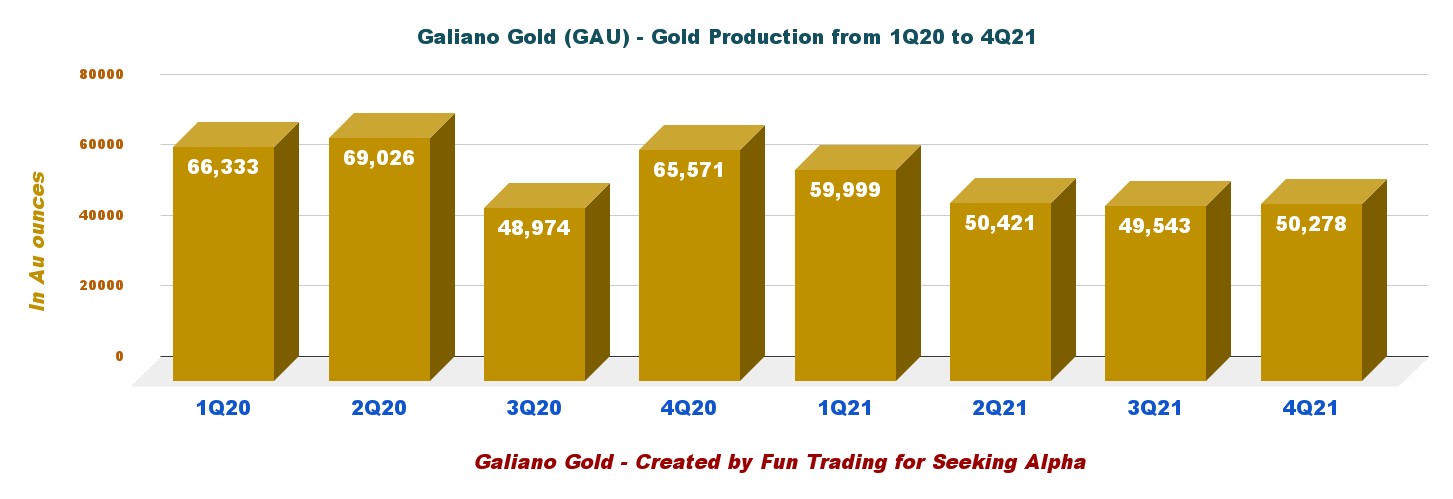
AISC has increased significantly in 4Q21 due to higher ore transportation costs and a new tax imposed by Ghana. It is now $1,539 per ounce, which shows some progress compared to the record-high of the preceding quarter.
GAU: Quarterly AISC and Gold price history (Fun Trading)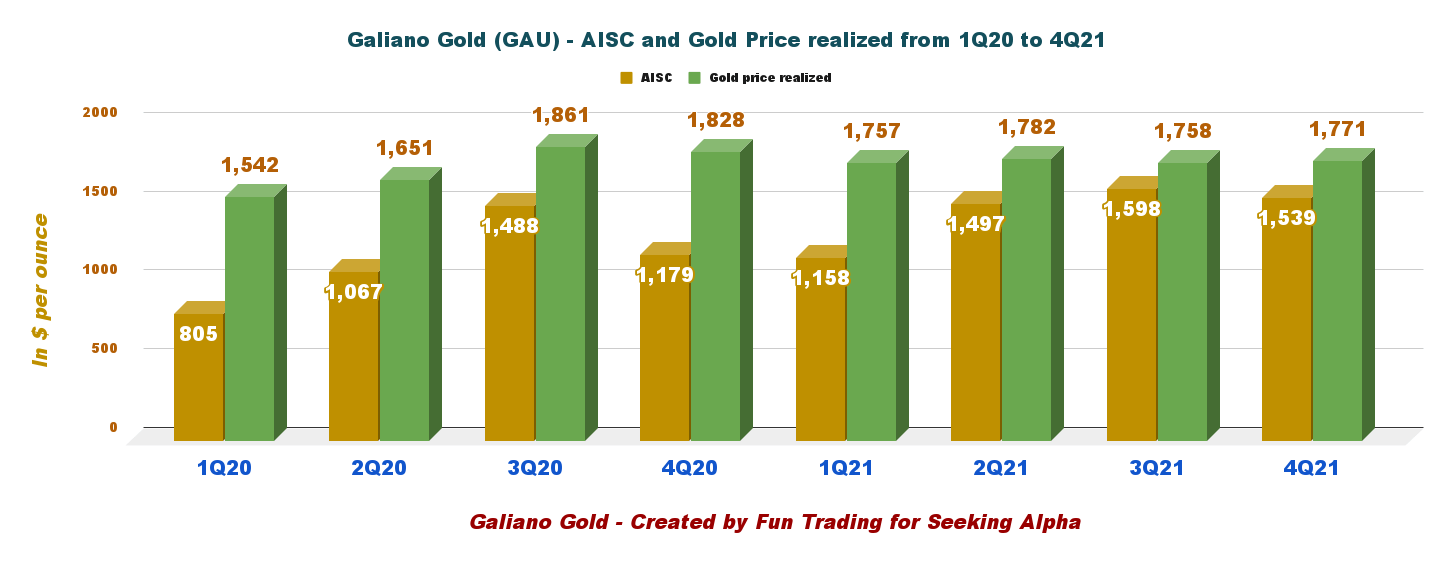
5 – Full-year 2022 guidance and mineral reserves.
Note: Updated reserves are expected to be published in 1Q22.
5.1 – The company expects AGM to produce 100K‐120K ounces of gold in 2022.
Technical work to support a Mineral Reserve at the AGM is ongoing. Mining will continue at Akwasiso Cut 3, and Esaase Cut 3 until their depletion, expected in 2Q22. After that, the process plan will continue to operate at full capacity to process the existing 9.5 million tonnes of stockpiles.
5.2 – On March 29, 2022, Galiano provided an Updated MRE for the Asanko Gold Mine (100% basis)
The AGM is reporting updated Measured and Indicated Mineral Resource Estimates of 66.4 million tonnes (“Mt”) at 1.36 g/t for 2.9 million ounces (“Moz”) gold contained. At this time the Company is not in a position to declare Mineral Reserves on the AGM property as a result of current metallurgical uncertainty of the material mined from Esaase (please see the Company’s press release dated February 25, 2022, for further information).
Matt Badylak, President and CEO, said in the press release:
The impact on the operations at the AGM resulting from the observed reductions in contained metal and lower grades at Esaase will be described in an updated technical report, which we anticipate publishing following the completion of the metallurgical testwork underway at Esaase,
Technical Analysis and Commentary
GAU: TA Chart (Fun Trading )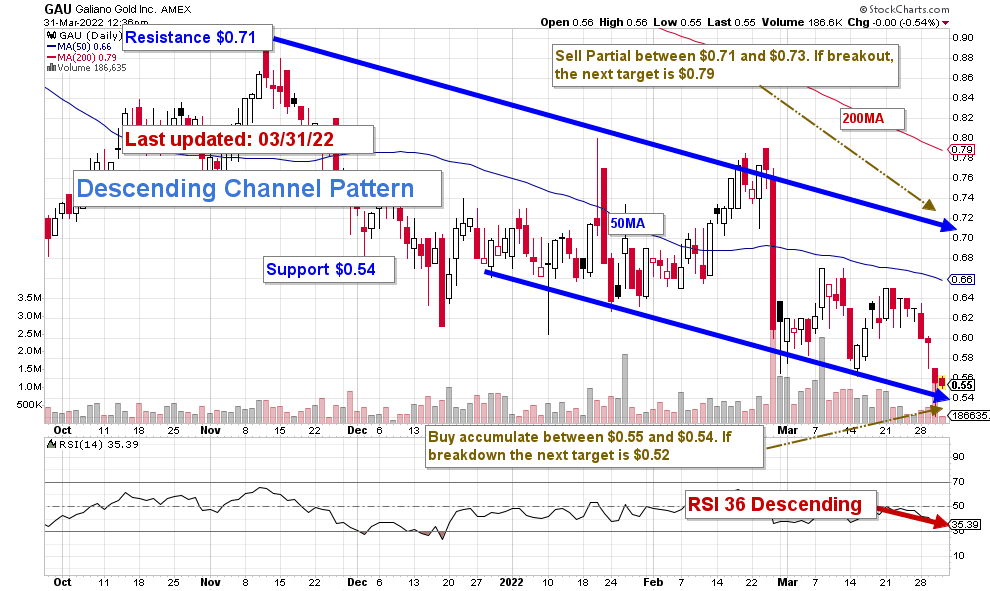
GAU forms a Descending channel pattern with resistance at $0.71 and support at $0.54. The trading strategy is to sell partially between $0.71 and $0.73 and buy/accumulate between $0.55 and $0.54, whichever comes first.
If the gold turns bearish due to the Fed turning more hawkish to stabilize rampant inflation, the gold price will likely drop below $1,850 per ounce, and GAU could eventually fall as low as $0.52.
Conversely, if the gold price turns bullish and crosses $1,975 per ounce, GAU could eventually break out of the pattern and reach $0.90 again.
The gold price is now high at $1,945 per ounce, and I believe the Fed will start increasing interest rates significantly in 2022.
Thus, I recommend trading LIFO with a medium position and eventually keeping a tiny core long position for a higher target.
Watch the gold price like a hawk.
Warning: The TA chart must be updated frequently to be relevant. It is what I am doing in my stock tracker. The chart above has a possible validity of about a week. Remember, the TA chart is a tool only to help you adopt the right strategy. It is not a way to foresee the future. No one and nothing can.
Author’s note: If you find value in this article and would like to encourage such continued efforts, please click the “Like” button below as a vote of support. Thanks!
This writing is for informational purposes only. All opinions expressed herein are not investment recommendations and are not meant to be relied upon in investment decisions. The author is not acting in an investment advisor capacity and is not a registered investment advisor. Thanks!
Be the first to comment