Key Talking Points:
- The FTSE 100 cools off the strong start to the year
- US CPI data released this afternoon will be an important gauge of inflationary pressure

Recommended by Daniela Sabin Hathorn
Get Your Free Equities Forecast
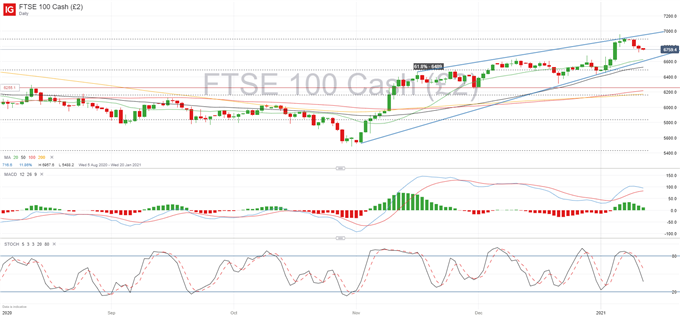
Despite staging one of the strongest performances in the new year in the equity space, the FTSE 100, like all other major European indices, is coming off its recent highs after being rejected at the 76.4% Fibonacci retracement level.
Bullish momentum has been stalling for a while now, so corrective pullbacks are no surprise, especially as traders take a breather to assess the current outlook. Fundamentally, despite a somewhat suave resolution to Brexit, the ongoing health crisis has prevented the FTSE 100 from realizing its full potential, meaning the UK index is still lagging other major European counterparts.
Full conversion is likely to take some time, given the FTSE 100 is vulnerable to the same factors as the wider stock market, with added domestic concerns. There is a lot riding on inflation numbers in the near future, as current readings need to remain stable for bond yields to remain near lows and asset prices to keep momentum going.
Today’s reading on US CPI is likely to catch eyes as investors are considering whether inflation concerns are premature or a true fact. Core CPI is expected to be up 0.1% month on month and 1.6% for the year, but a sharp increase in bond yields after the Democrats were confirmed as the winners of the two Senate seats up for grab in Georgia has increased inflation expectations.
Covid-19 has had an uneven impact on inflation given how house prices have been rising whilst rents have been falling, so I don’t think inflation is a serious concern at present, but expect the market to be closely watching CPI this afternoon.
FTSE 100 Daily chart
The daily chart shows a rising wedge pattern that limits price action to two rising trend lines, which is a strong sign that price reversal may happen in the near future. We could see a new retest of the wedge support at the 6,600 mark where the 20-day simple moving average converges, an area that may spark new buyer interest. If so, it’s hard to imagine a break above the 76.4 % Fibonacci (6,895) amid current conditions as this remains a key area of resistance, followed by the January 7th high at 6,957. To the downside, below the 6,600 level we may see the 61.8% Fibonacci (6,489) come into play followed by the 6,255 horizontal support.
| Change in | Longs | Shorts | OI |
| Daily | 12% | -14% | 0% |
| Weekly | 51% | -27% | 6% |
Learn more about the stock market basics here or download our free trading guides.
— Written by Daniela Sabin Hathorn, Market Analyst
Follow Daniela on Twitter @HathornSabin


Be the first to comment