

Sterling (GBP) and FTSE 100 Prices and Analysis:
- Massive risk-off move continues as coronavirus headlines drive the market.
- Sterling continues to grind higher and looks to re-take GBP/USD 1.3000.
FTSE 100 Sell-Off Continues Ahead of US Jobs Report
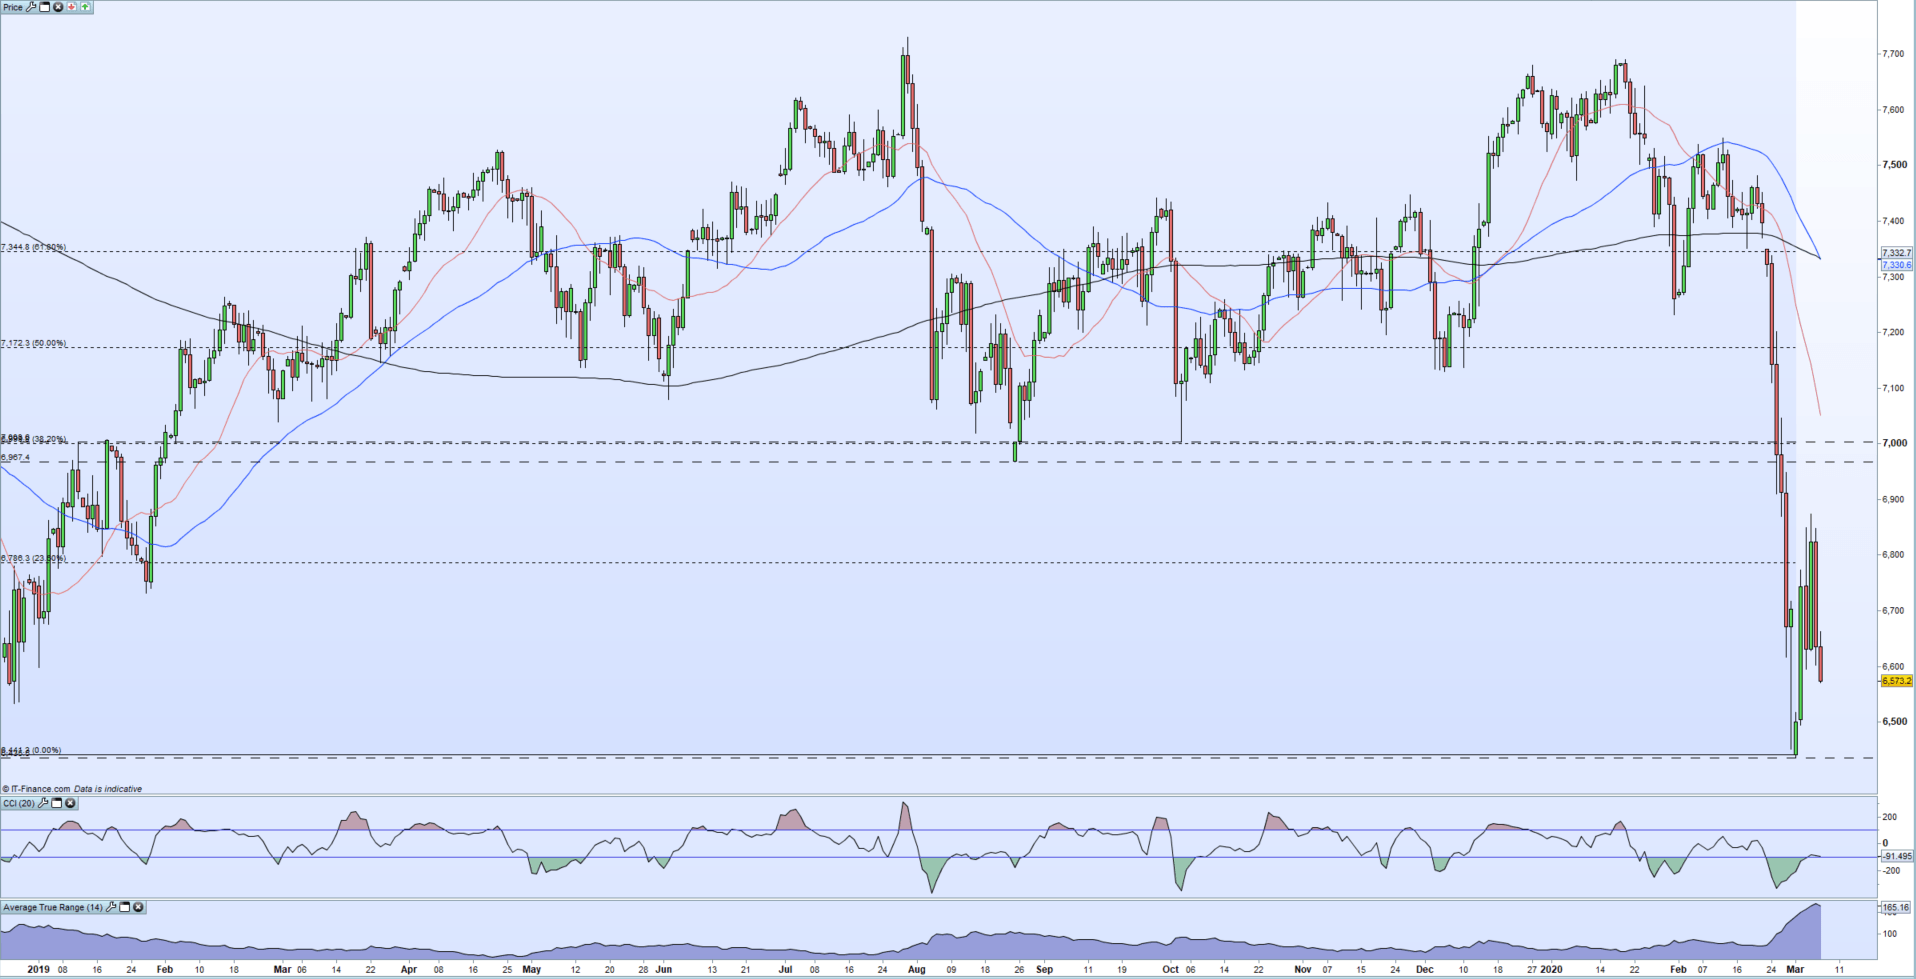
The FTSE 100 continues its recent heavy sell-off which has seen the index fall around 1000 points from the recent high made on January 20 this year. Global financial markets have been roiled by the ongoing spread of the coronavirus and the effect that it is having on global trade. Recent central bank action to add liquidity to the markets has done little to boost investor confidence and most global equity indices are only a handful of percentage points away from being in full-blown bear market territory. The FTSE 100 has not been immune to the heavy sell-off and this week hit its lowest level since July 2016. Next week the Chancellor of the Exchequer will present his first Budget and expectations of a hefty fiscal boost for the UK economy are high.
FTSE 100 Daily Price Chart (January 2019 – March 6, 2020)

Recommended by Nick Cawley
Download our Q1 Sterling Forecast
GBP/USD Looks to Re-Test 1.3000 as the US Dollar Slumps
Cable has benefitted all week from a weakening US dollar and has added around 250 pips over the week in one-way trade.The pair have made a series of higher lows all week, broken through the 20-dma and now eye the 50-dma currently trading at 1.2990. Sterling is seemingly supported by a central bank who are unlikely to cut interest rates ahead of the next MPC meeting on March 26. The central is fully expected to cut rates by 0.25% at this meeting, but Sterling is waiting to see the outcome of next week’s Budget before making any further moves.
The US Non-Farm Payroll release at 13:30 GMT today is expected to add further volatility into a market that is struggling with whip-saw moves and sentiment shifts.
DailyFX analyst Justin McQueen will cover the US Jobs Report Live from 13:15 GMT
| Change in | Longs | Shorts | OI |
| Daily | -9% | 10% | -2% |
| Weekly | -12% | 9% | -5% |
GBP/USD Daily Price Chart (July 2019 – March 6, 2020)

For all market moving data and events, see the DailyFX Calendar.
Traders may be interested in two of our trading guides – Traits of Successful Traders and Top Trading Lessons – while technical analysts are likely to be interested in our latest Elliott Wave Guide.
What is your view on Sterling (GBP) and the FTSE 100 – bullish or bearish?? You can let us know via the form at the end of this piece or you can contact the author via Twitter @nickcawley1.
Be the first to comment