


cemagraphics
Written by Nick Ackerman, co-produced by Stanford Chemist. This article was originally published to members of the CEF/ETF Income Laboratory on December 3rd, 2022.
I covered Franklin Limited Duration Income Trust (NYSE:FTF) earlier this year in June. I felt the fund’s discount was quite attractive, but we were in the middle of an aggressive Fed. One of the reasons that FTF became relatively attractive was the fund’s rights offering at the beginning of the year, which pushed it to trade at a wide discount. Of course, an overall souring on fixed-income investments, especially leveraged closed-end funds, would presumably be another factor.
2021 was a remarkable year, with CEFs touching historic highs in terms of reduced discounts and funds going to premiums. Some funds went to premiums that had never traded at premiums before. Some of this unwound through 2022. That’s generally the case when there is increased volatility in the broader markets. 2022 has kept that trend alive as CEF discounts remain wide.
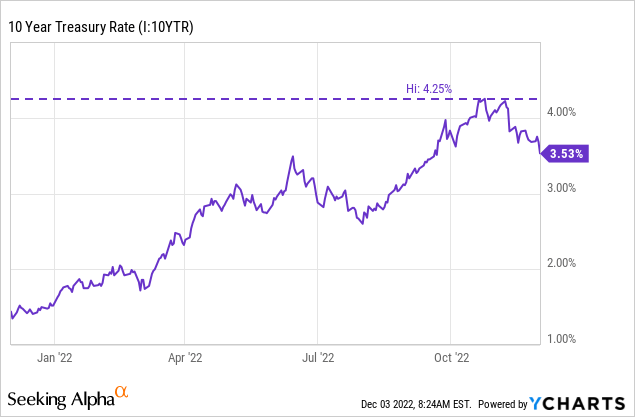
Fixed-income funds should look pretty interesting for investors who believe we are nearing an end to an aggressive Fed. That isn’t to say we won’t see further interest rate increases; it is widely expected that we will. In fact, it is even expected now that we could go higher than the 5% terminal rate that was expected previously. All that being said, the 10-Year Treasury Yield has already responded sharply to the expectation of a slowdown in the pace of increases. This kicked off a run higher for all other fixed-income, FTF included.
Ycharts
Things are likely to start rallying before the Fed actually pauses or cuts. This first initial rally here might be short-lived, or it could be the start of the new bull. That I don’t claim to know, but I would say that FTF presents a more interesting opportunity at this time than in June of this year. The fund’s discount remains wide, and I would suspect we are closer to the end of the rate hiking cycle than we were in June. Which seems fairly obvious, given the expectation for 50 basis point hikes going forward.
The Basics
- 1-Year Z-score: -0.57
- Discount: 10.28%
- Distribution Yield: 10.95%
- Expense Ratio: 1.31%
- Leverage: 33.02%
- Managed Assets: $413 million
- Structure: Perpetual
FTF’s investment objective is “to provide high, current income, with a secondary objective of capital appreciation.” They do this by investing “primarily in high yield corporate bonds, floating rate corporate loans and mortgage- and other asset-backed securities.”
Since the fund has a tilt toward limited duration, this is where the floating rate corporate loans come in. This can keep the fund’s duration in check since they are less sensitive to interest rate risks. However, this portfolio is also going to be tilted toward lower-rated companies. This can leave it more vulnerable during recessions or economic slowdowns.
The fund’s expense ratio comes to 1.75% when including the leverage expenses. As interest rates rise, this is a negative for them as their interest expenses will rise. They borrow through a credit facility and utilize reverse repurchase agreements. However, since a sizeable portion of their portfolio is allocated to bank loans, that acts as a natural hedge.
Performance – Attractive Discount, But Results Are Lackluster Historically
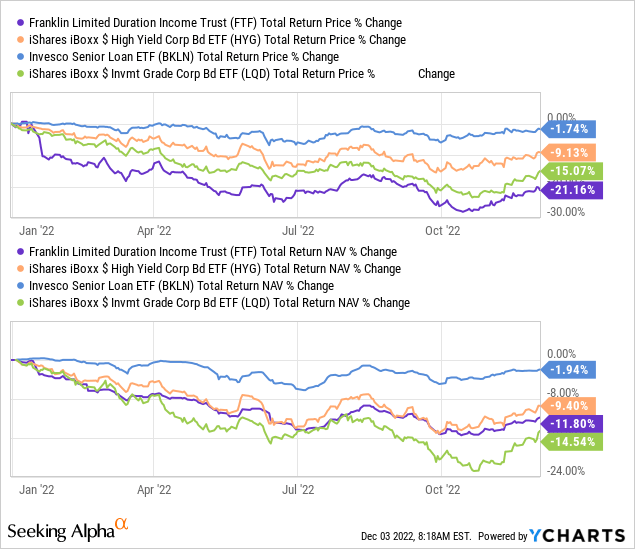
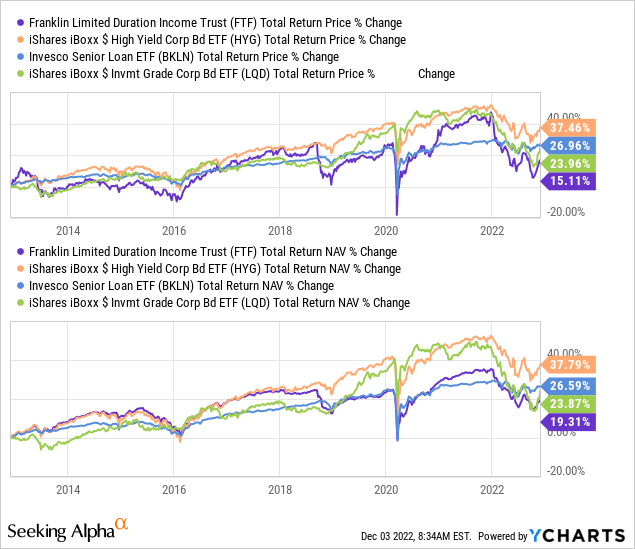
On a YTD basis, FTF’s leverage seemed to have hurt the fund. Below we compare the fund’s performance to non-leveraged iShares iBoxx $ High Yield Corporate Bond (HYG) and Invesco Senior Loan (BKLN). They have very minimal exposure to investment-grade bonds, but for fun, I’ve included iShares iBoxx $ Investment Grade Corporate Bond (LQD).
What we can see is that LQD has actually performed the worst on a total NAV return basis. However, on a total share price return basis, FTF has performed the worst as its discount widened significantly.
One thing that I noted in the last article was that the limited duration of FTF hasn’t seemingly helped this fund at all. With a duration of 1.78 years, we would expect significantly less downside pressure due to interest rates. That’s where leverage and credit risks seem to be hitting the fund harder. For some context, HYG’s duration is 3.94 years.
Ycharts
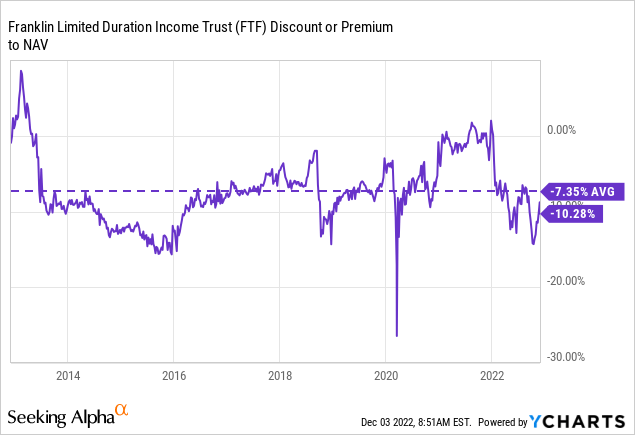
That’s primarily where there could be some opportunity, as the discount is currently wider than in the last decade. However, it was very recently even wider yet. As the risk-free rate came down sharply, as shown at the opening of this article, the fund rallied pretty hard.
Ycharts
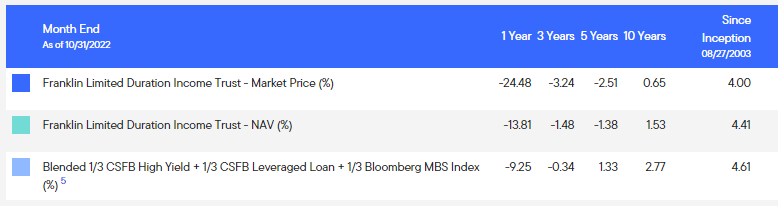
Over the longer term, the fund has done rather poorly. I don’t think there is any denying that. A lot of the declines in the annualized performance are due to such a drop this year. That being said, its blended benchmark hasn’t been impressive either.
FTF Annualized Performance (Franklin)
Bank loans and investment-grade corporate bonds have actually done quite similarly over the last decade. I think what is more interesting overall is just how poorly the results of fixed income have been during the last decade. A lot of this has to do with the significant drops this year to drag everything lower. Looking at past performance results while in a bear market tends to have that effect.
As we saw above, BKLN was the best performing on a YTD basis. So the worst place to seemingly be invested in has been investment-grade, not only YTD but over the last decade. It has been the high-yield corporate segment represented by HYG that has done the best.
FTF has also been the biggest laggard at this time; it would appear that around 2018 is when the fund started to perform poorly. Otherwise, it was holding up with HYG prior to this. I would also mention that these don’t exactly represent the benchmark they employ, but gives us some context of how things are performing relative to other fixed-income investments.
Ycharts
I think it was a coincidence and not the root cause, but 2018 was the year the fund transitioned from its preferred shares, began a credit facility, and utilized reverse repurchase agreements. They didn’t deleverage as the preferred leverage was $25 million. The credit facility and reverse repurchase agreements began at $90 million following that. So they increased leverage during this time, but it was right before the market dropped in Q4 2018. It could indicate poor timing to increase their leverage.
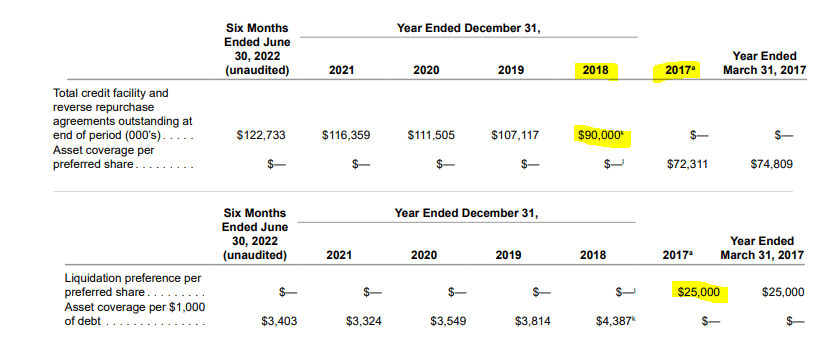
FTF Leverage (Franklin)
Distribution – Managed 10%
The current distribution works out to 10.90%, and the NAV distribution rate comes to 9.78%. That would seem quite elevated, but we also aren’t living in the interest rate world we were a year ago. The yield to maturity on this portfolio comes to 9.44%. The fund also employs a 10% managed distribution plan.
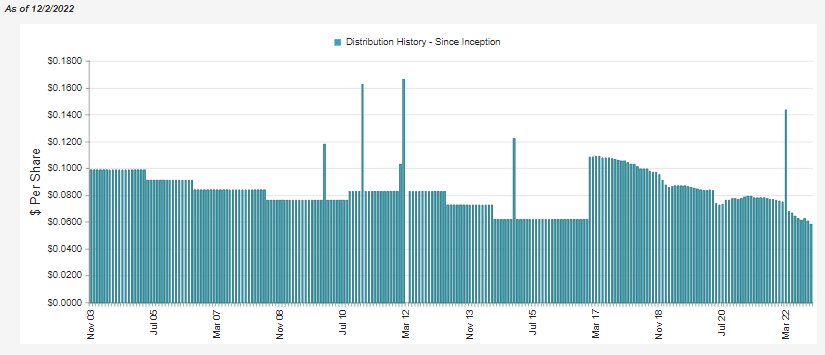
FTF Distribution History (CEFConnect)
The managed distribution is based on the NAV. So as the NAV declines, so does the distribution for the fund. At some point, this will reverse and now that yields are coming closer to that figure, it should bode well for the fund going forward.
We’ve also seen net investment income increase in the latest report.
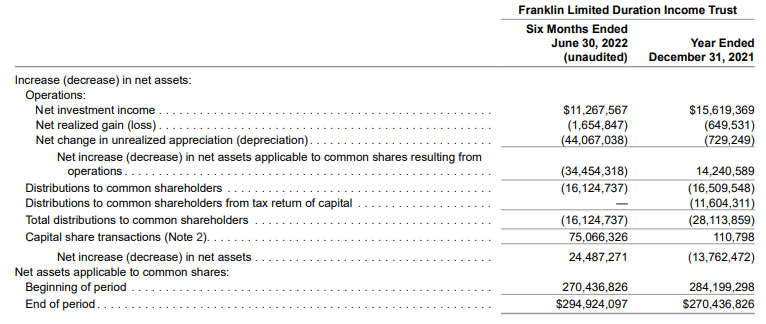
FTF Semi-Annual Report (Franklin)
Part of that was due to the rights offering and increased leverage earning more. However, on a per-share basis, the fund reported NII of $0.52 for the last fiscal year. In the latest semi-annual, it came to $0.30. Looking at this another way, the NII percentage to average NAV for fiscal 2021 was 5.58%, and this latest report shows 7.50%.
So it would appear the added capital was accretive, or at least the floating rate loans in their portfolio helped. In the next report, I would suspect NII to increase even further, as the 75 basis points came in during the last month of this report.
This would be helpful because, in the report we see above, the NII coverage only comes to around 70%. Meaning that even though interest rates are rising and NII improved for the fund, it wasn’t enough to cover the fund’s payout yet. Therefore, the 10% managed distribution plan is still eroding the fund. As a fund erodes, it becomes harder and harder to sustain. The downward slope can be hard to reverse.
FTF’s Portfolio
FTF is primarily invested in high-yield corporates and bank loans.
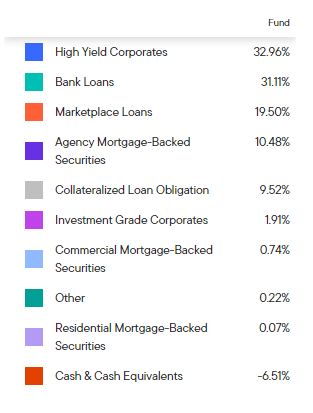
FTF Asset Allocations (Franklin)
Marketplace loans, agency MBS and CLOs also make up a fair bit of the fund too. Marketplace loans are short-term borrowings to individuals in relatively small increments. At the same time, the yields are absolutely insane on some of these. In their last semi-annual report, they list thousands of these loans literally. So while it might be around 20% of their portfolio, it takes up from page 34 to page 167 in their last report listing them. That’s why CEFConnect shows 15,885 positions for FTF. FTF lists 604 holdings.
In my quick pass-through (sorry, not looking at all 15,500 loans,) I see interest rates between around 10% and 30%. Maturities on these seem to be anywhere from 2022 to 2029. The loan amounts go from a couple of hundred bucks to some near $30k.
Additionally, marketplace loans make their way to the top ten. This is because they get consolidated into the companies issuing these loans that are backed by funds such as FTF.
Upstart, Freedom Financial, Prosper Guided Select Program and Lending Club are those loan lending platforms. So these investments aren’t investments in these companies but investments in the underlying loans that originated through these platforms.
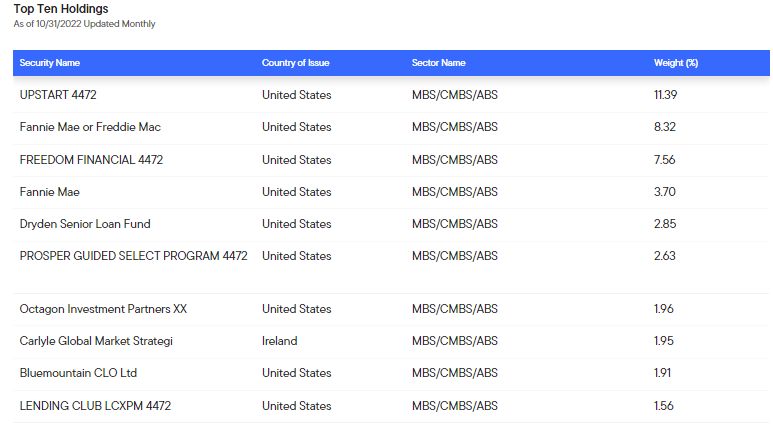
FTF Top Ten Exposure (Franklin)
They see these marketplace loans as good investments providing absolute returns in the year’s first half. They included some more notes in their last report on these loans. It isn’t an area I’m overly familiar with, so seeing what they say can provide a better overview of the current state.
Despite increased volatility across major asset classes over the past six months, marketplace loans still generated positive absolute returns and attractive relative returns each month due to their high coupons and short duration. Against a backdrop of rising rates, elevated recessionary concerns, and a general risk-off tone, however, marketplace loan prices during the first half of 2022 were not immune to asset price volatility. Underlying collateral performance has been fairly vintage-specific. For example, loans purchased in the second half of 2021 have experienced an increase in early delinquencies as excess liquidity from COVID related stimulus has evaporated. The reduction in stimulus, combined with the rising rate environment, prompted numerous marketplace lenders to tighten their credit boxes and increase their coupons. As such, the risk-adjusted return profile of the 2022 marketplace loan vintages appears more attractive than that of the loans originated in the second half of 2021, which led to an increase of marketplace loan purchases in the portfolio
From there, the other securities that stand out are Fannie Mae and Freddie Mac. These will be the positions we see under the agency MBS category. These would also be considered high-quality investments as these U.S. Government Agencies back them.
Overall, this means that FTF’s portfolio is positioned primarily in lower credit-rated investments.
Conclusion
FTF is leveraged and invests in lower-quality bonds and loans, which means greater risks overall. The current interest rate hiking cycle is probably closer to the end than the beginning. That can be good news for fixed-income investments. FTF also sports an attractive discount, which could mean results going forward would be better than in the past.
Be the first to comment