

Justin Sullivan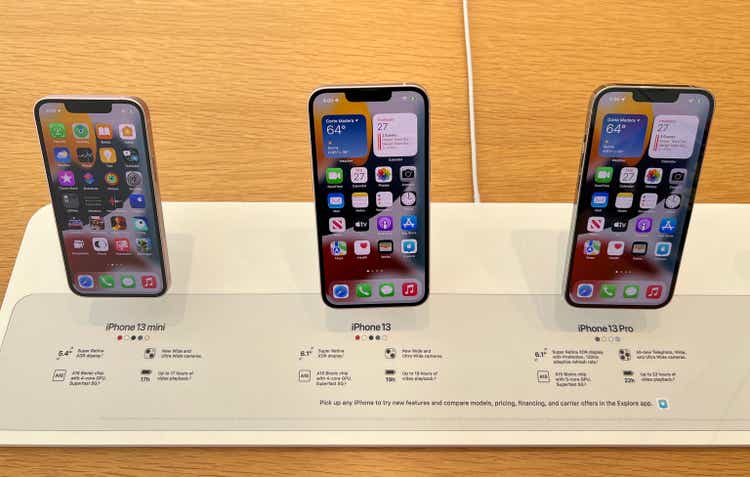
As you know, the Technology Sector has significantly under-performed during the 2022 bear market. The relatively high-valuation of the sector combined with a rising interest rate environment and the potential of a recession has caused multiple compression throughout the market but has been particularly rough on Tech stocks. However, Technology’s long-term track record of outperforming the market should not be ignored. Indeed, despite the bear-market retreat, the Tech Sector’s 3-year returns are still significantly greater than that of any other sector of the market (see graphic below). That being the case, investors under-weight Tech stocks and wanting to take advantage of the recent market pull-back should consider allocating some capital to the Fidelity MSCI Information Technology ETF (NYSEARCA:FTEC). The fund has a 5-star Morningstar rating, has a relatively cost-efficient 0.08% expense fee, and has delivered an average annual return of 18.1% since the fund’s inception in October 2013.
Seeking Alpha Homepage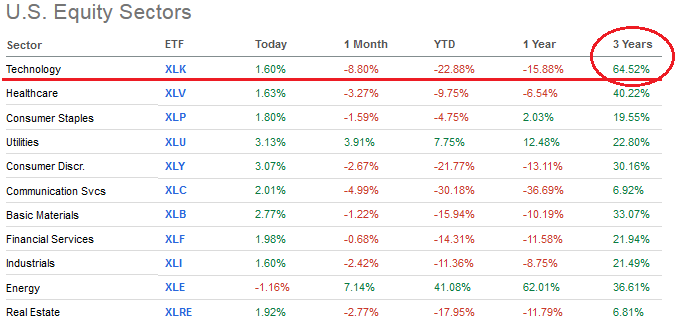
So let’s take a closer look to see how the FTEC ETF has positioned investors for success going forward.
Top-10 Holdings
The top-10 holdings in FTEC are shown below and equate to what I consider to be a very concentrated 61% of the entire 387 stock portfolio:
Fidelity (Fidelity FTEC ETF Webpage)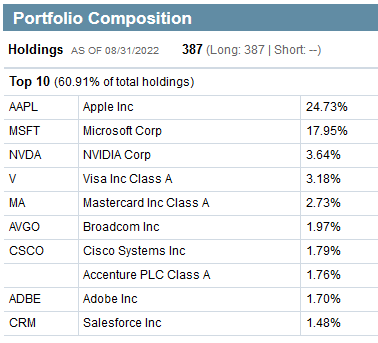
The #1 holding, with a 24.7% weight, is – of course – Apple (AAPL). Apple is relatively flat over the past year and has outperformed the S&P500 by ~12% over that time frame. Yesterday (Wednesday, Sept. 7th), Apple held its long-awaited event to debut its updated iPhone 14. The company also updated its Watch and iPod lineups. The event largely met expectations with the only major surprise being that Apple kept “like-for-like” iPhone pricing unchanged: the iPhone 14 and iPhone 14 Plus will start at $799 and $899 while new iPhone 14 Pro and iPhone 14 Pro Max start at $999 and $1,099, respectively. Delivering more value to customers at similar pricing is a win-win in a highly inflationary environment and, in my opinion, display the advantage of Apple’s in-house chip design: the A16 Bionic, the fastest chip ever in a smartphone.
Apple’s gross margin in Q3 was 43.3%, down only 40 basis points from Q2. That was very impressive considering the unfavorable foreign exchange and supply-chain challenges the company faced. Again, it displays Apple’s excellent and critical global supply chain management.
During Q3, Apple generated nearly $23 billion in operating cash flow and returned over $28 billion to shareholders, including $3.8 billion in dividends and $21.7 billion through open market repurchases of 143 million Apple shares. That equates to an average of $151.75/share. The stock closed yesterday at $155.96.
Apple ended Q3 with $48.2 billion in cash & cash equivalents. Apple is exactly the kind of high-margin cash-rich company investors should want to own during the current challenging market and – in my opinion – having nearly 25% of the FTEC ETF allocated to Apple is a very attractive attribute of the fund.
Microsoft (MSFT) is the #2 holding in FTEC with an 18% weight. As I reported in my recent Seeking Alpha article on the Schwab U.S. Large-Cap ETF (SCHG), which has a 12.3% weighting in MSFT, the company’s recent Q4 FY22 EPS report was strong:
- Revenue of $51.9 billion was +12% yoy (+16% in constant currency)
- Operating income of $20.5 billion was +8% yoy (+14% in constant currency)
- EPS of $2.23 was +3% yoy (+8% in constant currency)
- Revenue from Azure and other cloud services revenue was +40% yoy
Microsoft returned $12.4 billion to shareholders in Q4 – an increase of 19% compared to Q4 of 2021. That included $8.76 billion in share repurchases. Microsoft ended Q4 with cash, cash equivalents, and short-term investments of a whopping $104.7 billion – or an estimated $13.96/share.
Despite this excellent performance, MSFT stock is down 14.7% over the past year. The company pays a $2.48/share annual dividend and like Apple, this is exactly the kind of cash-rich company investors should want to own during a turbulent market.
Chip designer and AI specialist Nvidia (NVDA) is the #3 holding with a 3.6% weight. Nvidia has been hard-hit by lower demand in some of its key markets (gaming, crypto) and has lowered guidance for two straight quarters. Last week, Nvidia filed an 8-K that reported the U.S. government “indicated that the new license requirement will address the risk that the covered products may be used in, or diverted to, a ‘military end use’ or ‘military end user’ in China and Russia.” As a result of all these headwinds, NVDA stock is down 40% over the past year. Still, the company trades with a rather lofty forward P/E of 40x.
In aggregate, transaction & payment processors Visa (V) and Mastercard (MA) equate to a 5.9% weight within the portfolio.
Broadcom (AVGO), which my followers know is the best dividend growth stock in the entire S&P500 in my opinion, is the #6 holding with a 2% allocation. Broadcom pays a $16.40 annual dividend, yields 3.25%, and currently trades with a forward P/E of only 13.5x.
Broadcom recently announced an outstanding Q3 report:
- Revenue of $8.5 billion was +25% yoy.
- Non-GAAP EPS was $9.73, an $0.18 beat.
- The company repurchased and eliminated 3.2 million shares for $1.8 billion.
- Generated $4.308 billion of free cash flow (51% of revenue).
Broadcom operates what is arguably the best high-speed networking development platform (both hardware & software) on the planet that always seems to keep the company one-step ahead of competitors. Also, over the past few years, Broadcom has expanded its high-margin enterprise software business through M&A. It continues to do so with its planned acquisition of VMware (VMW), which is still undergoing regulatory review. Like Apple and Microsoft, Broadcom is another free cash flow generating monster with very strong margins.
The top-10 holdings in FTEC are rounded out by Salesforce (CRM), the latest addition to the DJIA average. CRM was one of the high-flying tech stocks that has gotten crushed by the 2022 bear market – the stock is down 41% over the past year. Still, Salesforce continued to grow at an impressive clip during its latest Q2:
Seeking Alpha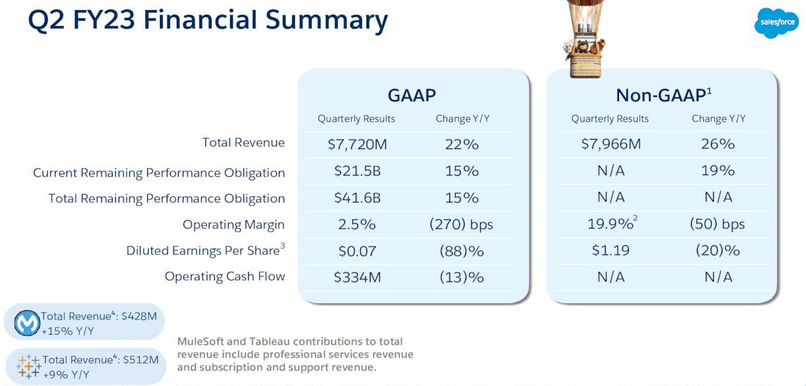
However, investors may have expected better operating margin performance as the company continues to scale-up its SaaS-based platform.
Performance
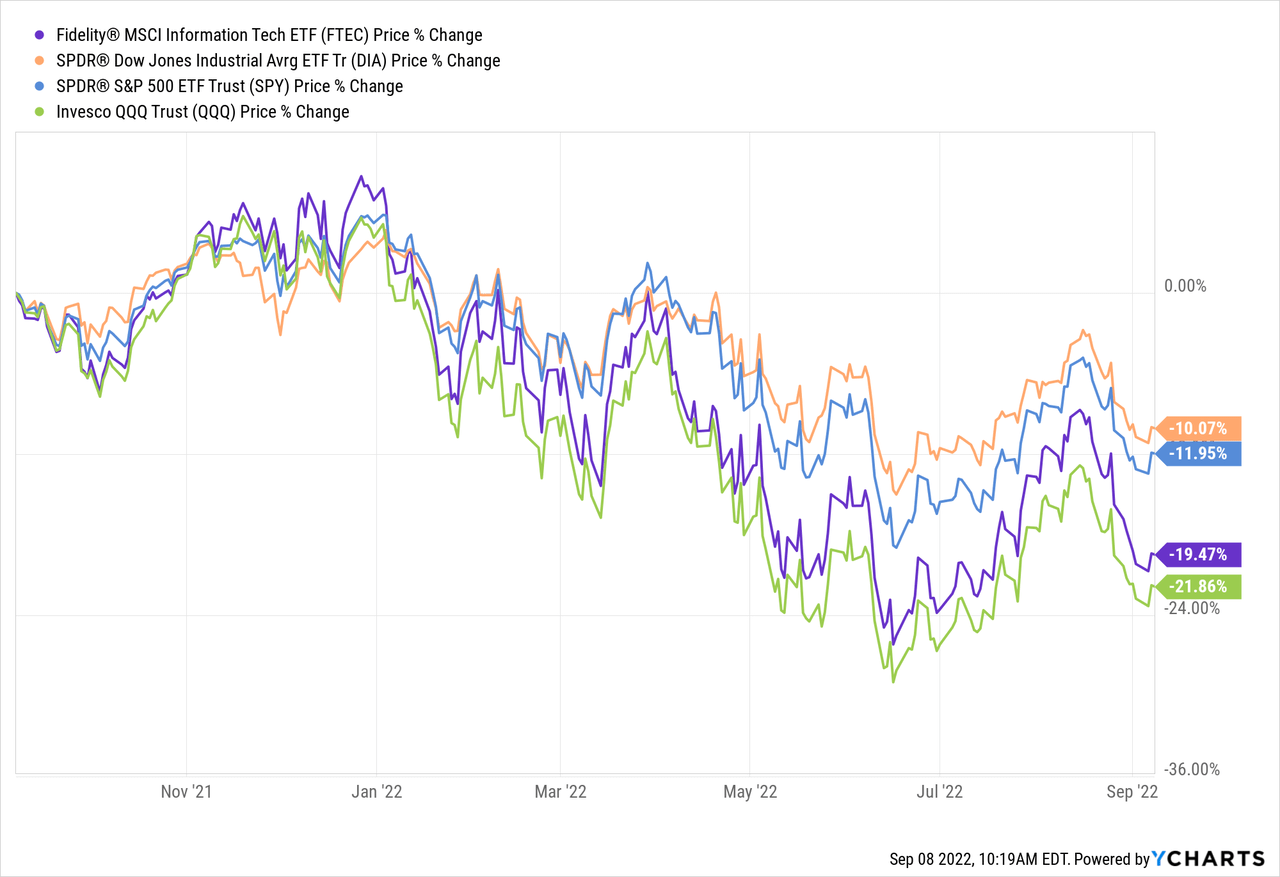
As mentioned earlier, the FTEC ETF has significantly under-performed the broad market averages as represented by the (DIA) and (SPY) indexes over the past year. However, note FTEC has out-performed the tech sector as represented by the Nasdaq-100 Trust (QQQ):
The following graphic compares the five-year charts of FTEC against the broad market indexes and the SCHG ETF:
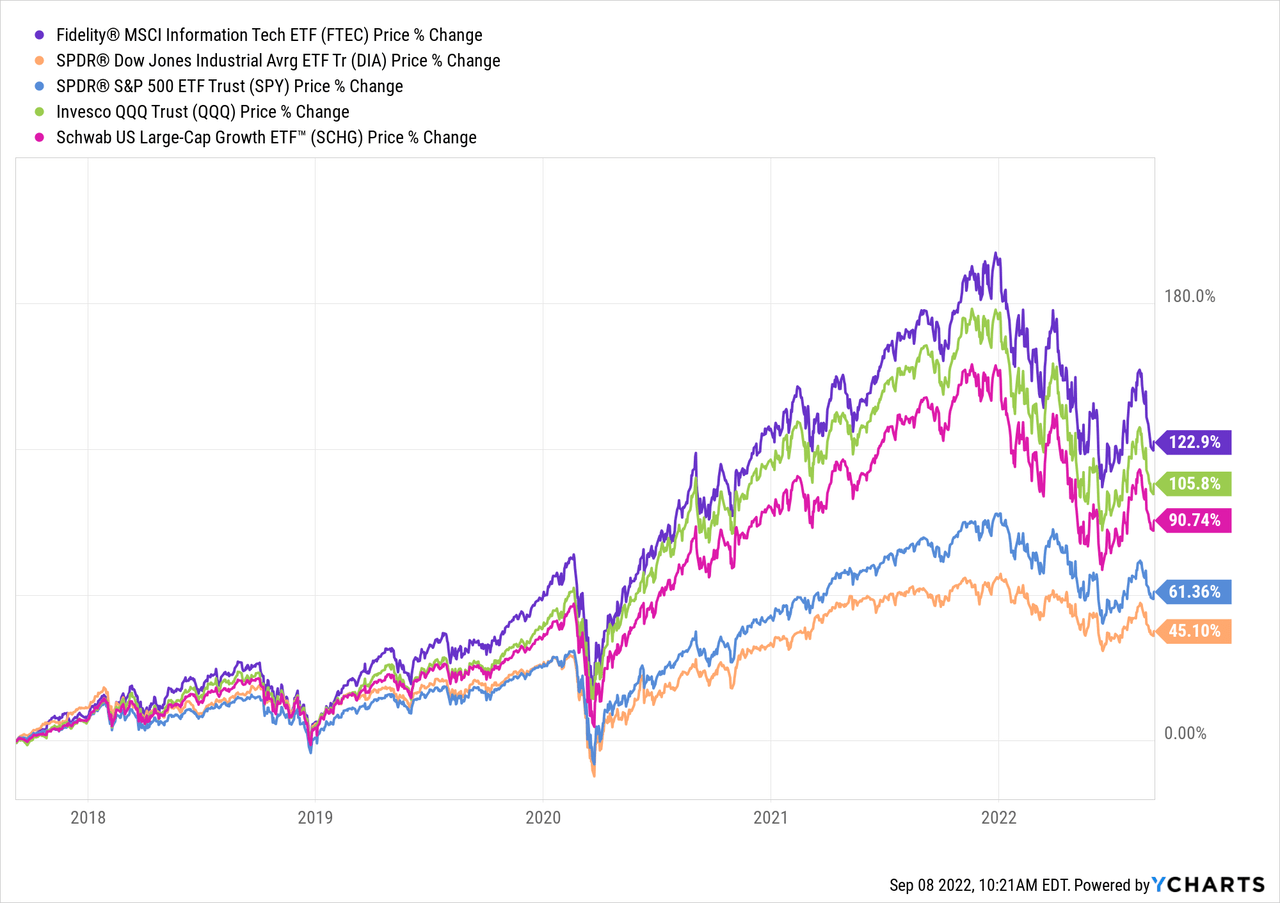
As can be seen, FTEC is the clear leader.
Risks
The FTEC ETF is certainly not immune to the investment risks of the current macro-environment: continuing Covid-19 shut-downs in China, high inflation, higher interest rates, and the impact of Putin’s horrific war-of-choice on Ukraine that has effectively broken the global energy & food supply chains.
The following graphic shows some valuation metrics of the overall FTEC portfolio:
Fidelity (Fidelity FTEC ETF Webpage)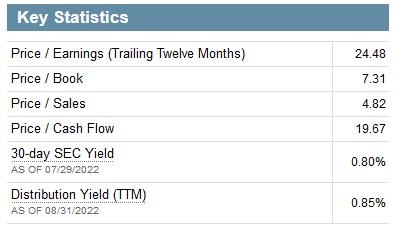
Note FTEC’s P/E ratio trades at a premium as compared to the S&P500 (20.09x) as does the price-to-book ratio (3.95x), while the fund’s yield of 0.85% is half that of the S&P500 (1.61%). This is the main trade-off of investing in Tech: investors pay a higher valuation as compared to the broad market in order to get exposure to higher growth rates (i.e., capital appreciation).
Another risk is the strong US dollar, which creates foreign exchange headwinds for companies with large international sales (i.e., Apple and Microsoft – the top-two holdings). For instance, note the constant currency numbers reported earlier for Microsoft. This headwind will likely continue until the U.S. Federal Reserve reaches the “neutral” rate (i.e., the risk of higher interest rates subsides).
Summary & Conclusion
The FTEC ETF has a solid long-term track record of outperforming the broad market and its peers. The fund has a relatively cost-efficient expense fee (0.08%) and a 5-star Morningstar rating. FTEC has 43% of assets allocated to two cash-rich companies – Apple & Microsoft – that have strong margins and generate strong free cash flow, exactly what investors should be looking for in the current market. That said, I am surprised FTEC doesn’t have a relatively large position in my favorite large-cap tech stock: Google (GOOG) (GOOGL). Google didn’t even make the top-10 list of holdings yet is another free-cash-flow generating monster. That said, I can’t argue with the long-term success of FTEC, which I find to be very attractive here. Investors that are under-weight the Tech Sector should take advantage of current market volatility to scale into FTEC over time on weakness. FTEC is a BUY.
Be the first to comment