

Vitezslav Vylicil/iStock via Getty Images
Introduction
The Phoenix-based Freeport-McMoRan (NYSE: FCX), the world’s largest publicly traded copper company, released its fourth-quarter and full-year 2021 results on January 26, 2022.
1 – Fourth quarter and full-year 2021 results snapshot
Freeport-McMoRan posted a quarterly profit of $1,106 million or $0.74 per share, missing analysts’ expectations. The adjusted earnings per share came in at $0.96 per share.
The Revenues increased 37.1% year over year to $6,164 million, which were shy of expectations as well. However, Freeport-McMoRan enjoyed higher realized prices and lower costs in the quarter.
Consolidated sales totaled 1.020 billion pounds of copper, 395 thousand ounces of gold, and 19 million pounds of molybdenum in the Fourth quarter of 2021.
Unit cash cost per CU Lbs was $1.29 in 4Q21.
CEO since 2003, Richard Adkerson, said in the conference call:
The end of 2021 is a special time for our Freeport team. We’ve met a series of multi-year complex challenges with great success. You start by looking at the debt picture, which Kathleen mentioned, just six years ago, our debt was a $20 billion, and the way to manage it was really unclear. We have now reached the point where our debt is de minimis. We have started a program of shareholder returns with higher dividends and share buybacks. We have assets in our outlook that will allow us to increase those over time.
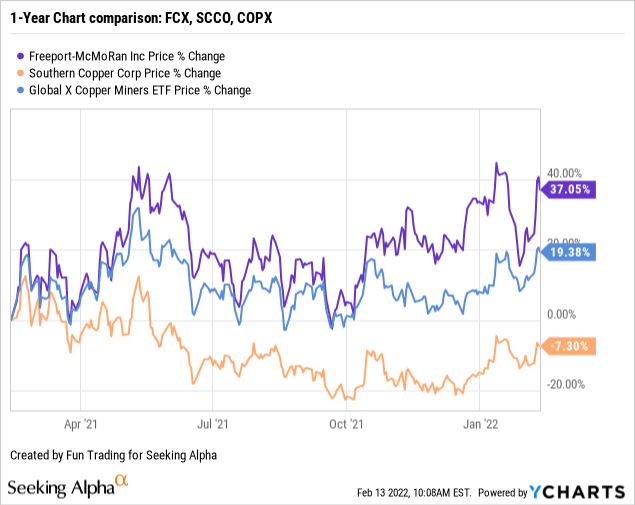
2 – Stock performance
Freeport-McMoRan has significantly outperformed most of its peers and is now up 37% on a one-year basis.
3 – Investment Thesis
The investment thesis for this predominant copper/gold miner is appealing. Freeport-McMoRan is one of the best copper producers and is an excellent long-term investment, but the valuation is now a debatable issue with a possible strong resistance forming.
The stock has been an excellent proxy for copper. Despite some understandable stabilization, the near future is still encouraging, whereas 2022 could be a volatile year with a copper price averaging about $4.30 per pound. Kristie Batten explains it well in her article on Mining Journal.
The degree of subsequent recovery depends in large part on Chinese growth and the degree of 1Q22 policy easing, but even without a major Chinese stimulus we do see prices recovering to average $9500/t during 2H22.
Hence the best strategy that copper investors should adopt in 2020 is to trade short-term LIFO, about 50% of your long-term position, and take advantage of the increasing volatility.
Trading LIFO allows you to trade the volatility while keeping a core long-term position for a higher target and still be able to pocket the dividend.
Freeport-McMoRan – 4Q21 – Balance Sheet and Trend – The Raw Numbers
| Freeport-McMoRan | 4Q20 | 1Q21 | 2Q21 | 3Q21 | 4Q21 |
| Total Revenues in $ Million | 4,495 | 4,850 | 5,748 | 6,083 | 6,164 |
| Net income in $ Million | 708 | 718 | 1,083 | 1,399 | 1,106 |
| EBITDA $ Million | 2,140 | 1,962 | 2,559 | 3,026 | 2,712 |
| EPS diluted in $/share | 0.48 | 0.48 | 0.73 | 0.94 | 0.74 |
| Cash from Operations | 1,327 | 1,075 | 2,395 | 1,965 | 2,280 |
| Capital Expenditure In $ Million | 388 | 370 | 433 | 541 | 771 |
| Free Cash Flow in $ Million | 939 | 705 | 1,962 | 1,424 | 1,509 |
| Total Cash $ Million | 3,657 | 4,580 | 6,313 | 7,672 | 8,068 |
| Total Long-term Debt in $ Million | 9,711 | 9,809 | 9,695 | 9,665 | 9,450 |
| Quarterly Dividend $/share | 0.05 |
0.075 |
0.075 |
0.075 |
0.15 |
| Shares outstanding (diluted) in Billion | 1,485 | 1,477 | 1,483 | 1,484 | 1,482 |
Source: Company news
Analysis: Revenues, Free Cash Flow, Mineral Reserves, and Copper/Gold/Molybdenum Production
1 – Revenues were $6.16 billion for the fourth quarter of 2021
FCX: Chart Quarterly Revenue history (Fun Trading)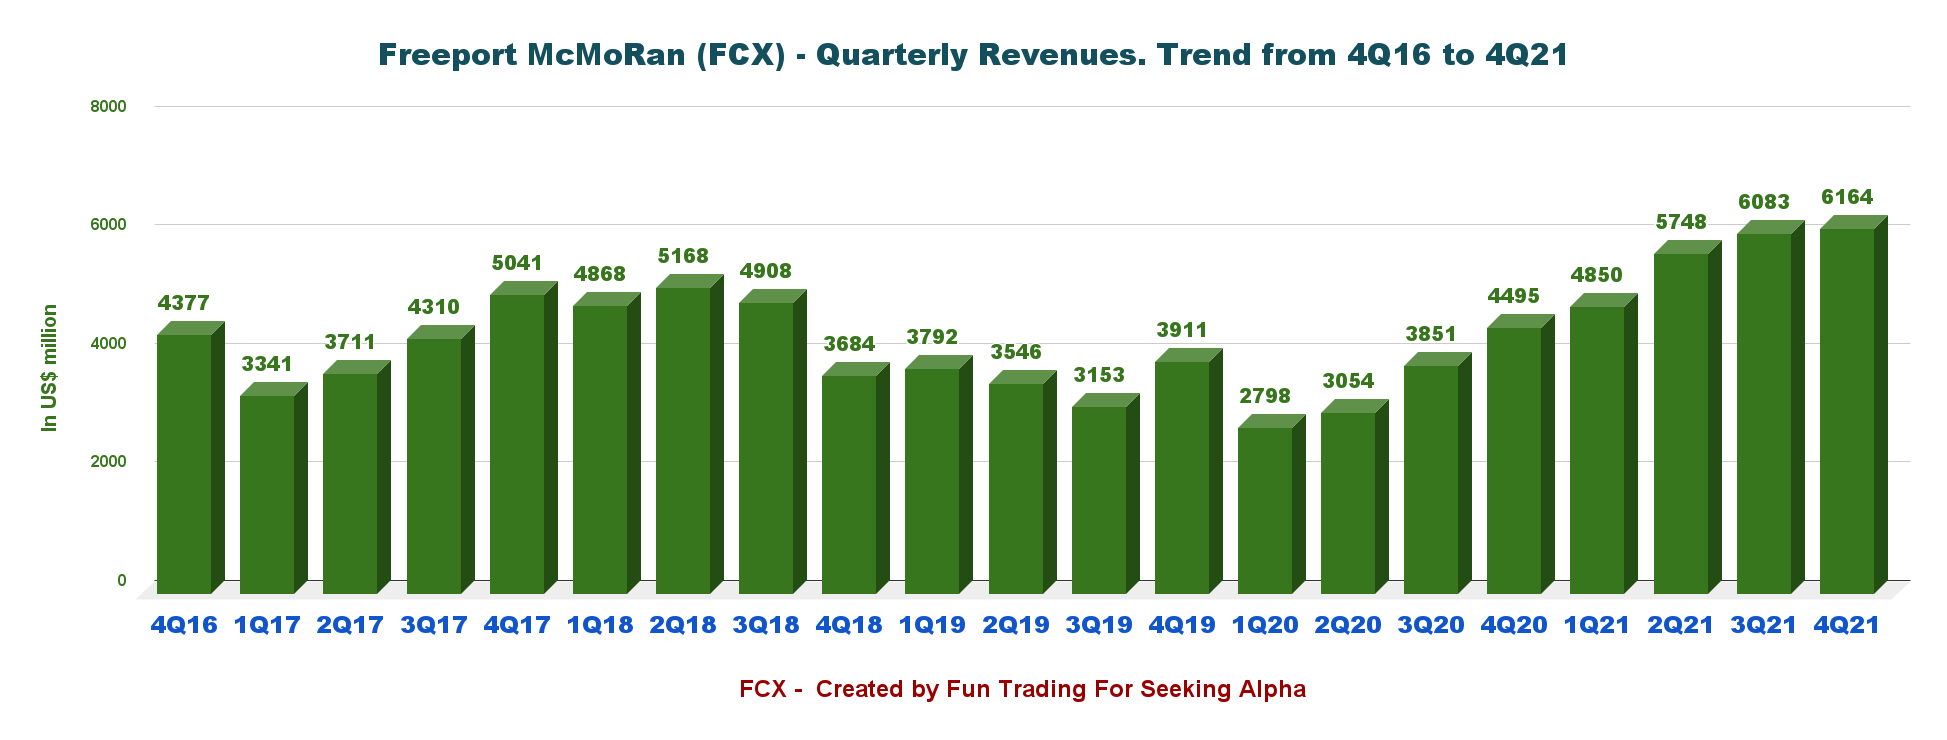
The fourth quarter of 2021 revenue was $6.164 billion, up 37.1% from the same quarter a year ago and up 1.3% sequentially.
The net income was $1,106 million, or $0.74 per diluted share, compared to $708 million, or $0.48 per diluted share the same quarter a year ago. It was another solid quarter. The adjusted earnings per share were $0.96 per share.
One crucial element is that the copper price has climbed significantly to a new multi-year record in Q4 with an average of 4.42 per pound.
FCX: Chart Copper Price history (Fun Trading)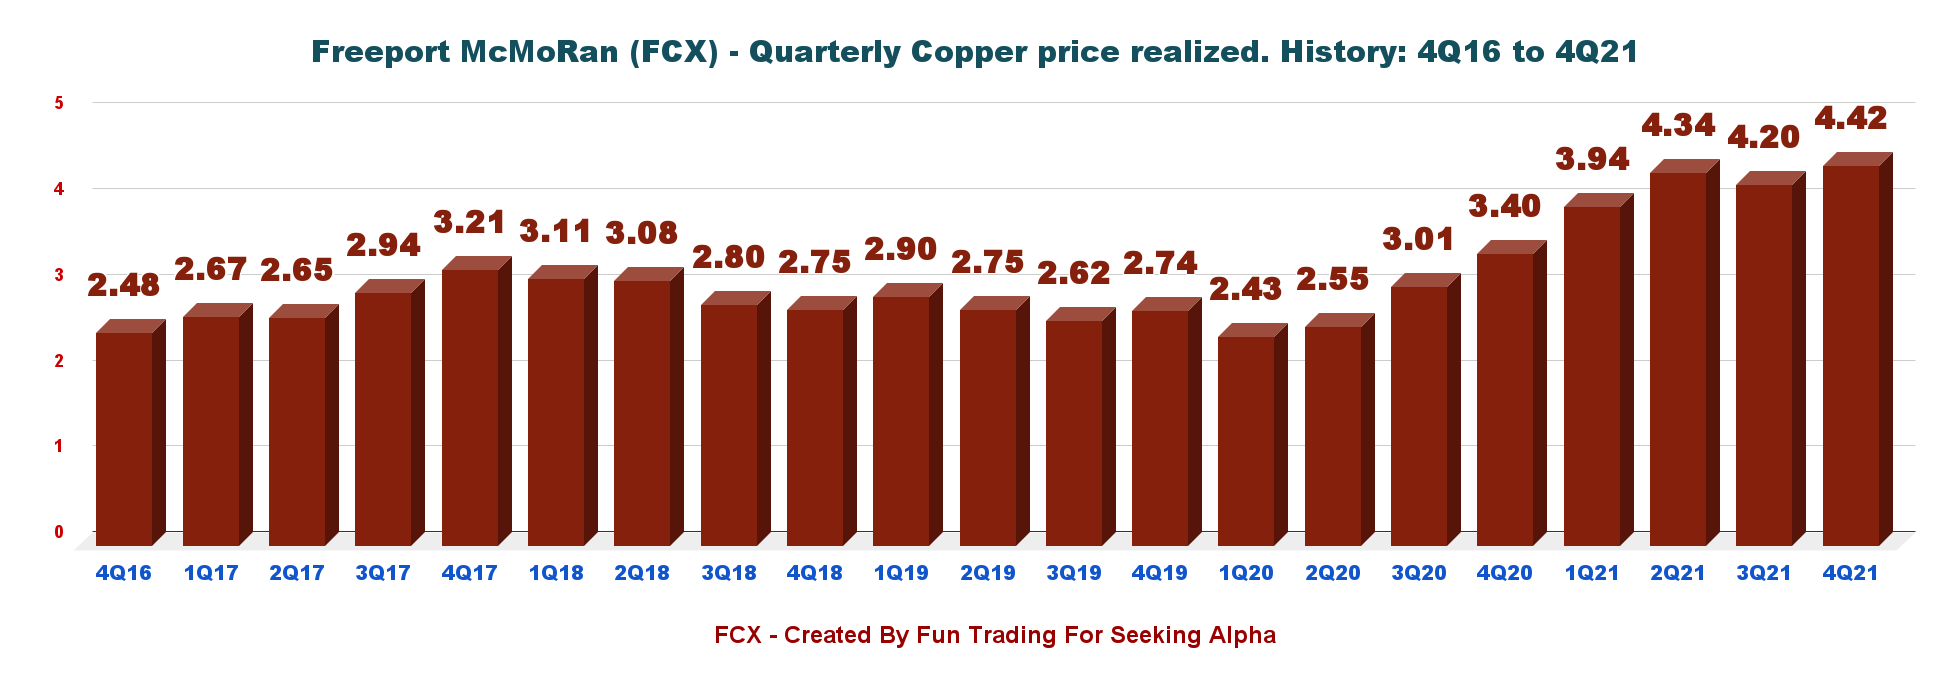
Since late October, the copper price has stabilized between $4.20 and $4.60 per pound.
KITCO Copper chart 6-month (Kitco)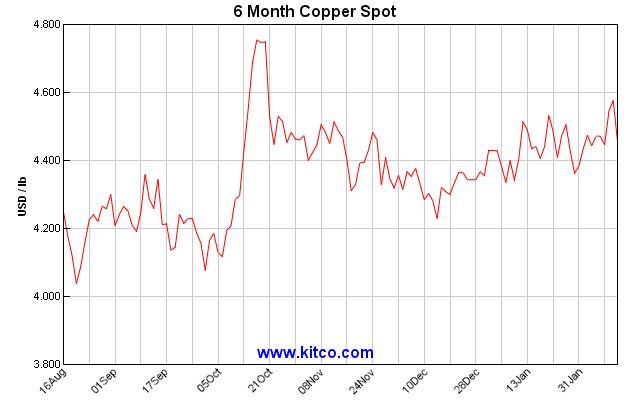
2 – Free cash flow was $1,509 million in the fourth quarter of 2021
FCX: Chart Free Cash Flow history (Fun Trading)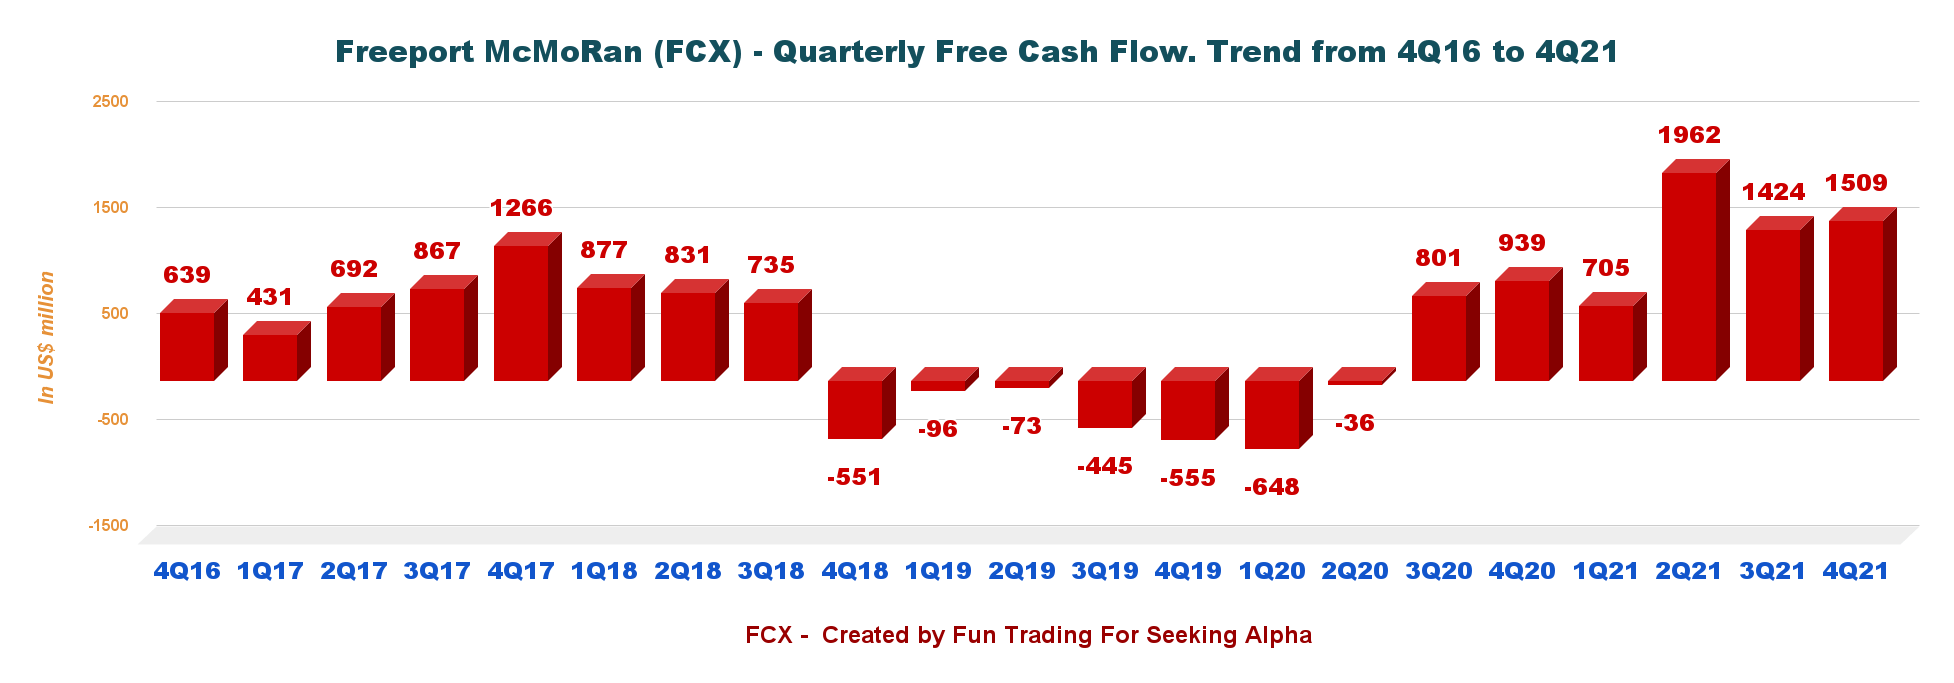
Note: I calculate the generic free cash flow using the cash from operating activities minus CapEx.
Trailing Twelve-month free cash flow was $5,600 million, with $1,509 million in 4Q21.
The total cash cost of the dividend is now $889 million a year based on a quarterly dividend of $0.15 per share (including variable dividend)— representing a dividend yield of 1.4%.
In the press release, the company said:
approved an increase in common stock dividends. The combined annual rate of the base dividend and the variable dividend approved by the Board is expected to total $0.60 per share in 2022.
The company could easily double the dividend and still keep a buyback program. The company said in the press release:
In November 2021, FCX’s Board of Directors (Board) approved a new share repurchase program authorizing repurchases of up to $3.0 billion of FCX’s common stock (through January 25, 2022, FCX has acquired 15.4 million shares for a total cost of $599.9 million, $39.03 per share).
3 – Net debt is down to $1.382 billion in 4Q21
FCX: Cash versus Debt history (Fun Trading)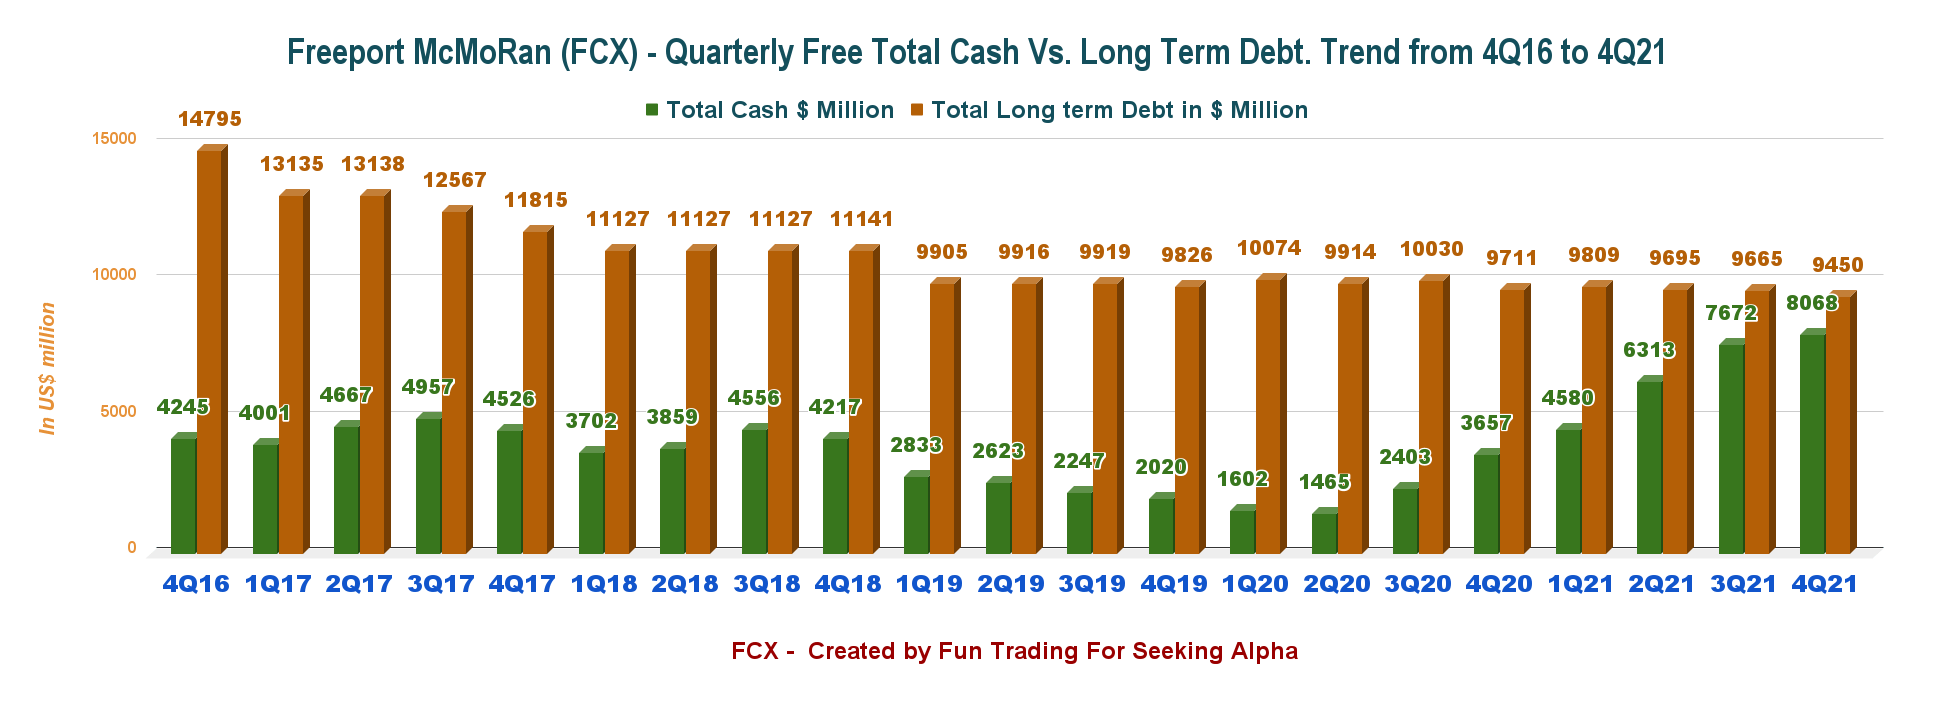
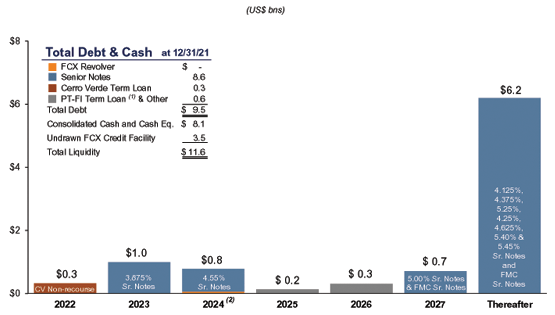
On December 31, 2021, consolidated debt totaled $9.450 billion, and consolidated cash and cash equivalents totaled $8.068 billion, resulting in net debt of $1.382 billion. FCX had no borrowings and $3.5 billion available under its revolving credit facility on December 31, 2021.
FCX: Debt situation End of December (Freeport-McMoRan Presentation) FCX: Debt maturities (Freeport-McMoRan Presentation)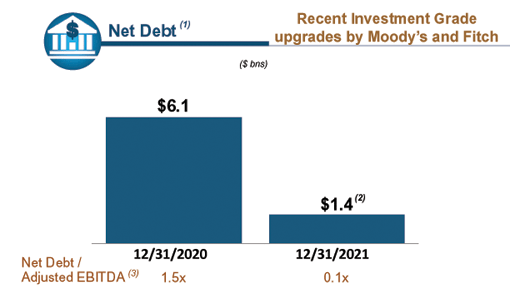
The company’s cash position is increasing significantly, and I would love to see the company start repaying the debt. I consider it a priority for FCX even before any buyback that I believe is a pure waste of precious cash.
4 – Production analysis – Copper Cu, Gold Au, and Molybdenum Mo
4.1 Gold and Copper production
FCX: Production per metal history (Fun Trading)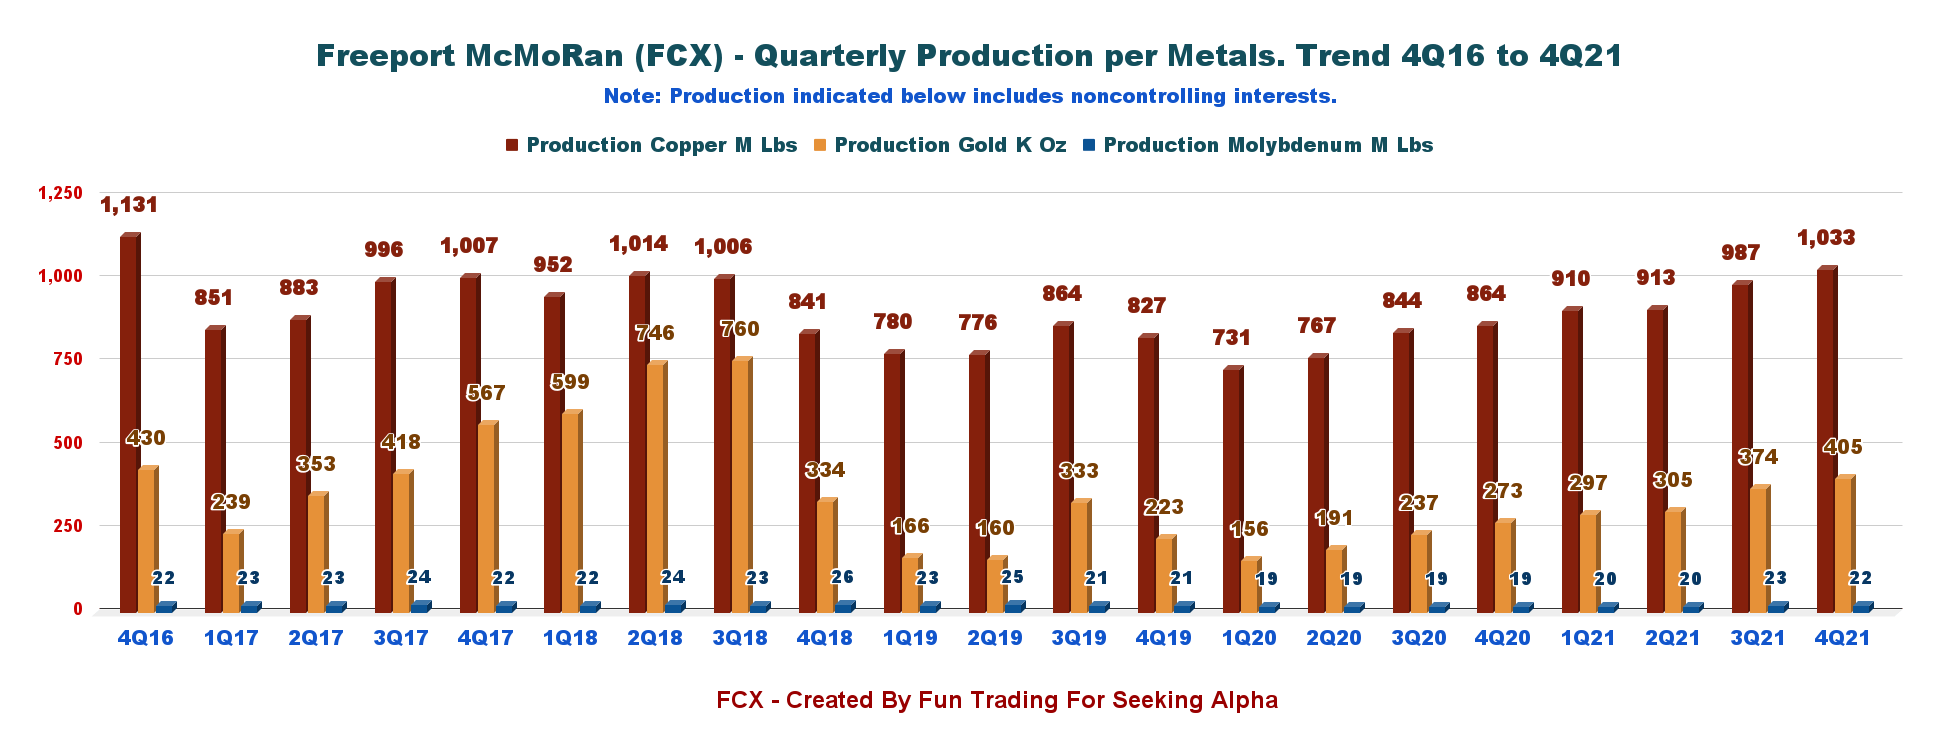
Production increased 19.6% to 1,033 million pounds (net 829 million pounds) from 864 million pounds in the same quarter a year ago (please see chart above).
The gold production increased to 405K oz (net 329K ounces), and 22 M lbs of Molybdenum were produced (net 19 M lbs). Gold and copper are increasing nicely with the successful ramp-up of the Grasberg underground mine.
FCX: Grasberg Ramp-up (Freeport-McMoRan Presentation)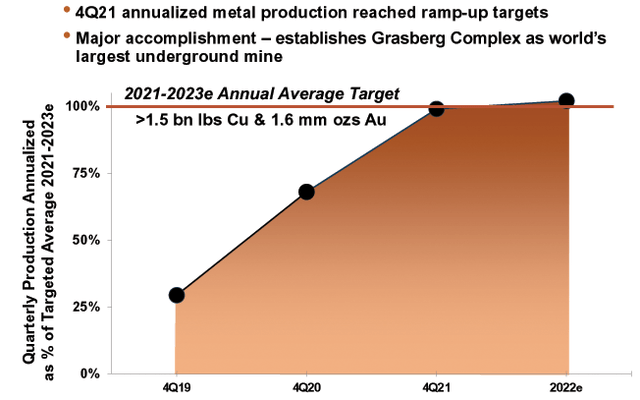
Sales were 1,020 M Cu lbs., 395K oz. of gold, and 19 M lbs. of Mo.
Below is the Copper, gold, and molybdenum prices received by Freeport-McMoRan over the past five quarters:
| Price | 4Q20 | 1Q21 | 2Q21 | 3Q21 | 4Q21 |
| Copper price realized – Cu | 3.40 | 3.94 | 4.34 | 4.20 | 4.42 |
| Gold price Realized – Au | 1,870 | 1,713 | 1,794 | 1,757 | 1,808 |
| Molybdenum price realized – Mo | 9.96 | 11.62 | 13.11 | 18.61 | 19.42 |
Source: Fun Trading
4.2 Production of Copper, Gold, and Molybdenum per mine in 4Q21
FCX: Production per metal and per Mine in 4Q21 (Fun Trading)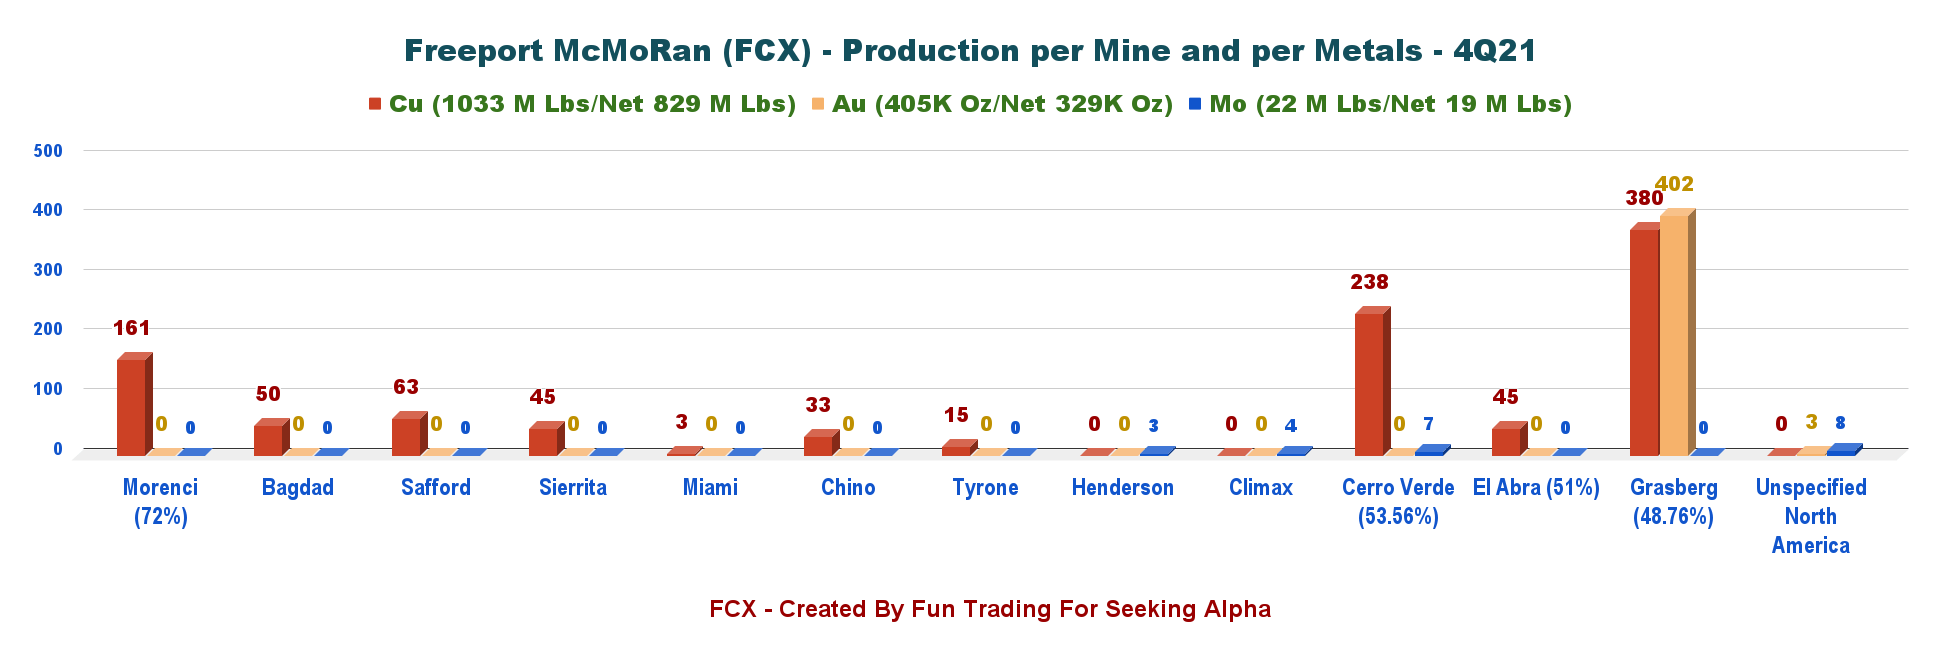
Note: The average unit net cash costs were $1.29 per pound of copper in the fourth quarter of 2021 and $1.34 per pound of copper for 2021. Unit net cash costs are expected to average $1.35 per pound of copper for 2022.
4.3 Reserves situation as of 12/31/2021.
FCX Presentation Reserve 2021 (Freeport-McMoRan)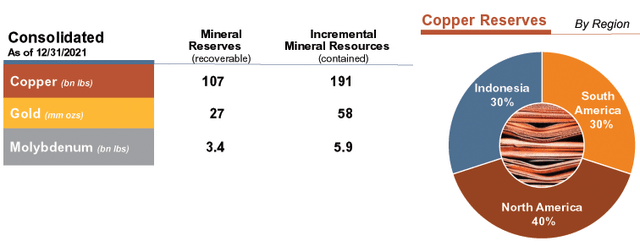
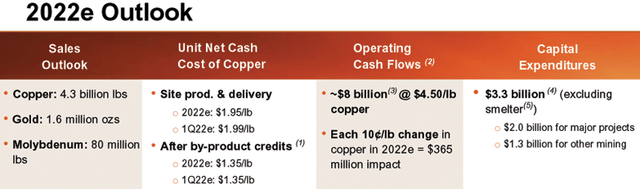
5 – Production outlook 2022 and other data
Production for 2022 is expected to be 4.3 billion pounds of copper, 1.6 Moz of Gold, and 80 Mlbs of Molybdenum at unit cash costs of $1.35 per pound.
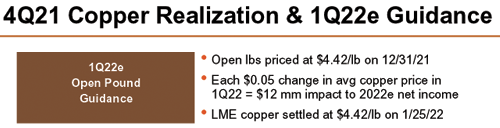
FCX: Net cash cost guidance 2022 (Freeport-McMoRan Presentation) FCX: 2022 Outlook (Freeport-McMoRan Presentation) FCX: Outlook 1Q22 (FCX Presentation)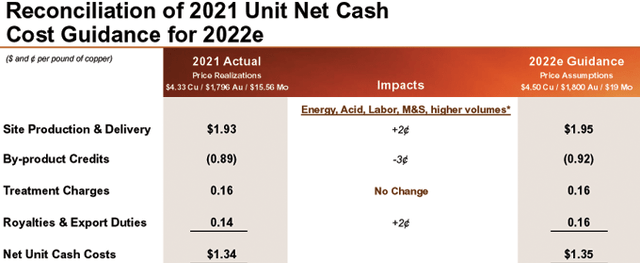
Technical Analysis (short-term) and commentary
TA Chart (Fun Trading)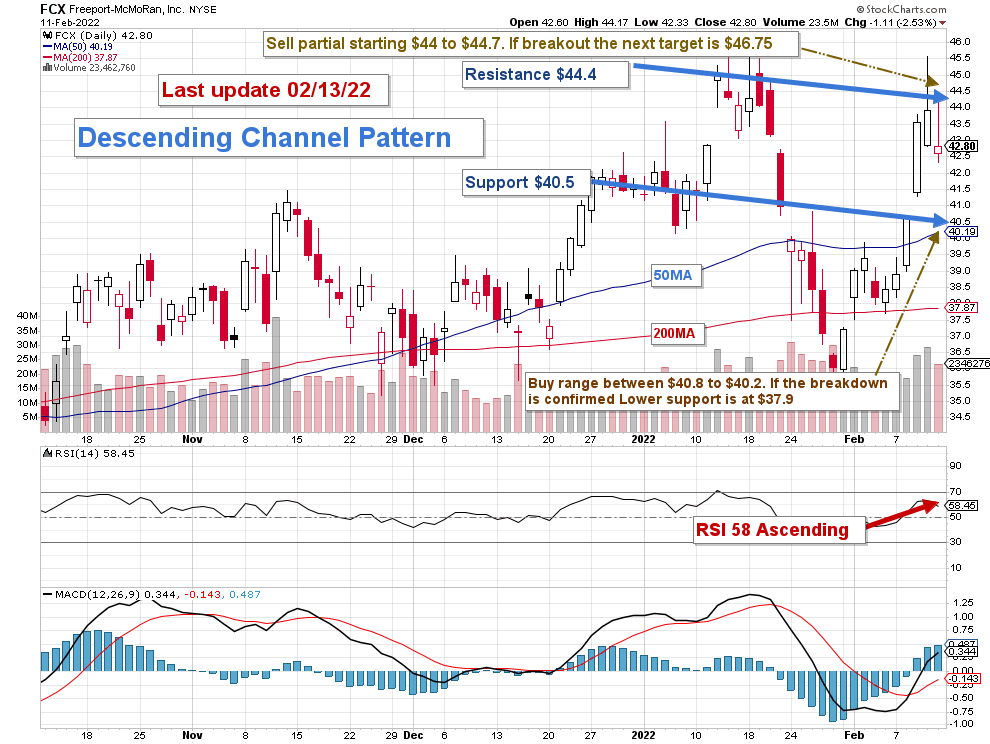
Note: The chart is adjusted for the dividend.
FCX forms a descending channel pattern with a resistance of $44.4 and support at $40.5.
The trading strategy that I recommend is to trade LIFO about 40% of your FCX position. I suggest selling partially in the range of $44 and $44.7 and waiting for a retracement below $40.8.
The copper price is stabilizing now above $4 per ounce, which could result in a drop below $40 for FCX, where I would be more comfortable adding a little.
Thus, I recommend being patient and accumulating below $40 using the cash received from your FCX sale at above $44.
However, The copper price, a crucial component for FCX, may turn bearish if the world economy starts to falter due to geopolitical troubles (Russia’s invasion of Ukraine). In this case, FCX could quickly drop below $37. Conversely, the same reasoning could boost the copper price above $6 per pound, pushing FCX above $46.75.
Warning: The TA chart must be updated frequently to be relevant. It is what I am doing in my stock tracker. The chart above has a possible validity of about a week. Remember, the TA chart is a tool only to help you adopt the right strategy. It is not a way to foresee the future. No one and nothing can.
Watch the price of gold and copper like a hawk.
Author’s note: If you find value in this article and would like to encourage such continued efforts, please click the “Like” button below as a vote of support. Thanks!
Be the first to comment