

DNY59
Introduction
After Freeport-McMoRan (NYSE:FCX) enjoyed a strong recovery during 2021, it seemed their shareholders would be saying goodbye to debt and hello to higher shareholder returns in the year ahead, as my previous article discussed early in 2022. Whilst the year was not as strong as originally hoped due to deteriorating operating conditions, at least it was not terrible and when looking ahead, the mixed economic outlook means that investors are effectively left to flip a coin in 2023, metaphorically speaking.
Coverage Summary & Ratings
Since many readers are likely short on time, the table below provides a brief summary and ratings for the primary criteria assessed. If interested, this Google Document provides information regarding my rating system and importantly, links to my library of equivalent analyses that share a comparable approach to enhance cross-investment comparability.
Author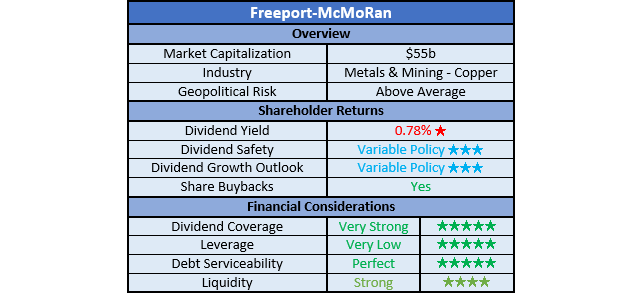
Detailed Analysis
Author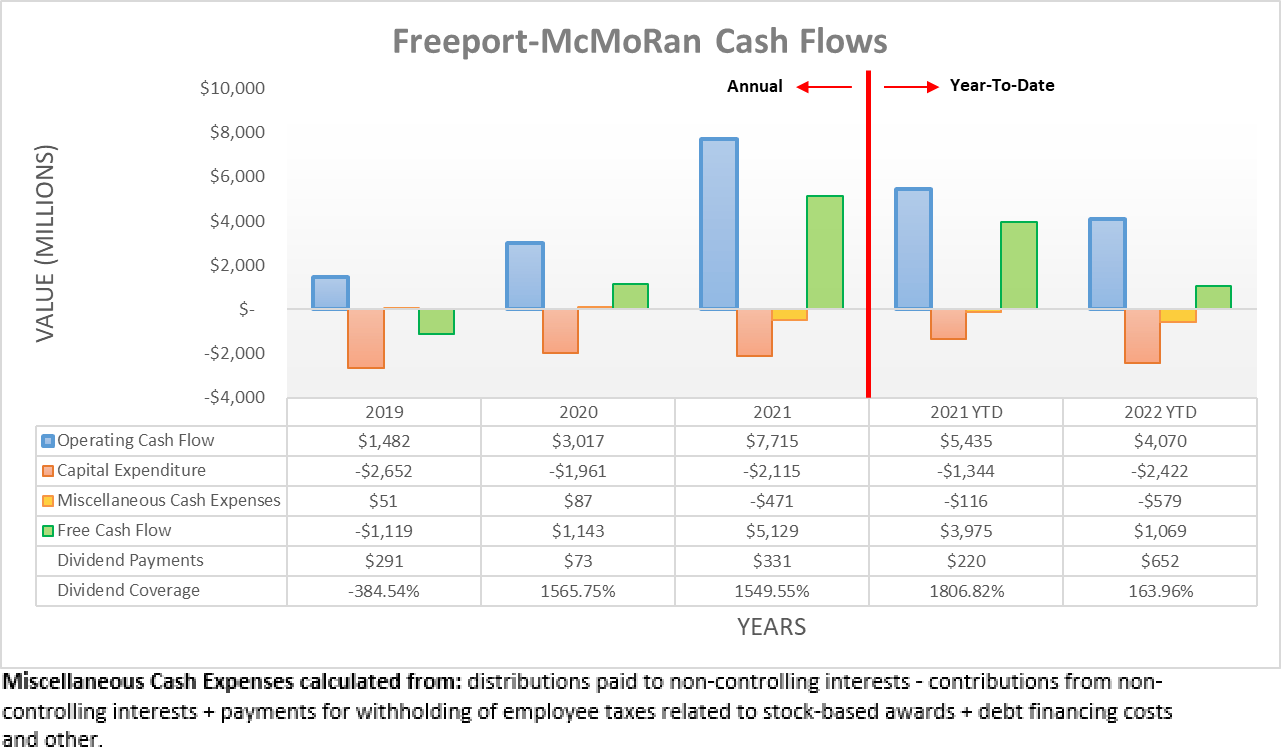
Following a strong set of results during 2021, there were high hopes for their cash flow performance during 2022 but alas, the year was effectively almost the reverse of 2021. Whilst the latter started off soft before a strong end, disappointingly, 2022 started off strong before deteriorating on the back of tighter monetary policy, economic concerns and heavy-handed Covid-19 lockdowns in China. As a result, their operating cash flow across the first nine months only landed at $4.07b and whilst still a solid result historically speaking, it nevertheless was down year-on-year versus their previous result of $5.435b during the first nine months of 2021.
Author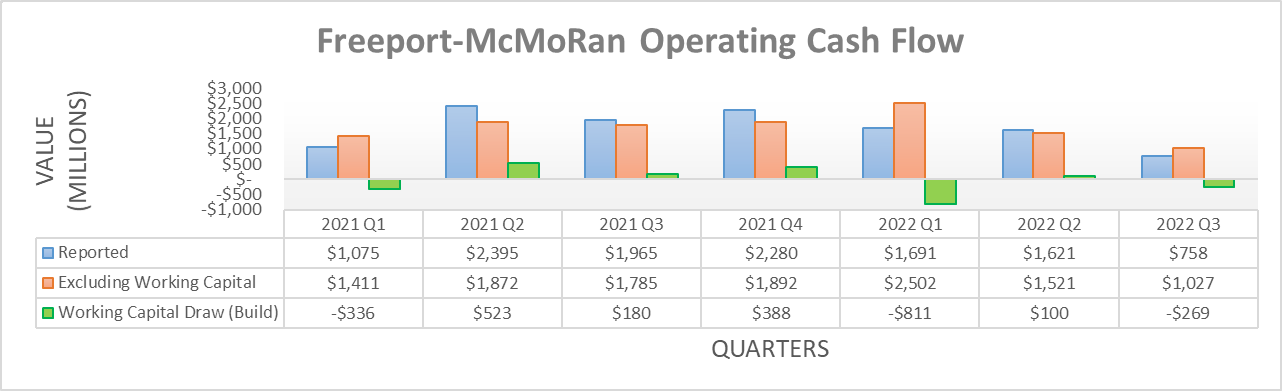
Upon looking into their operating cash flow on a quarterly basis, their deteriorating results that mirror copper prices are easily visible with their reported results declining sequentially every quarter to $758m during the third quarter of 2022, after having peaked far higher at $2.28b during the fourth quarter of 2021. If removing their working capital movements, this same broad trend is continued within their underlying results with the third quarter of 2022 seeing $1.027b and thus far below its equivalent peak of $2.502b during the first quarter. If aggregating their underlying results across the first nine months, it equals $5.05b during 2022 and thus broadly flat year-on-year versus their previous equivalent result of $5.068b during the first nine months of 2021. As for the soon-to-end fourth quarter of 2022, the recent rally in copper prices on the back of China easing their zero Covid-19 policy should ensure an end to this downward trajectory, hopefully permanently but if not, at least temporarily.
When all is said and done, 2022 was not terrible but at the same time, it was not necessarily as strong as originally hoped earlier in the year. If looking ahead into 2023, investors are effectively left to flip a coin with competing outlooks for copper prices that ultimately drive their financial performance. On one side of the proverbial coin, everyone knows about the risks of a recession as central banks continue tightening monetary policy to fight inflation and thus even if a recession is avoided in a technical sense, no one is expecting strong economic conditions, let alone a boom. As many experienced investors will already know, copper is sometimes referred to as “doctor copper” given its link to economic health, which stems from its wide range of uses across both the investment and consumption ends of the economy and as such, this is undoubtedly a headwind in the short-term.
Whilst the outlook for economic conditions in the United States, Europe and many other countries is looking gloomy for 2023, on the other side of the proverbial coin, the outlook for China is more debatable. Even though the latter provided a headwind during 2022, this was largely due to their zero Covid-19 policies that hindered economic activity, although following a rare outburst of protests a few weeks ago, it seems authorities are now easing these policies. Subsequently, this sees analysts at Goldman Sachs (GS) forecasting record-setting copper prices during 2023, which largely centers on the notion of China reopening its economy and stabilizing their troubled property sector, whilst simultaneously restocking depleted inventories.
Even if Goldman Sachs is wrong and 2023 proves disappointing, at least in the medium to long-term they still see a very strong outlook as the world undergoes the clean energy transition. As widely discussed during recent years, electric vehicles require far more copper than traditional internal combustion engine vehicles, not to mention what is required to revamp the power grid for their charging requirements. Even though this does not necessarily fix any potential volatility in the short-term, it nevertheless helps investors sleep easier knowing a recovery is almost certainly forthcoming as copper demand is underpinned by structural changes within the world.
Whilst only time will tell which side of the coin lands facing upwards, metaphorically speaking, at least other aspects of their outlook are quantifiable. When looking at their guidance, they are forecasting copper production will reach 4.3 billion pounds during 2023, thereby slightly above their already strong production forecast of 4.2 billion pounds for 2022. Meanwhile, their accompanying but still far less important gold and molybdenum production is forecast to increase and decrease slightly respectively, thereby effectively netting out between 2022 and 2023.
Freeport-McMoRan Third Quarter Of 2022 Results Presentation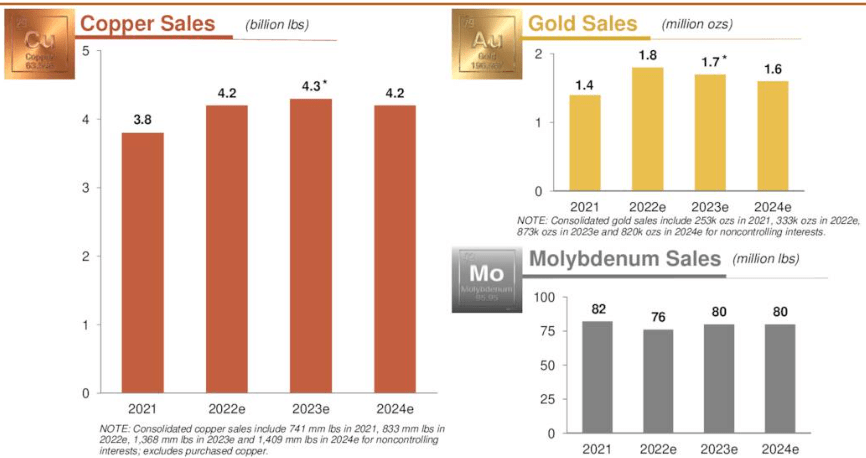
Whilst the amount of cash they can generate from this production is still obviously dependent upon how copper prices fair, at least they should have ample volumes for sale to capture the upside potential in the event that Goldman Sachs is correct. Elsewhere, their capital expenditure is also quantifiable with their guidance for 2023 seeing a forecast of $3.3b, thereby up from the $2.7b they forecast for 2022.
Freeport-McMoRan Third Quarter Of 2022 Results Presentation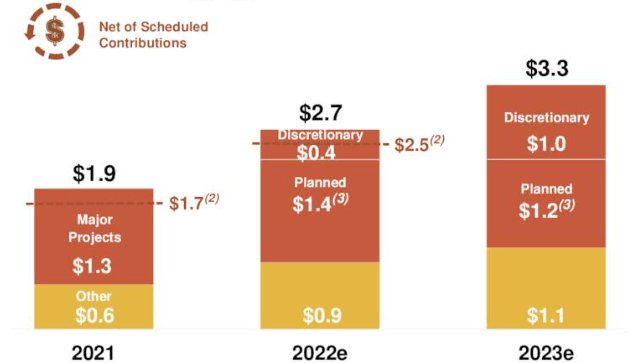
It can be easily seen that 2023 is forecast to see another $600m of capital expenditure above that of 2022. Whilst this weighs down their free cash flow, the relative impact still depends upon copper prices. To this point, when operating conditions are strong, they can generate operating cash flow of well above $2b per quarter, which means an additional $600m of capital expenditure spread across an entire year is easy to absorb. On the flip side, when they are only generating a mere $1b or less per quarter of operating cash flow, such a marginal increase to their capital expenditure drains their remaining free cash flow to a far greater extent, relatively speaking.
Author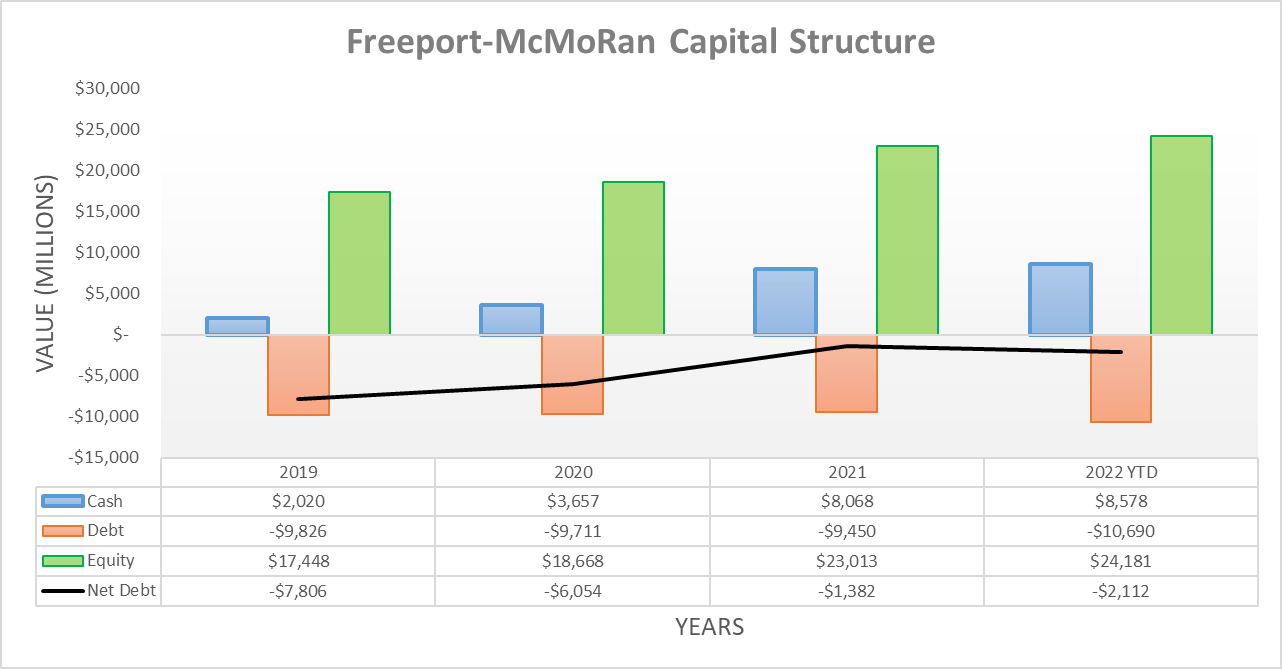
When conducting the previous analysis early in the year, it appeared their residual net debt would be completely eliminated during 2022 after shedding almost of its balance during 2021. Although this was not ultimately forthcoming as their operating conditions deteriorated more than envisioned and thus as a result, their net debt actually increased to $2.112b following the third quarter of 2022 from its previous level of $1.382b at the end of 2021.
Whilst this $730m increase is not ideal, to be fair it was also accompanied by $1.347b of share buybacks across the first nine months of 2022. More so, if not for their $980m working capital built across this same period of time, they would have still pushed their net debt lower, despite the headwinds faced and concurrent share buybacks. If their working capital build reverses during the fourth quarter, their net debt could still possibly end the year below where it started, especially since copper prices have increased recently, thereby further lifting these prospects. Going forwards into 2023, the direction their net debt takes will ultimately depend upon copper prices, although in light of their outlook for the fourth quarter of 2022 and current standing, there are not any significant risks on this front, unless they happen to pursue a presently unknown acquisition or merger.
Following this situation, it would be pointless to assess their leverage or debt serviceability in detail because even as it stands right now, their net debt of $2.112b is already well below their operating cash flow of $4.07b during the first nine months of 2022 and therefore, their leverage is obviously very low. Likewise, their debt serviceability is also perfect, as this operating cash flow was many magnitudes above its accompanying interest expense of $423m.
Author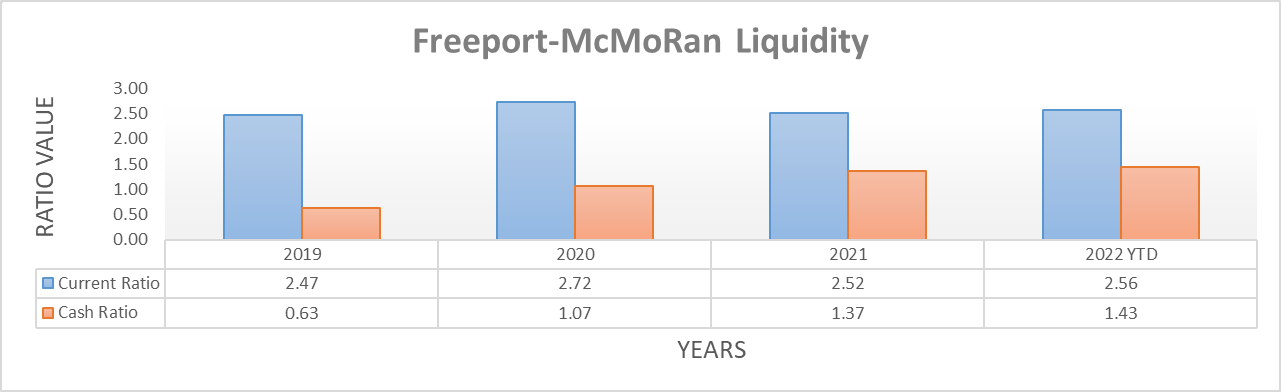
When it comes to solvency, their liquidity is more important than their leverage, and on this front, it remains strong. In fact, their respective current and cash ratios of 2.56 and 1.43 are slightly higher than their previous respective results of 2.52 and 1.37 at the end of 2021. Since they are sporting a cash balance of $8.578b and continuing to produce free cash flow, there are no reasons to be concerned about any upcoming debt maturities in the foreseeable future, nor their credit facility availability, regardless of where monetary policy heads.
Conclusion
In my eyes, the only guarantee for the year ahead is volatility itself and thus, investors are left to effectively flip a coin in 2023. On one side, the gloomy economic outlook for the United States, Europe and so forth will pose a headwind, although on the flip side, the prospects of China reopening its economy and easing its zero Covid-19 policies could see record-setting copper prices. Even though it remains too early to tell what side this proverbial copper coin will be facing upwards, I still believe that maintaining my buy rating is appropriate for medium to long-term investors given the favorable outlook for copper as the world undergoes the clean energy transition.
Notes: Unless specified otherwise, all figures in this article were taken from Freeport-McMoRan’s SEC filings, all calculated figures were performed by the author.
Be the first to comment