

It’s time for free money. Take advantage of investors who hate math. SIphotography/iStock via Getty Images
Get ready for charts, images, and tables because they are better than words. The ratings and outlooks we highlight here come after Scott Kennedy’s weekly updates in the REIT Forum. Your continued feedback is greatly appreciated, so please leave a comment with suggestions.
Today, I want to share a note we sent to subscribers of The REIT Forum yesterday. This was sent before the latest details came out on AGNC’s shocking new share: AGNCL (AGNCL). We posted a full article on AGNCL today.
Start of Subscriber Article
Investors who are in AGNCN (AGNCN) are getting a home run opportunity to swap their shares of AGNCN at $24.90 for any of the other 3 preferred shares from AGNC:
Any of those 3 would be a great choice.
These prices are listed specifically to help investors recognize if prices swing after publication.
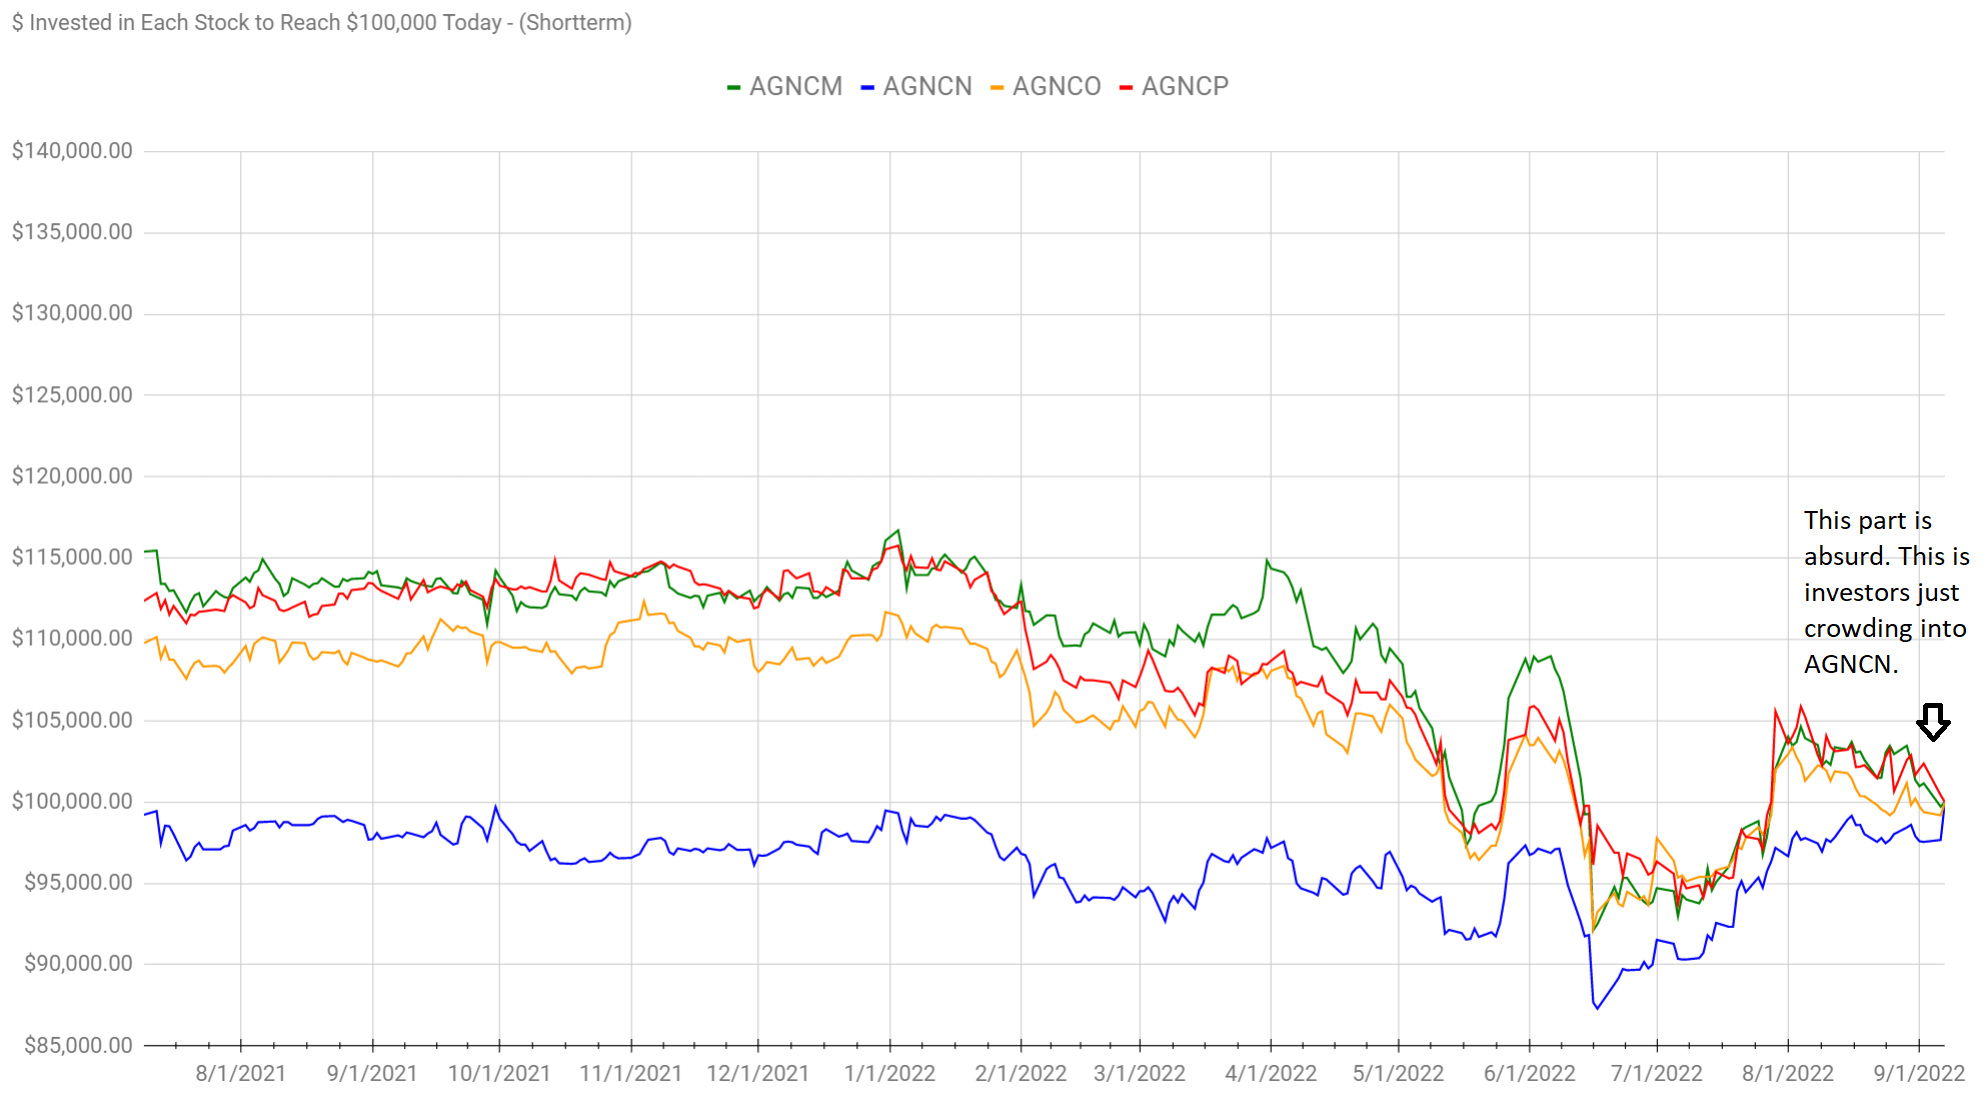
Investors are piling into AGNCN in anticipation of the upcoming switch to a floating rate on 10/15/2022. The floating rate is great and it will result in a very material increase in the dividend rate. However, the difference isn’t remotely close to covering the spread for the cost of shares.
AGNCO is the most direct comparison because AGNCO’s floating spread of 4.993% is the closest to AGNCN’s spread of 5.111%.
When both are floating, AGNCN should cost a tiny bit more than AGNCO.
Therefore, the question is whether AGNCN’s new dividend rate is high enough to warrant paying an extra $2.70 per share. The answer is no.
AGNCN floats 2 years earlier than AGNCO. To earn $2.70 over 2 years, AGNCN needs to pay out about $1.35 per share more than AGNCO. These figures are a bit rough, but only by a few pennies.
AGNCO will pay out $1.625 per year for those two years.
For AGNCN to pay out an extra $1.35 per year, it needs to average $2.975 per share for the next two years. That would be 11.9% on the face value of $25.
Since the spread is 5.111%, that means the short-term rate would need to average about 6.789% over that time period.
That’s not happening.
Favorable Scenario for AGNCN
I would consider short-term rates averaging 4% over the next 2 years to be pretty high. If we saw that, AGNCN would average an annualized floating rate of $2.277. That scenario would justify a price spread of $1.3055 – if investors could be confident AGNCN wouldn’t get called.
Compared to the current spread of $2.70, that’s a huge swing.
My price targets use a smaller spread because if AGNCN gets called, I would expect prices to pop materially higher for the other AGNC preferred shares. That creates additional upside that has some level of value that deserves to be recognized.
Some Minor Adjustments Will Be Needed
I’ll need to make some slight adjustments to the targets to reflect short-term rates rising faster than previously expected. However, the adjustments should generally be pretty small with most being less than 2%.
These are the current targets:
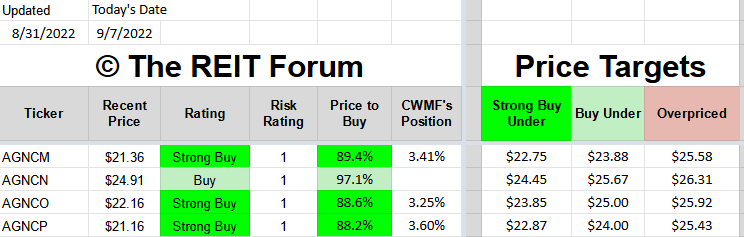
Note: The price targets already include the value of dividend accrual.
Signal From Markets
With AGNCN moving to trade so close to call value, the markets are telling investors that a floating yield over 8.4% on an AGNC preferred share is simply too good. Therefore, we should expect the other AGNC preferred shares to rally as investors realize that they can have a similar share in a year or two. They get a lower dividend rate upfront, but they pay a lower price and should see share prices become much closer to each other.
$100K Chart
The chart shows the recent outperformance. This is a clear market failure.
Bid and Ask
The difference of $2.70 isn’t just in the Google Sheets.
Here’s the bid and ask on AGNCO as I’m writing:
Schwab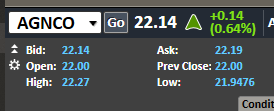
Notice the ask at $22.19.
For AGNCN, the bid is at $24.91:
Schwab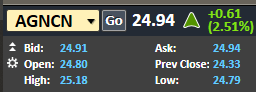
That’s a spread of $2.72 based on the prices an investor would expect (liquidity permitting) from selling AGNCN to the bid at $24.91 and buying AGNCO at the ask of $22.19.
The article was prepared on the basis of $2.70.
In my opinion, AGNCP and AGNCM are similarly attractive to AGNCO. However, to get this alert out quickly, I focused on only one share.
This is a home-run opportunity for investors in AGNCN to switch shares.
PS. AGNCN technically falls into our “buy under” target, but investors should look at the relative attractiveness between shares. The other options are dramatically more attractive.
Other Topics
That was the end of yesterday’s alert to subscribers. I’ve got a few more things to write today.
Annaly Capital Management (NLY) just announced a 1-for-4 reverse split. Well, looks like the price of NLY will be over $10 per share again! The reverse split should send prices over $25.00, at least temporarily. That doesn’t really help investors, but it will be nice for having a bit more precision on “per share” metrics since it reduces rounding errors.
NLY still trades at a significant premium to book value. They issued shares at the start of August, but they should be looking to issue more shares as soon as they can. Investors can still buy other mortgage REITs with similar assets at materially lower valuations. Choosing to buy NLY over the other REITs is simply refusing to consider the facts.
NLY also declared a dividend at $.88, which is the same as the $.22 per share before the split.
The rest of the charts in this article may be self-explanatory to some investors. However, if you’d like to know more about them, you’re encouraged to see our notes for the series.
Stock Table
We will close out the rest of the article with the tables and charts we provide for readers to help them track the sector for both common shares and preferred shares.
We’re including a quick table for the common shares that will be shown in our tables:
Let the images begin!
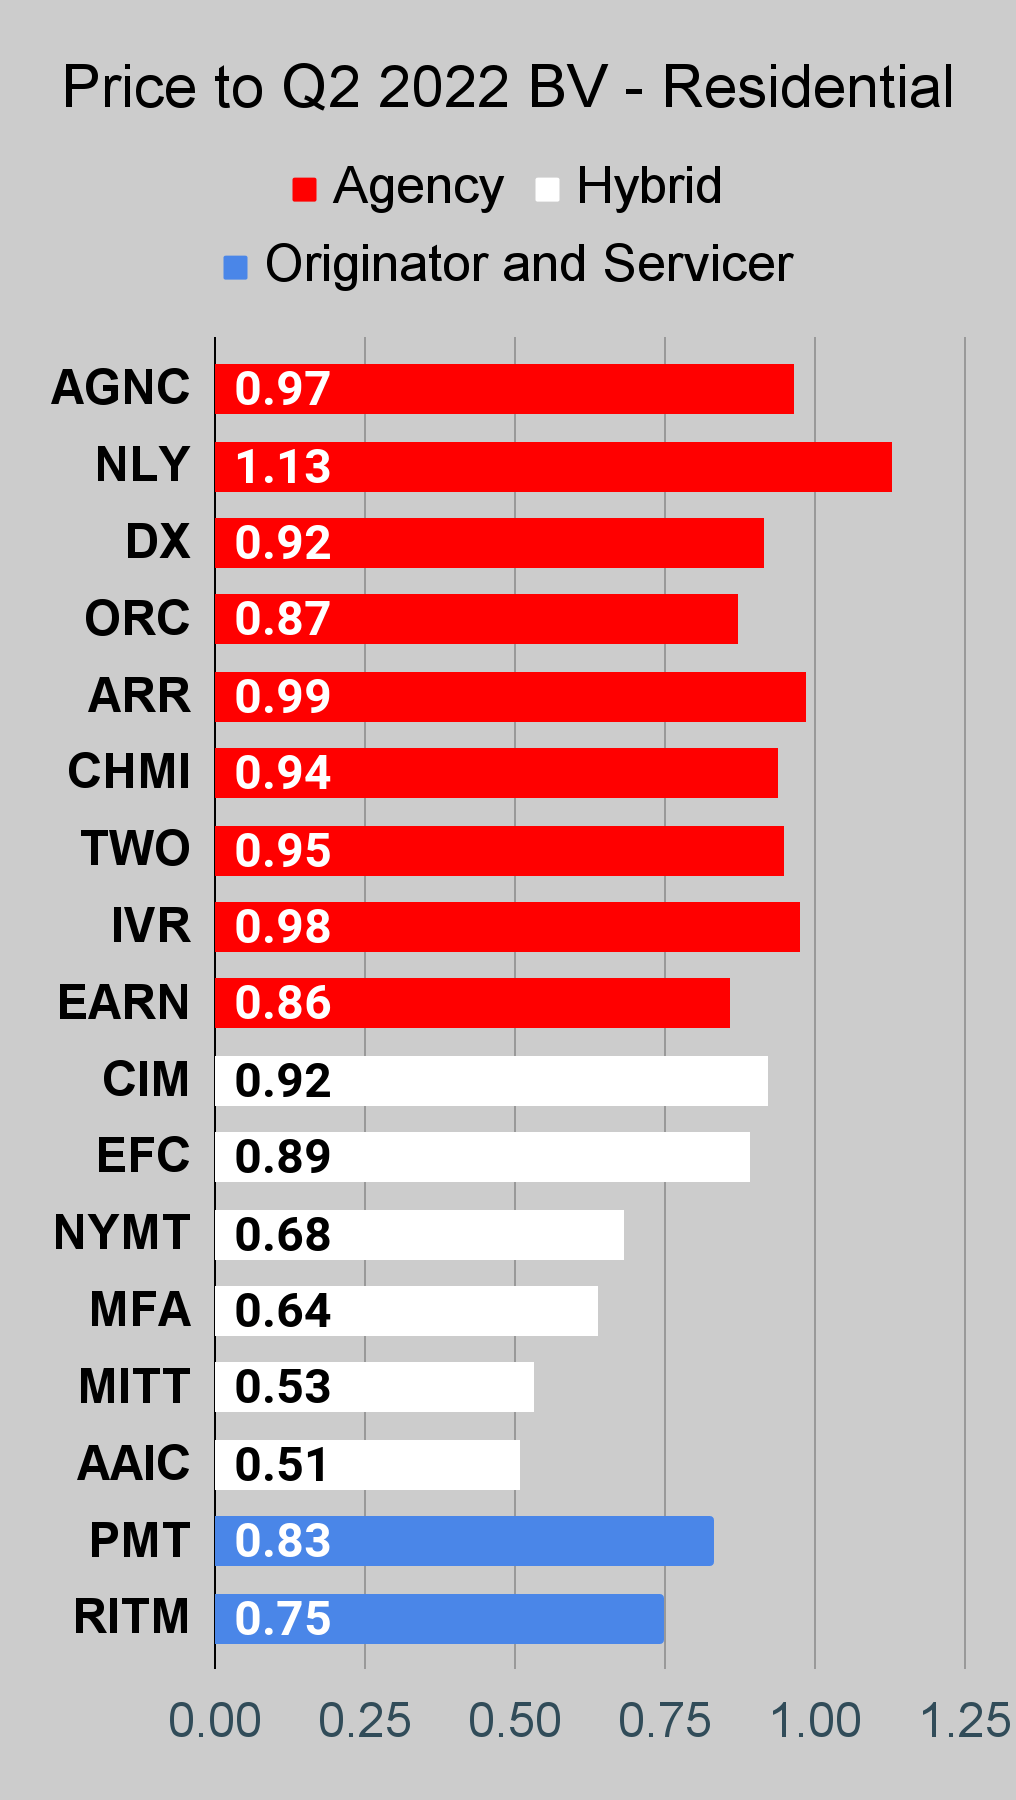
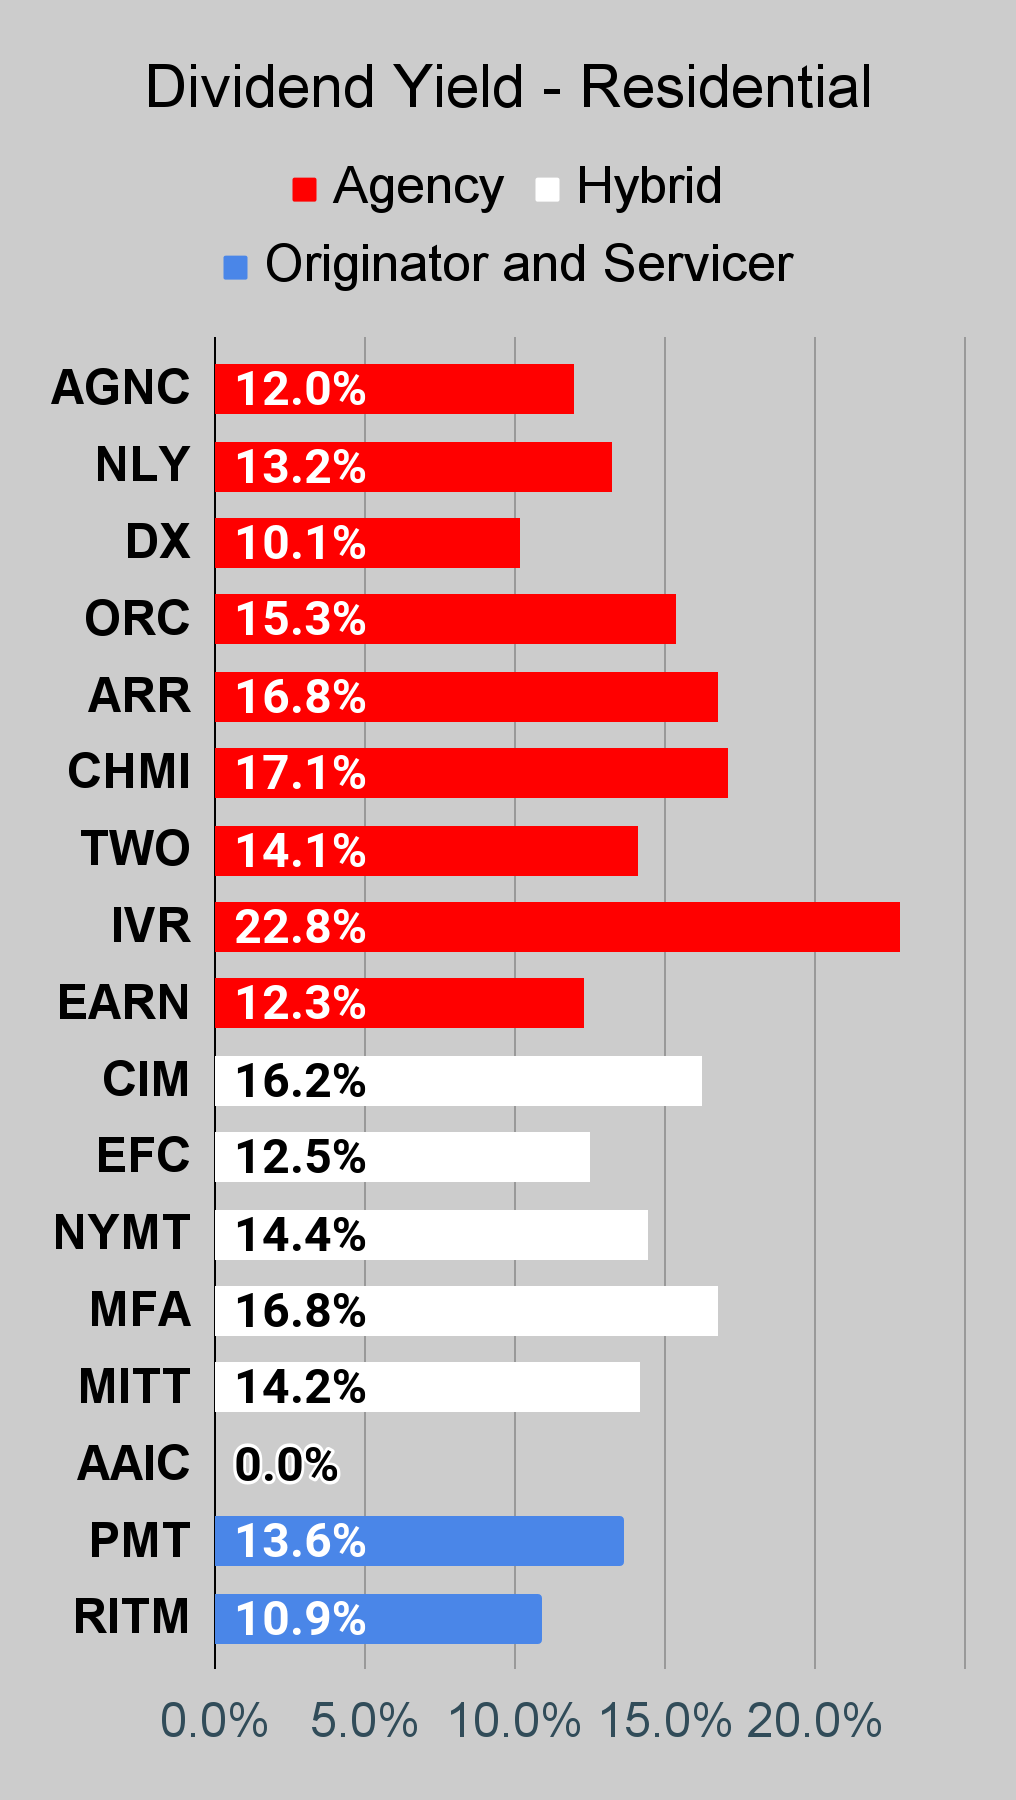
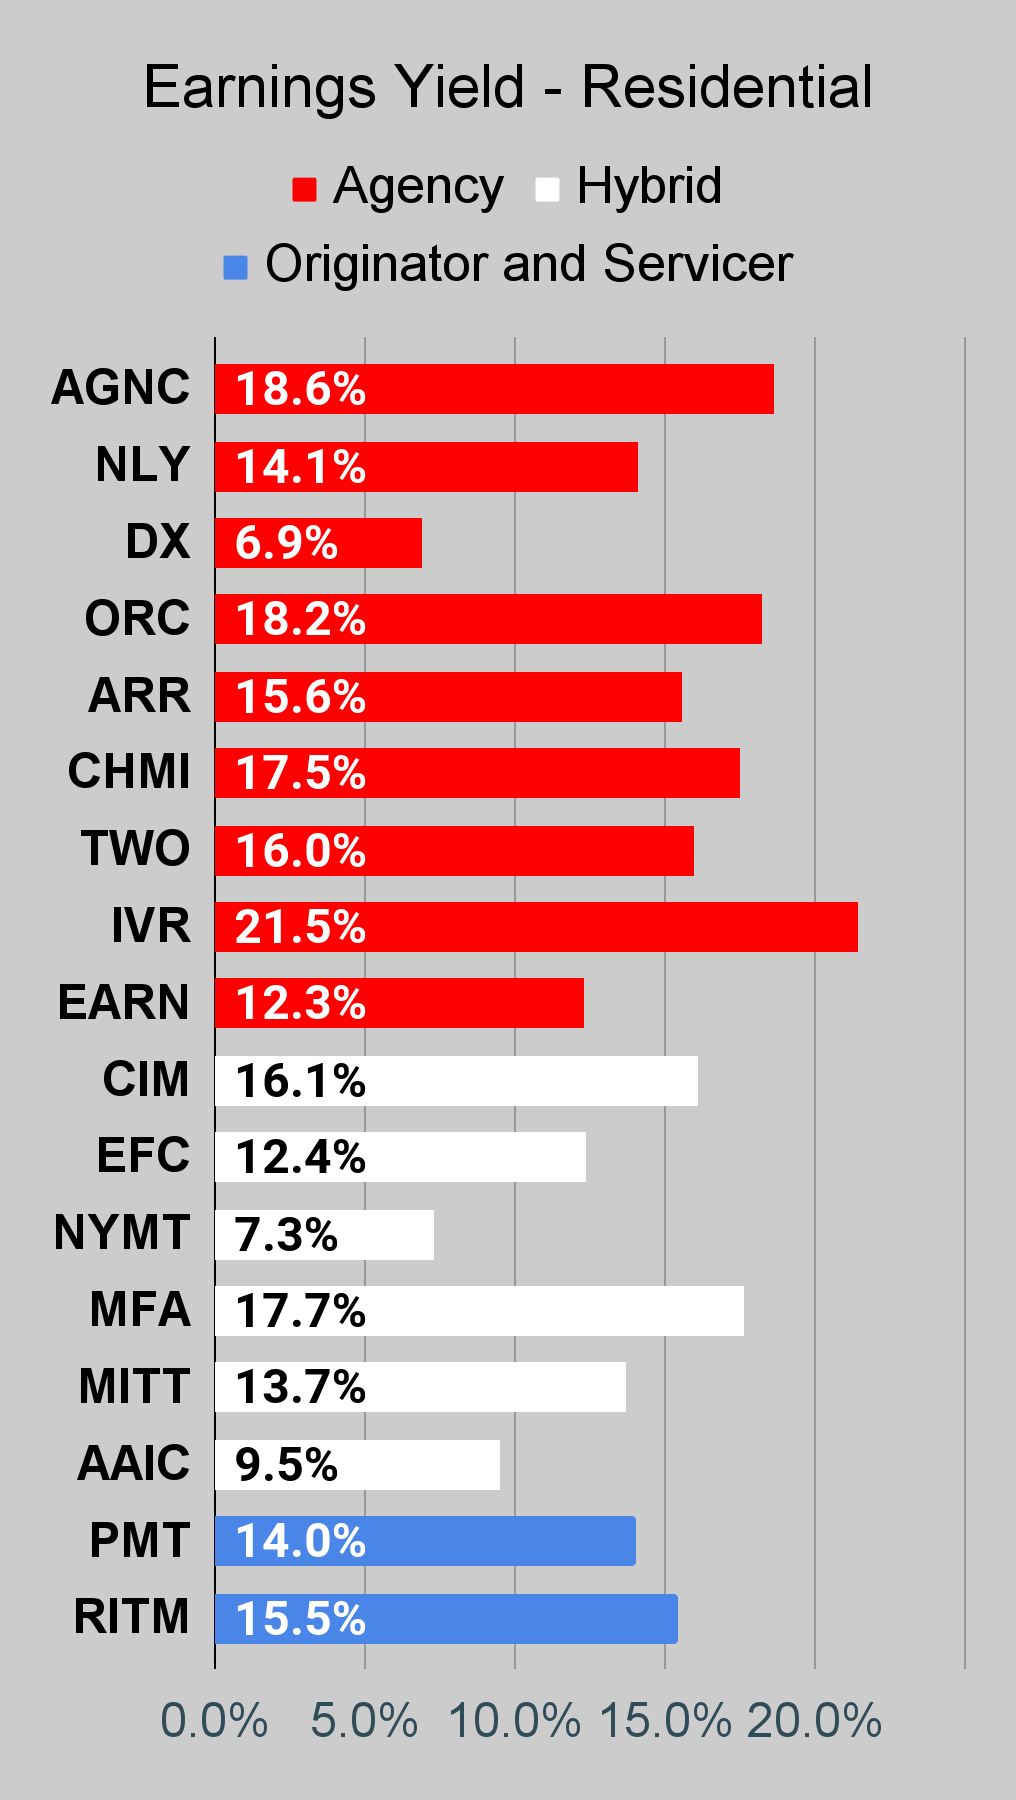
Residential Mortgage REIT Charts
Note: The chart for our public articles uses the book value per share from the latest earnings release. Current estimated book value per share is used in reaching our targets and trading decisions. It is available in our service, but those estimates are not included in the charts below.
 The REIT Forum |
 The REIT Forum |
 The REIT Forum |
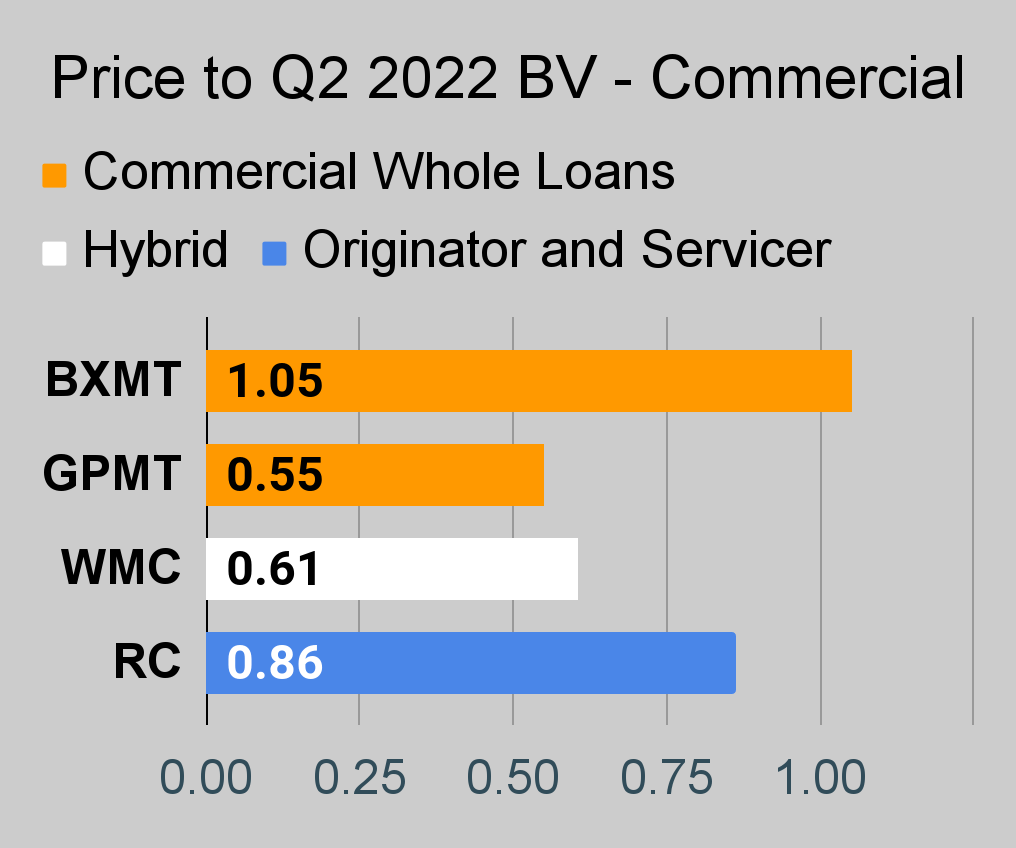
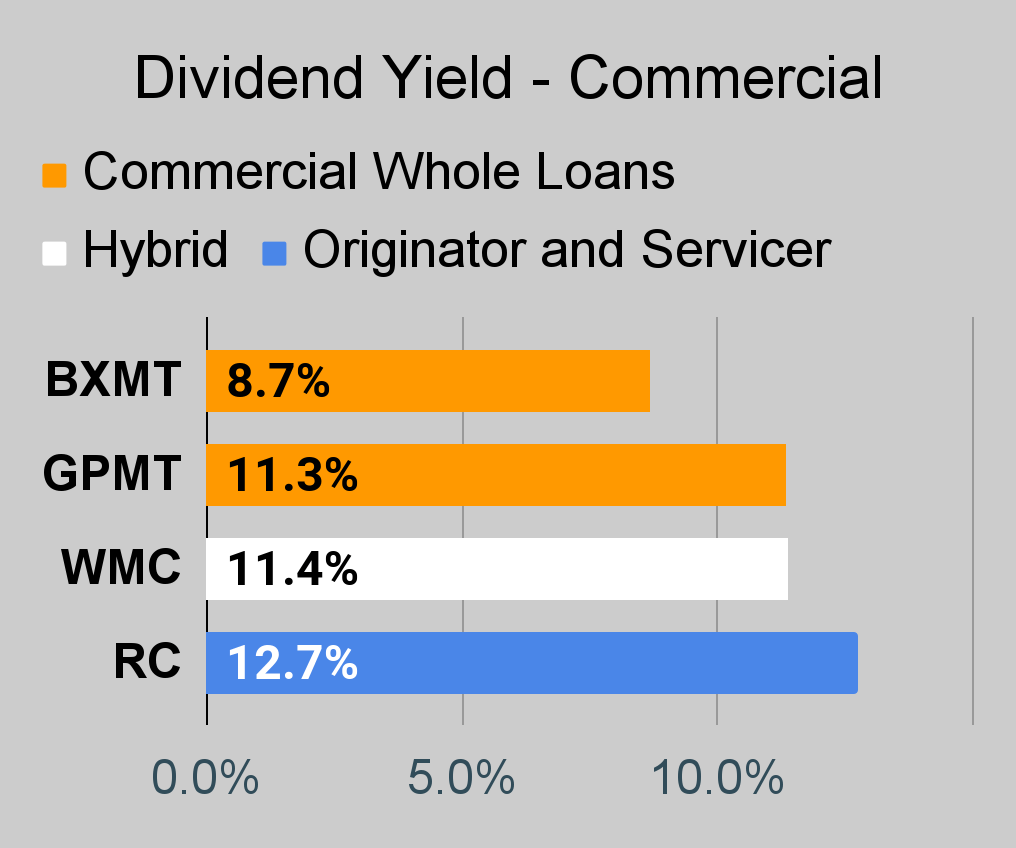
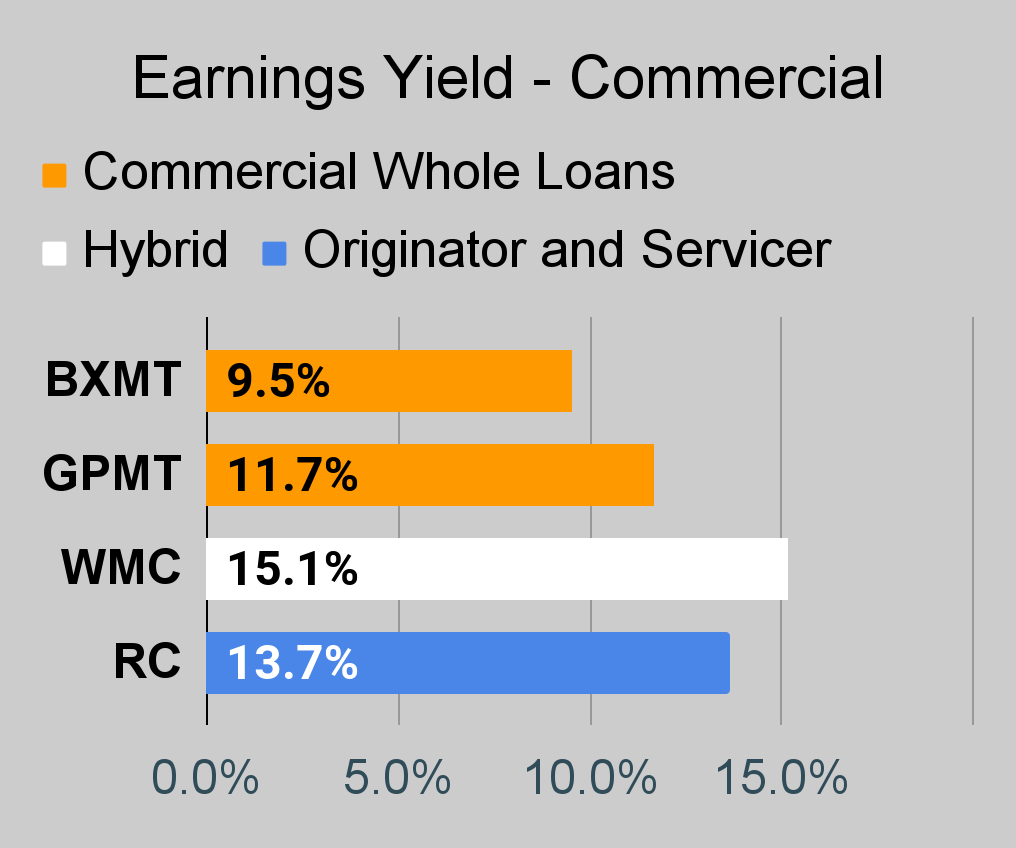
Commercial Mortgage REIT Charts
 The REIT Forum |
 The REIT Forum |
 The REIT Forum |
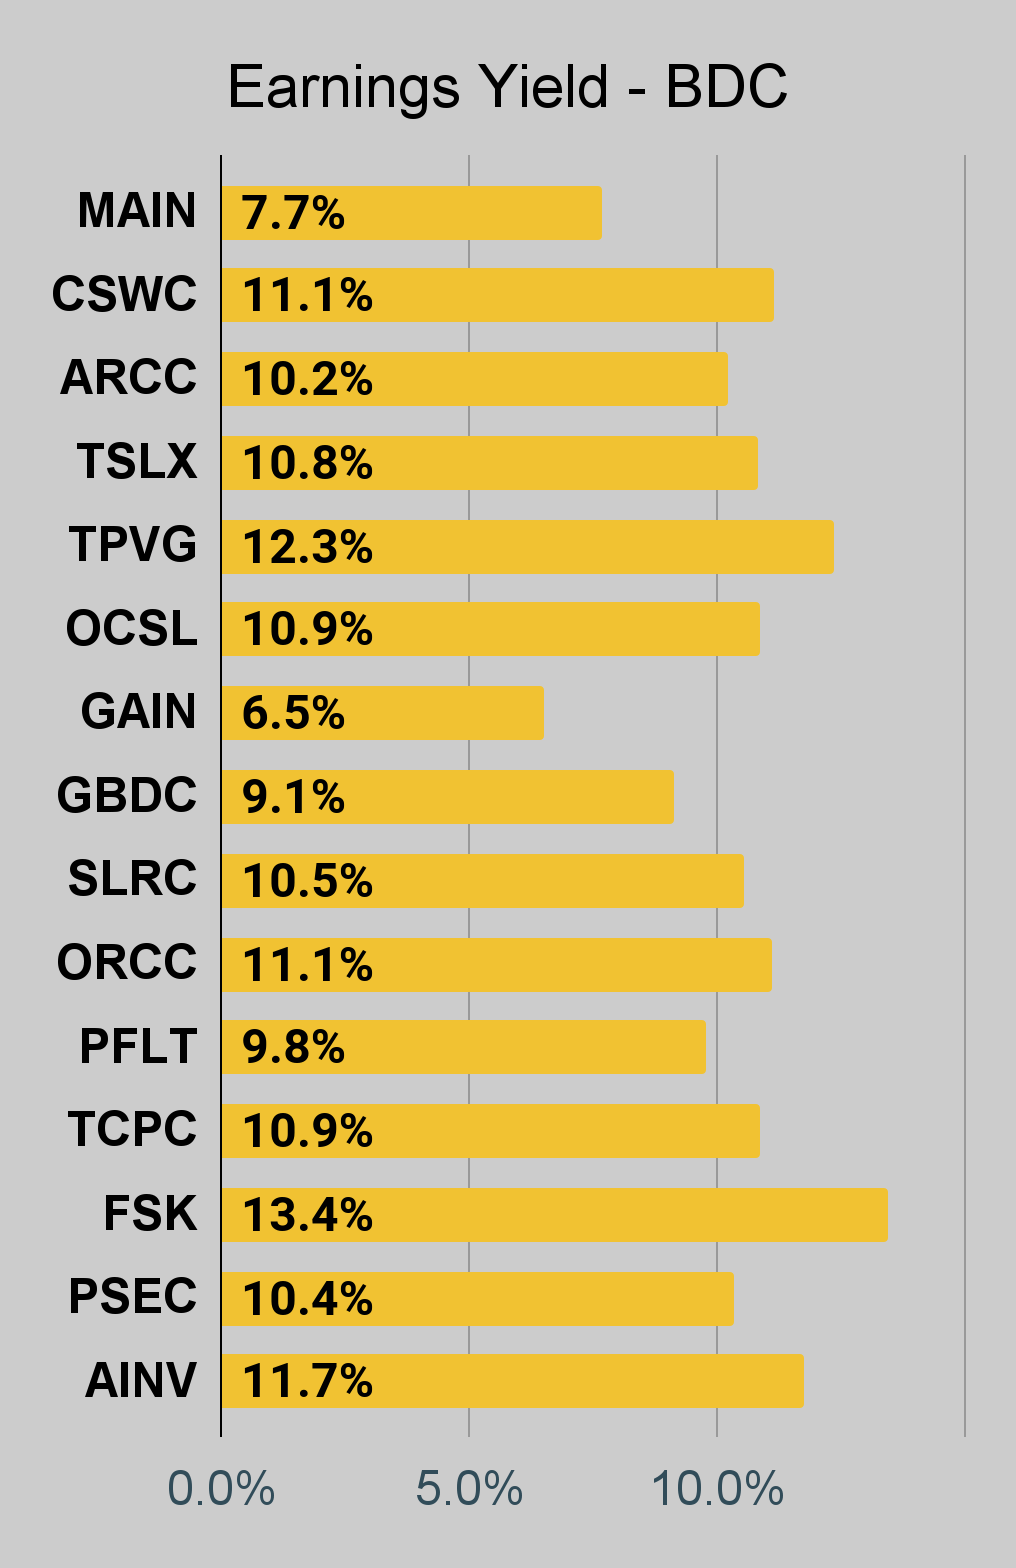
BDC Charts
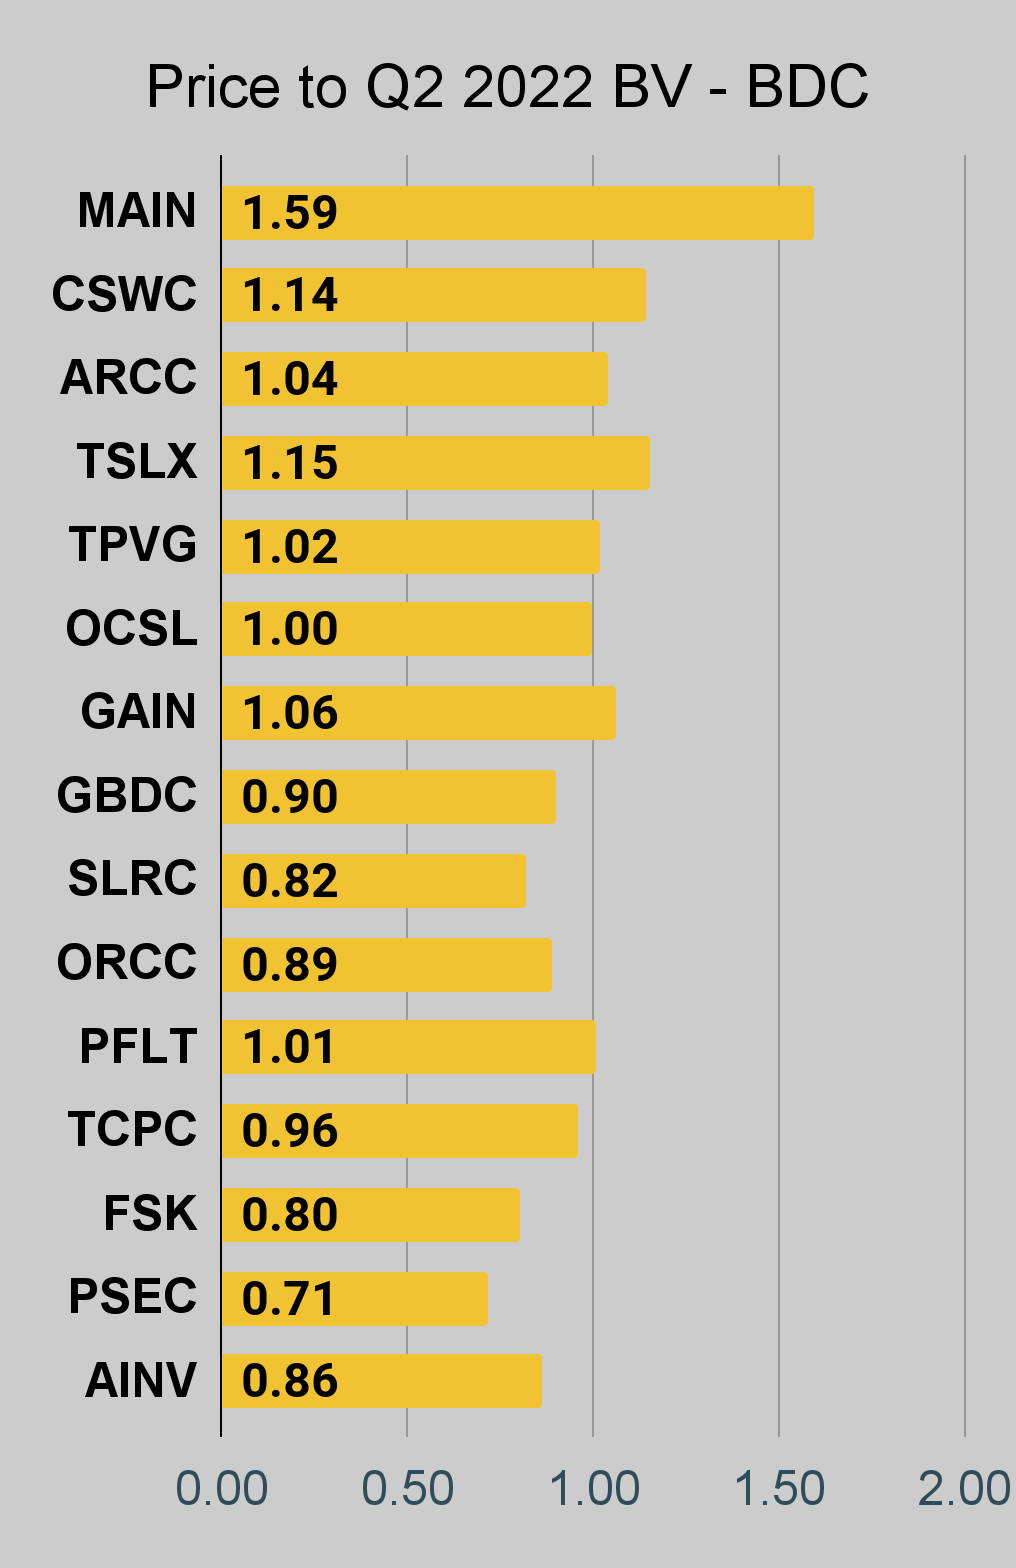 The REIT Forum |
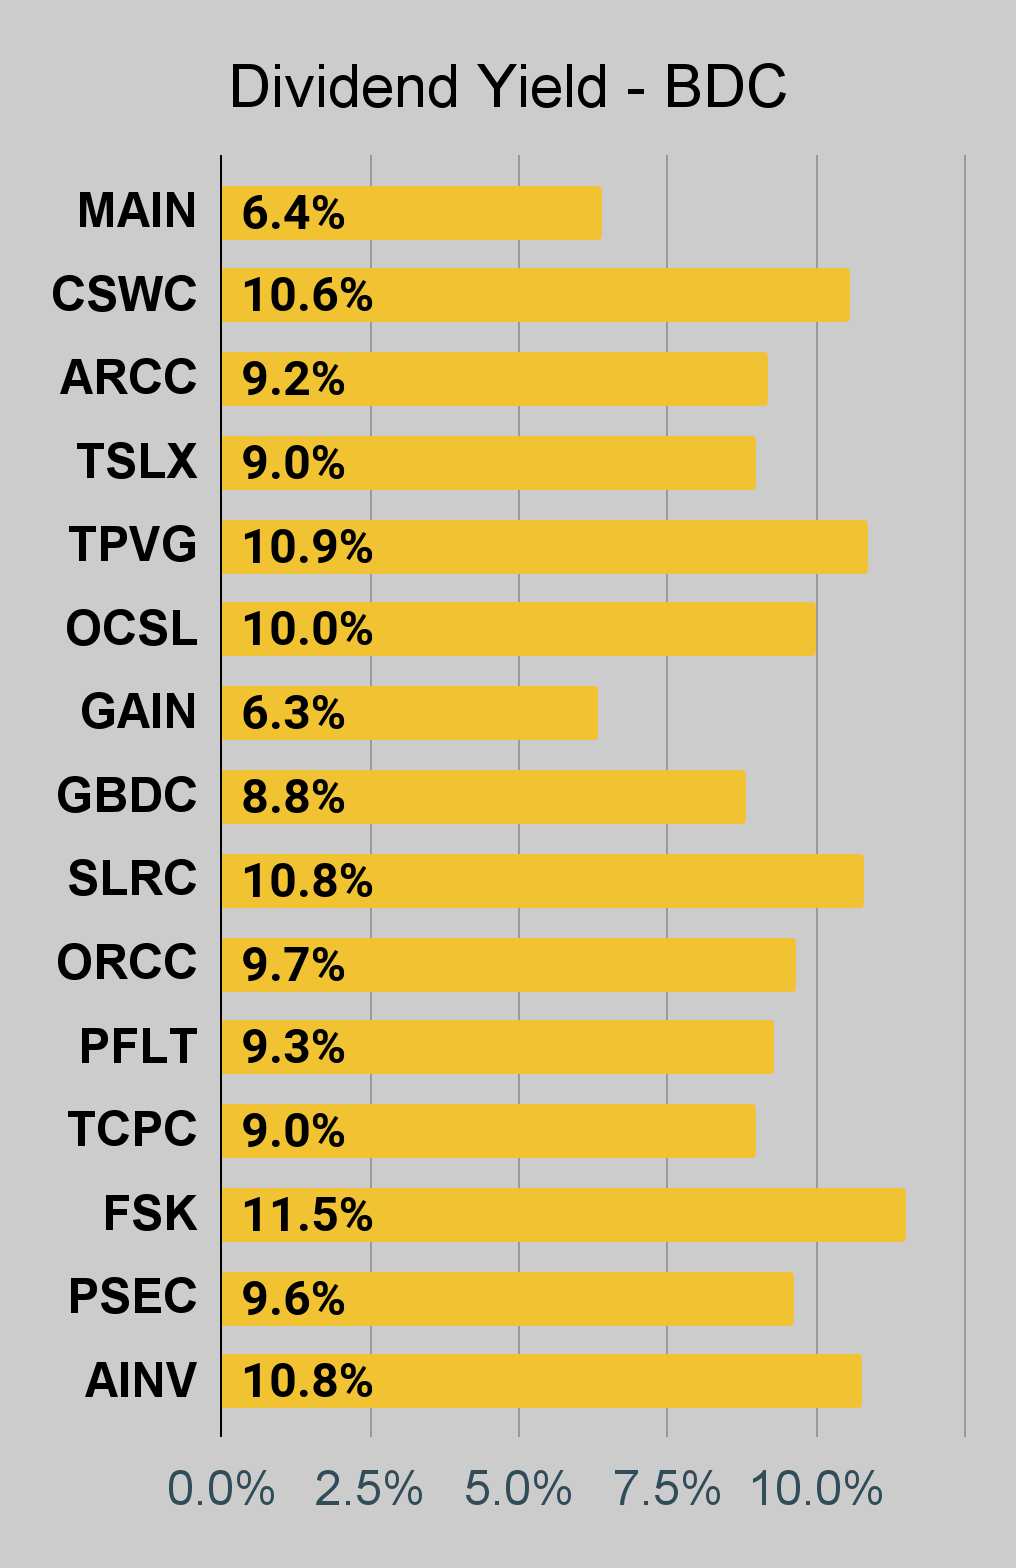 The REIT Forum |
 The REIT Forum |
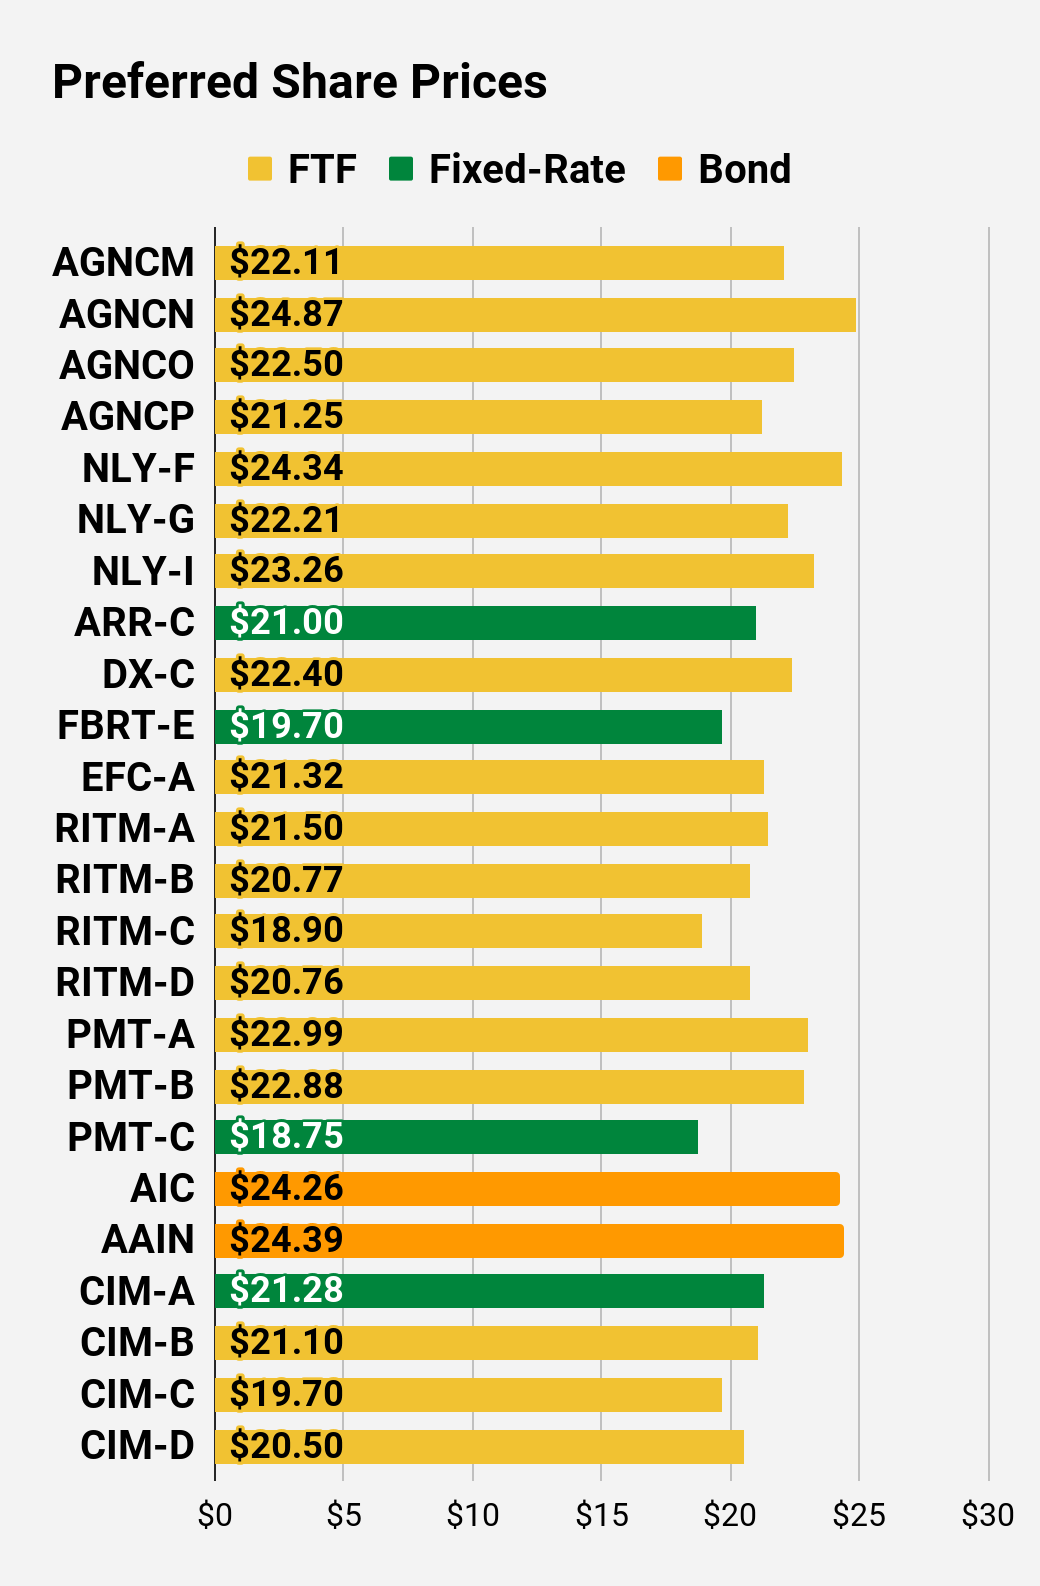
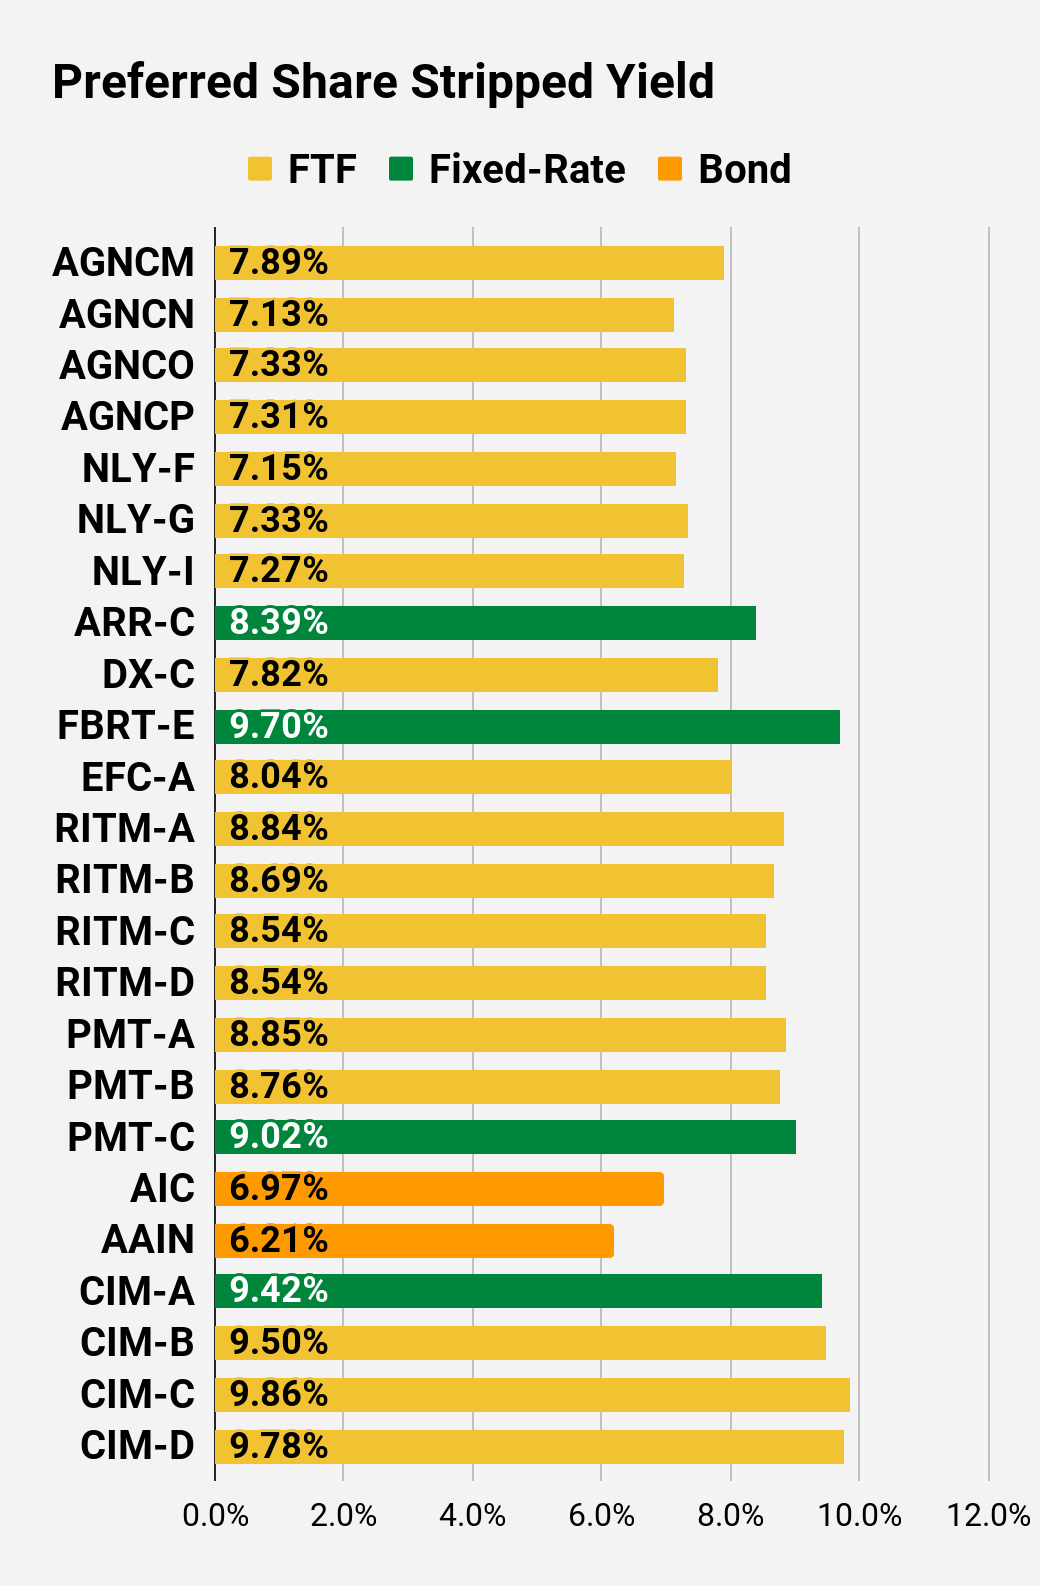
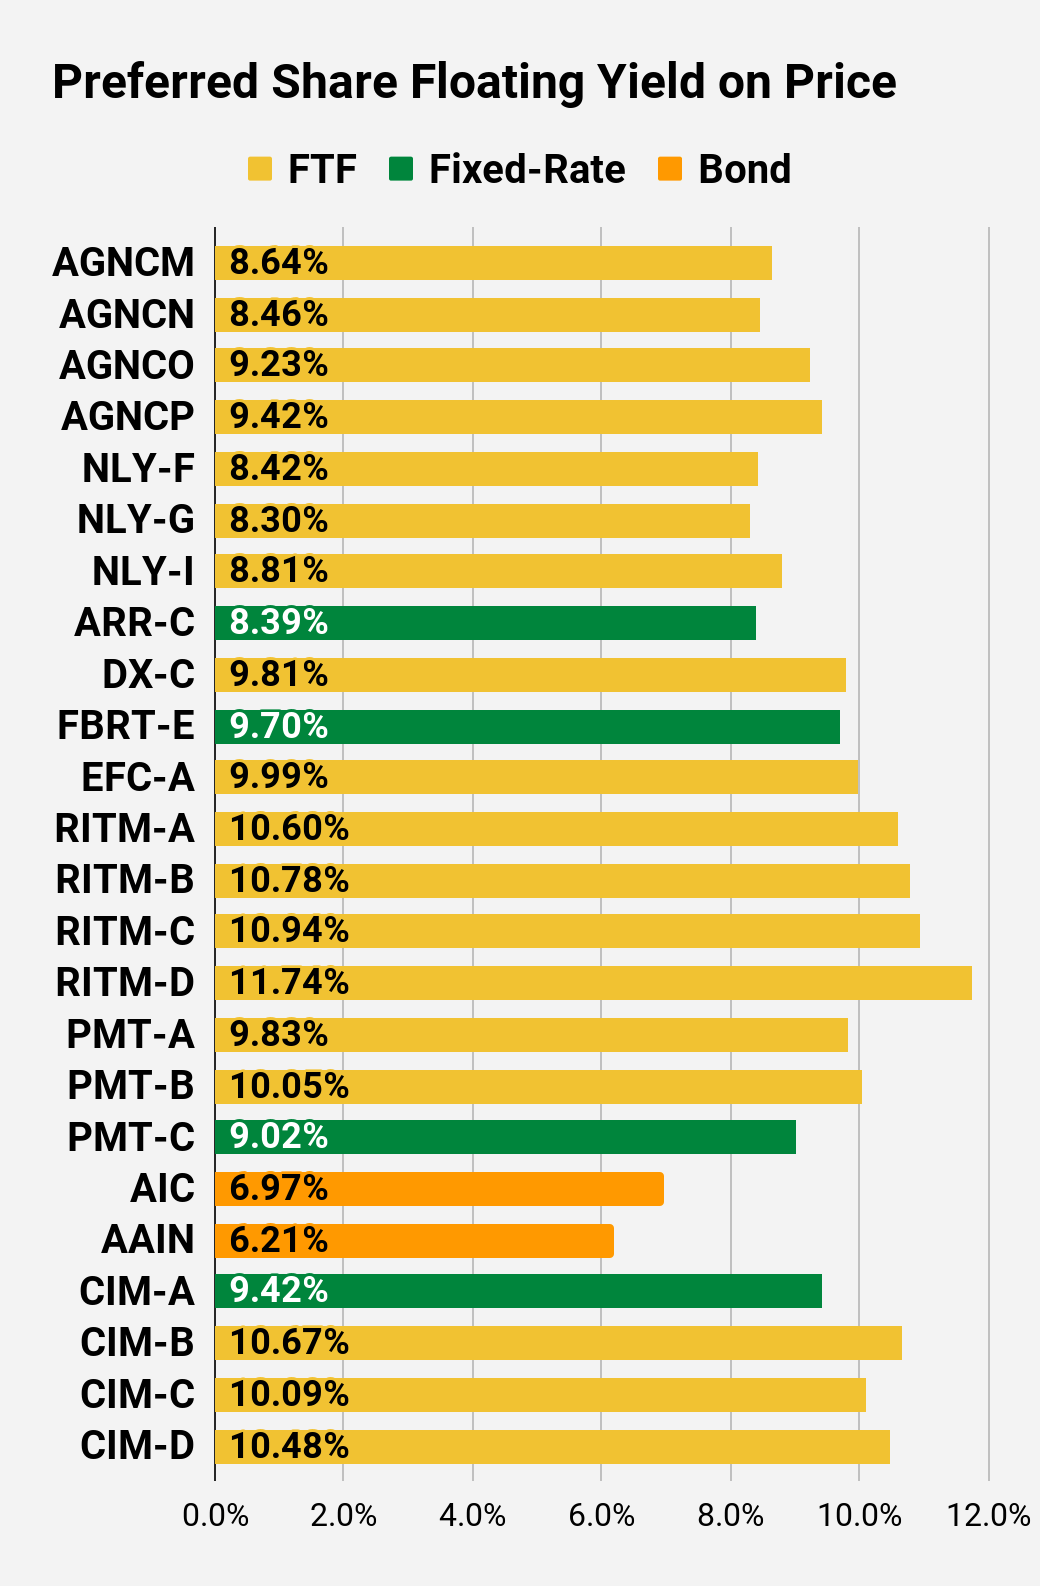
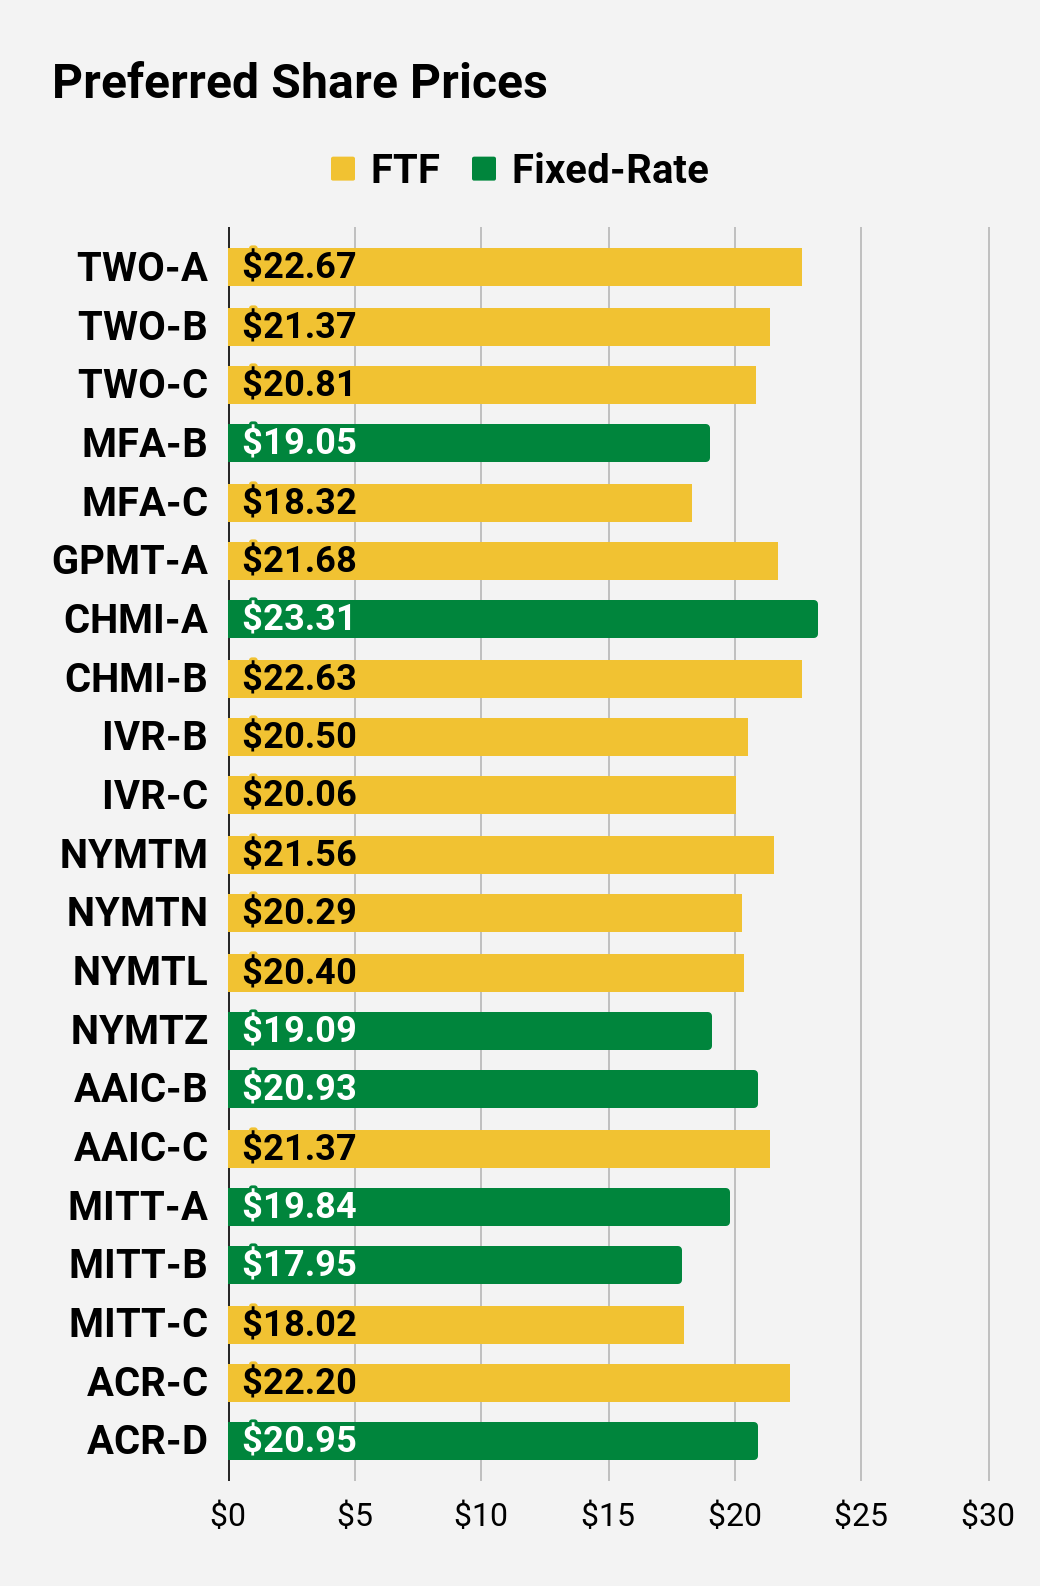
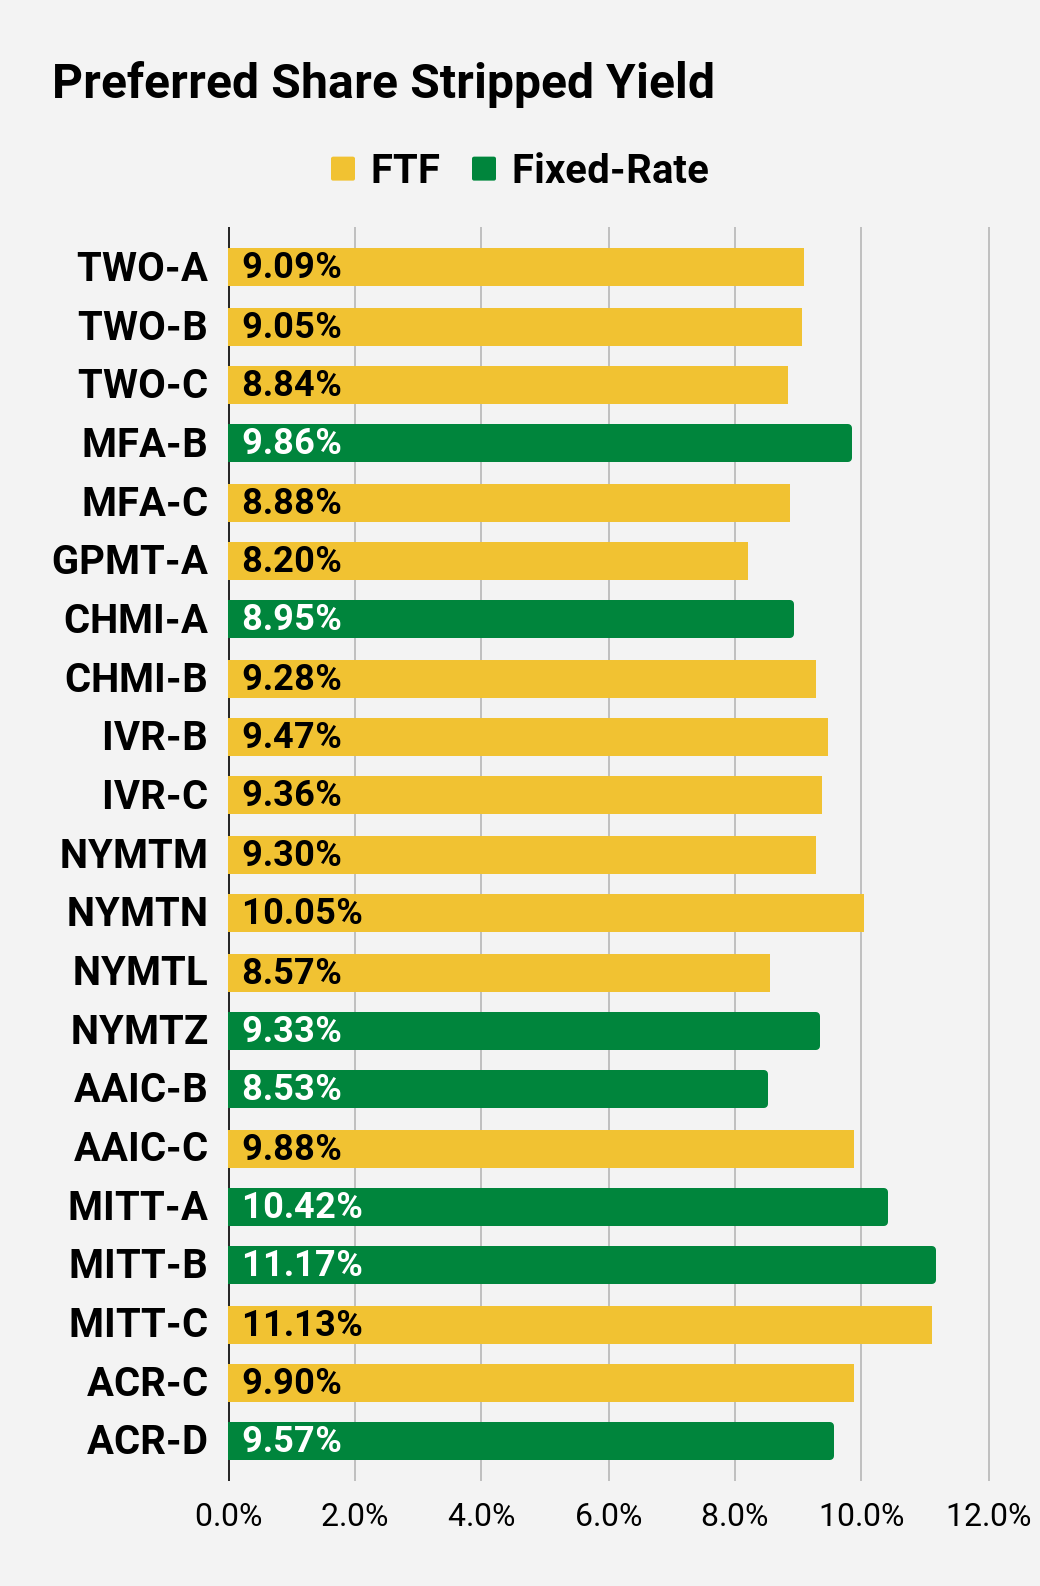
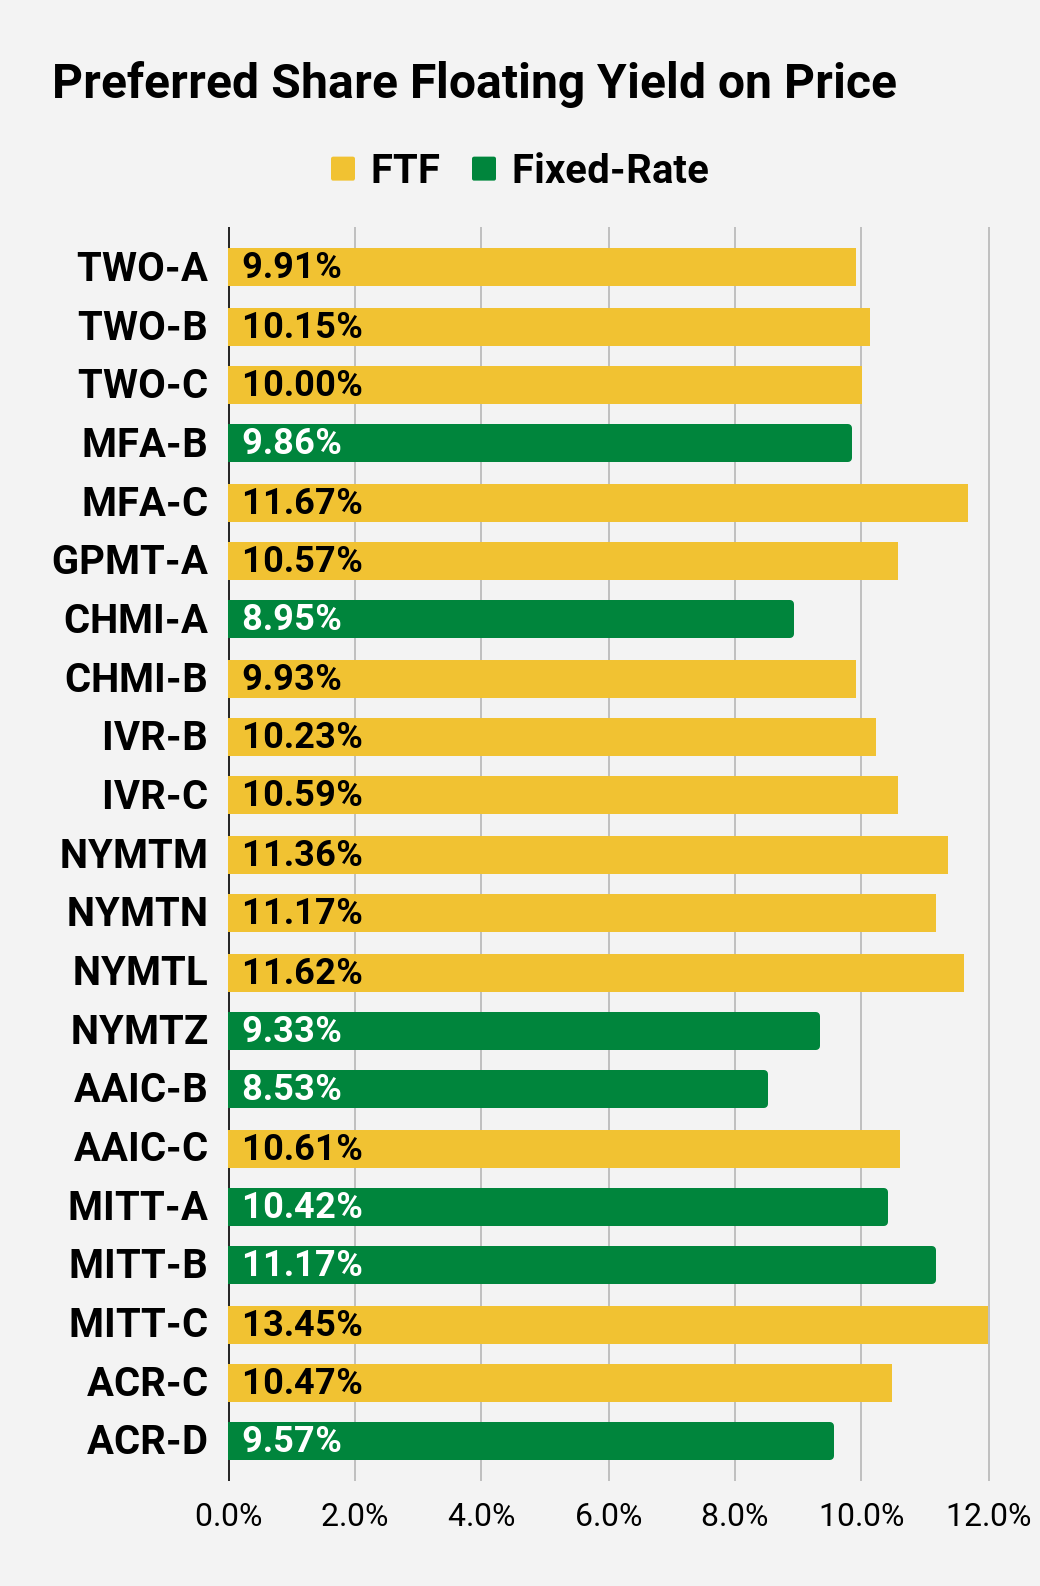
Preferred Share Charts
 The REIT Forum |
 The REIT Forum |
 The REIT Forum |
 The REIT Forum |
 The REIT Forum |
 The REIT Forum |
Preferred Share Data
Beyond the charts, we’re also providing our readers with access to several other metrics for the preferred shares.
After testing out a series on preferred shares, we decided to try merging it into the series on common shares. After all, we are still talking about positions in mortgage REITs. We don’t have any desire to cover preferred shares without cumulative dividends, so any preferred shares you see in our column will have cumulative dividends. You can verify that by using Quantum Online. We’ve included the links in the table below.
To better organize the table, we needed to abbreviate column names as follows:
- Price = Recent Share Price – Shown in Charts
- BoF = Bond or FTF (Fixed-to-Floating)
- S-Yield = Stripped Yield – Shown in Charts
- Coupon = Initial Fixed-Rate Coupon
- FYoP = Floating Yield on Price – Shown in Charts
- NCD = Next Call Date (the soonest shares could be called)
- Note: For all FTF issues, the floating rate would start on NCD.
- WCC = Worst Cash to Call (lowest net cash return possible from a call)
- QO Link = Link to Quantum Online Page
Second Batch:
Strategy
Our goal is to maximize total returns. We achieve those most effectively by including “trading” strategies. We regularly trade positions in the mortgage REIT common shares and BDCs because:
- Prices are inefficient.
- Long-term, share prices generally revolve around book value.
- Short-term, price-to-book ratios can deviate materially.
- Book value isn’t the only step in analysis, but it is the cornerstone.
We also allocate to preferred shares and equity REITs. We encourage buy-and-hold investors to consider using more preferred shares and equity REITs.
Performance
We compare our performance against 4 ETFs that investors might use for exposure to our sectors:
The REIT Forum
The 4 ETFs we use for comparison are:
|
Ticker |
Exposure |
|
One of the largest mortgage REIT ETFs |
|
|
One of the largest preferred share ETFs |
|
|
Largest equity REIT ETF |
|
|
The high-yield equity REIT ETF. Yes, it has been dreadful. |
When investors think it isn’t possible to earn solid returns in preferred shares or mortgage REITs, we politely disagree. The sector has plenty of opportunities, but investors still need to be wary of the risks. We can’t simply reach for yield and hope for the best. When it comes to common shares, we need to be even more vigilant to protect our principal by regularly watching prices and updating estimates for book value and price targets.
Ratings: Bullish on preferred shares AGNCM / AGNCN / AGNCP.
Be the first to comment