

lakshmiprasad S/iStock via Getty Images
Many investors may think now is the time to buy the dip in Technology stocks. Proceed with caution. Many Technology stocks, despite significant drops, still have much further to fall. We’ve identified a technology-focused All Cap Growth mutual fund with an investment methodology that looks good on paper but has failed in execution. Our deep dive into the fund’s holdings reveal a portfolio that is inferior to its benchmark and the S&P 500. Franklin Custodian Funds’ Dynatech Fund (MUTF:FKDNX) is in the Danger Zone.
Forward-Looking Research Makes A (Very Unattractive) Difference
Our fund research differs from legacy fund research because it is forward-looking and based on fundamental, bottom-up research on each individual fund holding. Most legacy fund research is backward-looking because it is based on past price performance.
Figure 1 shows the how different our forward-looking Fund Ratings are compared to Morningstar (MORN). We rate FKDNX as Very Unattractive (equivalent to Morningstar’s 1 Star), while Morningstar gives FKDNX, along with three of its other classes (FDTRX, FDYZX, FDNRX), its 4 Star rating. FDYNX gets a 3 Star rating.
Figure 1: Franklin Dynatech Fund Ratings
Franklin Dynatech Fund Ratings Vs. Morningstar (New Constructs, LLC)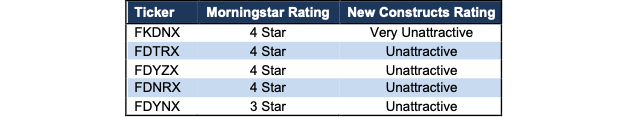
Sources: New Constructs, LLC, company, mutual fund filings, and Morningstar
Solid Methodology On Paper, Poor Execution On The Field
Similar to ARK Innovation Fund (ARKK), Franklin Dynatech Fund has an alluring investment methodology on paper. The fund’s annual report notes the fund managers use “fundamental, bottom-up research to seek companies meeting our criteria of growth potential, quality, and valuation”. The managers believe the key attributes of “quality” are:
- experienced and talented management teams
- financial strength reflected in:
- gross and operating margins
- free cash flow generation
- returns on capital employed
We would generally applaud the use of fundamental data, free cash flow generation, and return on capital employed, especially given that improving return on invested capital (similar to return on capital employed) is directly correlated with improving shareholder value.
However, stating a methodology and successfully executing such methodology are not the same, and our rigorous holdings analysis reveals FKDNX’s stated methodology does not translate to its actual portfolio.
The fund invests in companies with lower ROICs, negative cash flows, and more expensive valuations than its benchmark and the S&P 500. More details below.
Holdings Research Reveals A Low “Quality” Portfolio
Our rigorous holdings analysis, leveraging our Robo-Analyst technology, reveals that FKDNX holds much lower-quality stocks than its benchmark, iShares Core S&P U.S. Growth ETF (IUSG) and the market, represented by State Street SPDR S&P 500 ETF (SPY).
Per Figure 2, FKDNX allocates 32% of its portfolio to Unattractive-or-worse rated stocks compared to just 7% for IUSG. On the flip side, FKDNX’s exposure to Attractive-or-better rated stocks is much lower, at 15%, versus IUSG at 30%.
Figure 2: Franklin Dynatech Fund Allocates To Far Worse Stocks Than IUSG
FKDNX Holdings vs. IUSG (New Constructs, LLC)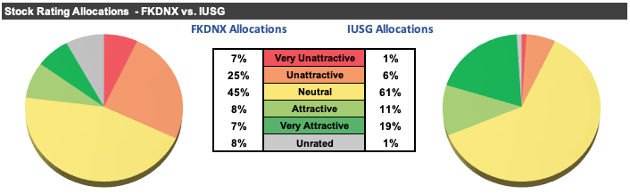
Sources: New Constructs, LLC, company, and ETF and mutual fund filings
Our holdings analysis also reveals FKDNX’s portfolio is much lower quality than the S&P 500. Per Figure 3, FKDNX allocates 32% of its portfolio to Unattractive-or-worse rated stocks compared to just 13% for SPY. On the flip side, FKDNX’s exposure to Attractive-or-better rated stocks is much lower, at 15%, versus SPY at 36%.
Figure 3: Franklin Dynatech Fund Allocates To Far Worse Stocks Than SPY
FKDNX Holdings vs. SPY (New Constructs, LLC)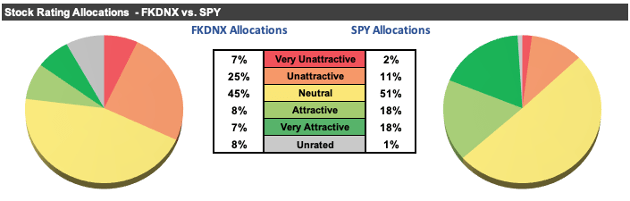
Sources: New Constructs, LLC, company, and ETF and mutual fund filings
Given the unfavorable allocation of Attractive-or-better rated stocks vs. Unattractive-or-worse rated stocks relative to the benchmark, FKDNX appears poorly positioned to generate the outperformance required to justify higher fees.
Expensive Stocks Drive Very Unattractive Risk/Reward Rating
Figure 4 contains our detailed rating for FKDNX, which includes each of the criteria we use to rate all ETFs and mutual funds under coverage. These criteria are the same for our Stock Rating Methodology, because the performance of a mutual fund’s holdings equals the performance of a mutual fund after fees. FKDNX’s Very Unattractive rating is primarily driven by holding stocks with expensive valuations.
Figure 4: Franklin Dynatech Fund Rating Details
FKDNX Rating Breakdown (New Constructs, LLC)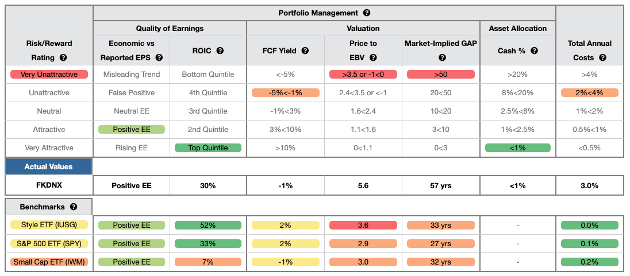
Sources: New Constructs, LLC and company, ETF and mutual fund filings
As Figure 4 shows, FKDNX is inferior to the iShares U.S. Large Cap Growth ETF and SPY in four of the five criteria that make up our holdings/Portfolio Management analysis. Specifically:
- FKDNX’s ROIC is 30%, below the 52% IUSG earns and the 33% SPY earns
- FKDNX’s free cash flow yield of -1% is lower than IUSG’s and SPY’s at 2%
- the price-to-economic book value ratio for FKDNX is 5.6, which is greater than the 3.6 for IUSG and 2.9 for SPY
- our discounted cash flow analysis reveals an average market implied growth appreciation period of 57 years for FKDNX’s holdings compared to 33 years for IUSG and 27 years for SPY
The market expectations for FKDNX’s holdings are for profit growth (measured by PEBV ratio) that is over 5x higher than current profits and significantly more than the profit growth expectations embedded in IUSG’s and SPY’s holdings, which are already more profitable.
Overpriced: Rich Fees For Poor Holdings
At 3.03%, FKDNX’s total annual costs are higher than 86% of the 459 All Cap Growth mutual funds under coverage. For comparison, the simple average TAC of all the All Cap Growth mutual funds under coverage is 1.64%, the asset-weighted average is 1.30%. IUSG charges just 0.04%, and SPY has total annual costs of just 0.10%. Why pay higher fees for inferior stock selection?
Our TAC metric accounts for more than just the expense ratio. We consider the impact of front-end loads, back-end loads, redemption fees, and transaction costs. For example, FKDNX’s annual turnover ratio of 19% adds 0.04% to its total annual costs – which isn’t captured by the expense ratio. Figure 5 shows our breakdown of FKDNX’s total annual costs.
Figure 5: Franklin Dynatech Fund’s Total Annual Costs Breakdown
FKDNX Total Annual Costs (New Constructs, LLC)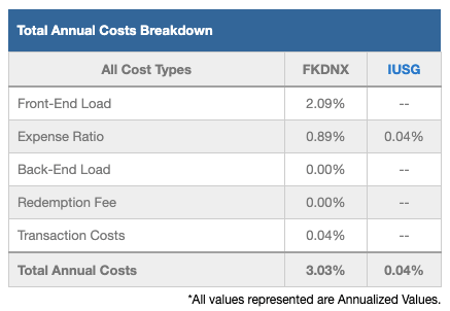
Sources: New Constructs, LLC and company, ETF and mutual fund filings
To justify its higher fees, FKDNX must outperform its benchmark by 2.98% annually over three years, the average holding period for all funds.
However, FKDNX’s 3-year quarter-end trailing annual return has outperformed IUSG by just 21 basis points. Its quarter-end trailing one-year return has underperformed IUSG by 24.9%.
Given that 32% of assets are allocated to stocks with Unattractive-or-worse ratings, and 77% are allocated to stocks with Neutral-or-worse ratings, FKDNX looks likely to continue to underperform including fees.
Get An Edge From Holdings-Based Fund Analysis Based On Superior Stock Research
Smart mutual fund (or ETF) investing means analyzing the each of the holdings of a fund. Failure to do so is a failure to perform proper due diligence. Simply buying an ETF or mutual fund based on past performance does not necessarily lead to outperformance. Only thorough holdings-based research can help determine if an ETF’s methodology leads managers to pick high-quality or low-quality stocks.
Easily Make Any Fund, Even FKDNX, Better
As we showed in The Paradigm Shift to Self-Directed Portfolio Construction, new technologies enable investors to create their own funds without any fees while also offering access to more sophisticated weighting methodologies. If, for instance, investors wanted exposure to FKDNX’s holdings, but weighted by Core Earnings, the risk/reward of this customized version of the fund improves significantly:
- 32% of assets to Attractive-or-better rated stocks (compared to 15% for FKDNX)
- 4% of assets to Unattractive-or-worse rated stocks (compared to 32% for FKDNX).
Compare the quality of stock allocation in our customized version of FKDNX vs. as-is FKDNX in Figure 6.
Figure 6: Franklin Dynatech Fund Allocation Could Be Improved
FKDNX vs. Custom Fund Allocation (New Constructs, LLC)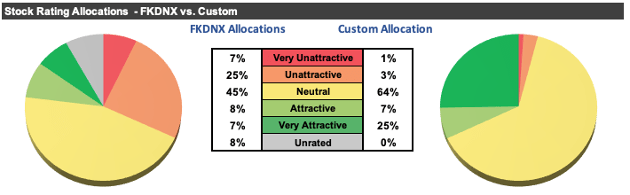
Sources: New Constructs, LLC, company, and mutual fund filings
Better Rated All Cap Growth Funds
Below we present five All Cap Growth ETFs or mutual funds that earn an Attractive-or-better rating, have more than $100 million in assets under management, and have below average TAC.
- Innovator IBD 50 ETF (FFTY) – 0.89% TAC and Very Attractive rating
- Vanguard U.S. Momentum Factor (VFMO) – 0.14% TAC and Attractive rating
- TrimTabs FCF U.S. Quality ETF (TTAC) – 0.65% TAC and Attractive rating
- Delaware Growth Equity Fund (FICIX) – 0.91% TAC and Attractive rating
- Delaware Growth Equity Fund (FICHX) – 1.00% TAC and Attractive rating
This article originally published on March 21, 2022.
Disclosure: David Trainer, Kyle Guske II, and Matt Shuler receive no compensation to write about any specific stock, sector, style, or theme.
Be the first to comment