

alacatr
Introduction
Competition in the automotive industry is fierce. Companies have to constantly come up with new inventions, offer their customers cars with new features and try to surpass their competitors. New shapes, new engine technologies, an increasing number of sensors, new safety and entertainment features all put pressure on profit margins. The current boom in electric vehicles (EVs) is certainly a strong growth driver, but of course comes with high capital expenditures. Therefore, it is not surprising that companies such as General Motors (GM) and Ford (F) typically have operating margins in the mid-single digits and free cash flow is also generally low. In addition, companies with a long history, such as General Motors and Ford, have significant pension-related liabilities on their books and debt is also quite high. The German automotive industry (Volkswagen AG, OTCPK:VWAGY, Mercedes-Benz Group AG, OTCPK:DMLRY and Bayerische Motoren Werke AG, OTCPK:BMWYY) is no different. GM and Ford’s debt-to-equity ratios (total assets to equity) are pretty high at 4.1 and 5.6, respectively. Of course, Tesla (TSLA) is a somewhat different animal in that a veritable cult has formed around its founder, its operations and its valuation. Investors even agreed when the company issued shares, the proceeds of which were used to repay financial debt. Accordingly, the company’s debt-equity ratio is quite low, currently less than 2. Tesla reported its first profit in 2020, so it does not show up on the radar of value investors.
As a cash flow-oriented value investor who prefers to own companies with a wide moat and a relatively asset-light business model, I do not consider the automotive industry worthwhile from an investment perspective. However, I certainly seek exposure to this sector, and would therefore like to draw your attention to Snap-on Inc. (NYSE:SNA), a U.S.-based manufacturer and distributor of predominantly vehicle repair and maintenance tools that operates globally.
In this article, I will highlight key points that qualify Snap-on as a top-tier industrial stock with a highly interesting and surprisingly strong business model. With a current market cap of just over $10 billion, the company typically flies under the radar of many large investors. I think the company is an excellent, low-risk pick to capitalize on the automotive industry and its constant need for invention, improvement and replacement.
During the gold rush, it’s a good time to be in the pick and shovel business – Mark Twain
Snap-on’s Business Model And Its Performance
Snap-on was founded in 1920 and is today best known for its tool distribution via well-stocked vans. Repair shops are visited regularly, thereby creating strong business relationships with a personal note. Over the decades, the company expanded both nationally and internationally, also focusing on critical industries where penalties for failure can be high, such as the oil & gas, medical devices and the aerospace industries.
The company serves its customers primarily through three distribution channels: through its vans, direct sales, and via distributors. Of course, Snap-on’s tools can also be purchased online. Besides the U.S., the van distribution method has been established in several other countries, including Canada, the United Kingdom, Japan, the Netherlands, Germany, and Australia.
Importantly, the company operates its dealer van method as a franchise model. Franchisees buy Snap-on’s products at a discount from suggested list prices and resell them at their own prices. In addition to selling tools through its franchisees, Snap-on also generates revenues by charging franchise fees and by offering financing to its customers.
The company has also grown through acquisitions, acquiring Car-O-Liner Holding AB (Sweden) and Sturtevant Richmont, Norbar Torque Tools, AutoCrib and Dealer-FX (Canada), for example, in recent years.
Snap-on has four reportable business segments. The Tools segment includes hand tools, power tools, and tool storage products. The Diagnostics, Information and Management Systems segment includes handheld and computer-based diagnostic products, service and repair information products, point-of-sale systems, electronic parts catalogs, and warranty management systems. The Equipment segment includes solutions for the service of vehicles and industrial equipment, such as collision repair equipment, wheel alignment equipment, and wheel balancers. The Financial Services segment includes revenues from various financing programs, such as leases with franchisees’ customers and Snap-on customers requiring financing for the purchase or lease of products, as well as business and vehicle loans for franchisees. 2021 segment revenues are shown in Figure 1.
Figure 1: Snap-on’s 2021 segment revenues (own work, based on the company’s 2021 10-K)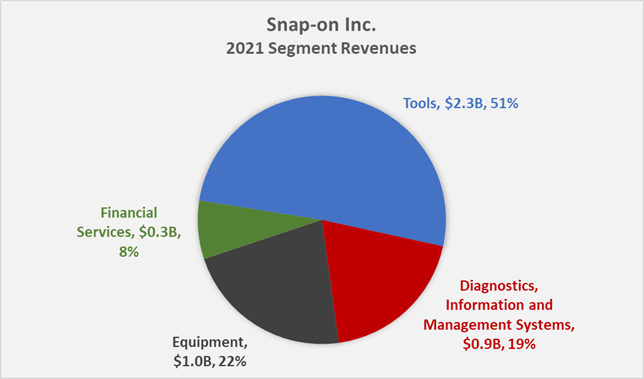
Snap-on is a moderately cyclical company, as shown by its historical net sales performance since 2006 (Figure 2). During the Great Recession, the company reported a top-line decline by 17% YoY and in 2020, the company reported a decline of 4% YoY, which was followed by a strong rebound in 2021. Operating income declined 35% in 2008, indicating that Snap-on has quite high operating leverage, but this is to be expected for a manufacturing industrial company. Since 2006, sales and operating earnings grew at a compound annual growth rate (CAGR) of 3.7% and 13.7%, respectively, indicating that the company has dramatically improved its operations over the past 16 years, including by focusing on its financing business (see below).
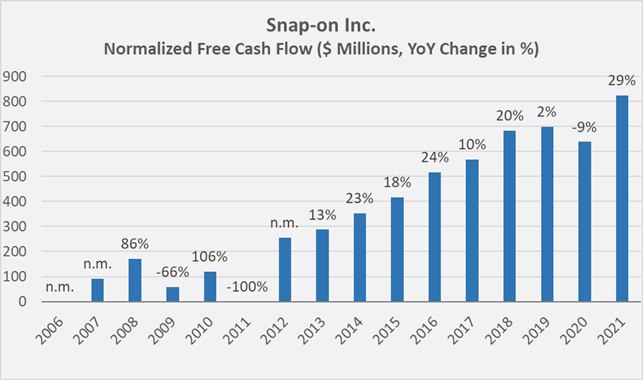
Free cash flow, normalized for share-based compensation, working capital movements, and impairment charges (hardly observed at Snap-on), grew at a similar rate to operating income over the past decade, but was negative in 2006 and 2011. Also, normalized free cash flow ((nFCF)), as illustrated in Figure 3, does not include financing-related cash flows. On a net basis, the company has increased its financing-related receivables every year since at least 2008, but has collected nearly $7.4 billion in financing receivables since that year, compared to total nFCF of $5.6 billion over the same period.
Figure 2: Snap-on’s net sales since 2006, note that financing-related revenues are not included (own work, based on the company’s 2007 to 2021 10-Ks) Figure 3: Snap-on’s normalized free cash flow since 2006; note that cash flows from financing are not included (own work, based on the company’s 2007 to 2021 10-Ks)
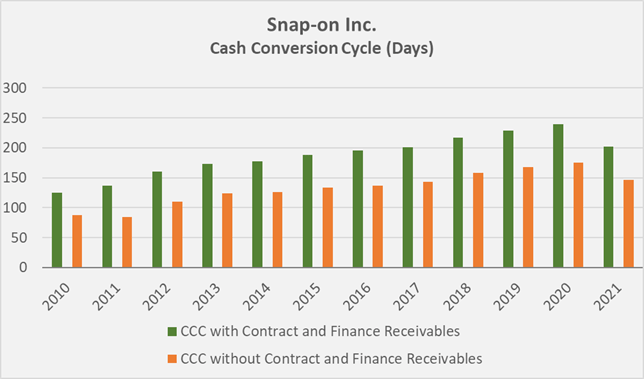
Snap-on’s Cash Conversion Cycle (CCC) has been increasing since at least 2006, while the decline in 2021 is attributed to working capital movements related to ongoing headwinds from the pandemic. The increase in CCC since 2006 is likely due to Snap-on’s increasingly complex product portfolio and acquisition-related expansion (inventory days increased from 78 days in 2006 to 240 and 202 days in 2020 and 2021, respectively), but more importantly to the company’s financing segment, which has been growing at a CAGR of 17% since 2010 (Figure 4). With and without financing-related receivables, Snap-on’s days sales outstanding in 2020 were 133 days and 68 days, respectively, and 112 and 57 days in 2021. Without the company’s additional revenue stream, Snap-on’s CCC would be much lower (175 and 146 days in 2020 and 2021, respectively, Figure 5).
Figure 4: Snap-on’s financing-related revenues and expenses since 2006; (own work, based on the company’s 2007 to 2021 10-Ks) Figure 5: Snap-on’s cash conversion cycle (CCC), with and without contract and finance receivables since 2010; (own work, based on the company’s 2011 to 2021 10-Ks)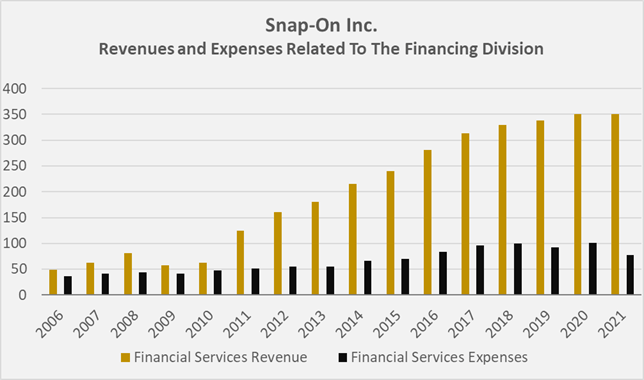
Critical readers might object that an industrial company with a bank-like segment is a recipe for trouble, as General Electric (GE) has proven. However, I would argue that Snap-on is still a relatively small company and therefore easier to manage. Snap-on is still focused on what it does best, and the acquired businesses have been very well integrated. However, the company’s pronounced credit risk, with 2021 financing-related receivables of $542 million short-term and $1.114 billion long-term (24% of total assets), should be kept in mind.
Snap-on is a very profitable company. Gross margin increased from 46% in 2010 to almost 50% in 2021, which I think is a very strong margin for such an industrial company. As mentioned earlier, the company has managed to significantly improve its operations over the past decade, increasing its operating margin from 13% in 2010 (or 17% in 2011) to over 26% in 2021. The company has also performed remarkably in increasing its return on invested capital since the Great Recession, both from a net operating profit after taxes (ROIC) and normalized free cash flow (CROIC) perspective. As shown in Figure 6, the company has managed to generate a significant excess ROIC and CROIC since 2012, i.e., well above the weighted average cost of capital, based on an equity risk premium of 7%. It should be noted that the comparison with WACC is not entirely correct in an academic sense, as profitability ratios based on free cash flow should be compared with cost of equity. However, since SNA is a very conservatively financed company, its WACC is relatively close to its cost of equity. It is also important to add that CROIC does not take into account financing-related cash flows, so it is reasonable to conclude that SNA’s actual return on invested capital is even higher.
Figure 6: Snap-on’s (cash) return on invested capital compared to its weighted average cost of capital, assuming an equity risk premium of 7% (own work, based on the company’s 2007 to 2021 10-Ks)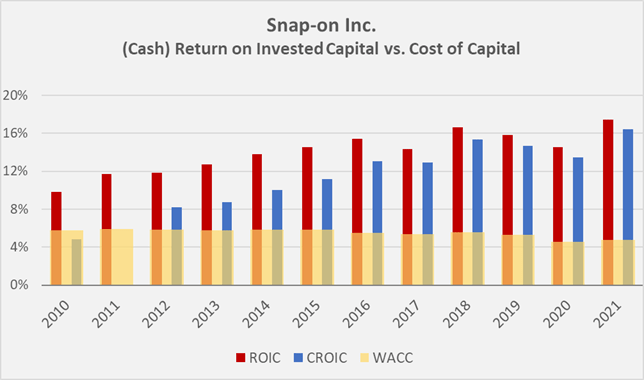
Financial Stability and Dividend Safety
Snap-on is not only very profitable and growing strongly, but also has a very robust balance sheet and a solid dividend history.
The company’s interest coverage ratio, measured by nFCF before interest, has increased from about three times in 2010 to more than 16 times in 2021. The net debt to EBITDA ratio has averaged very close to 1 over the past decade, and in the hypothetical event that the company were to suspend its dividend and share buybacks, it could pay off all of its financial debt in less than a year with its normalized free cash flow.
Of course, the company generated these numbers against the backdrop of a strong economy, and during the next recession, debt could increase and free cash flow will likely decline significantly due to the company’s operating leverage. However, I believe the company is in excellent financial shape and should have no problem increasing its debt or using its existing revolving credit facilities during a recession. The maturity profile of SNA’s long-term debt at year-end 2021 is also very reassuring (Figure 7), as is its long-term debt rating of A- by Standard & Poor’s (p. 43, 2021 10-K). In addition to the $1.18 billion in long-term debt, the company had $170 million in short-term debt outstanding at the end of 2021. Thus, it is relatively well protected against rising interest rates and should even benefit from this scenario due to its financing segment. Of course, such a scenario is also likely to increase loan losses, and SNA will have to form increased reserves accordingly.
Figure 7: Upcoming maturities of Snap-on’s long-term debt at the end of 2021 (own work, based on the company’s 2021 10-K)
As a company with a long-standing history, it could be assumed that SNA carries significant retirement-related liabilities on its books. However, at year-end 2021, these liabilities amounted to only 2% of total liabilities and shareholders’ equity – hardly significant. 21% of the company’s 12,800 employees are represented by unions and/or covered under collective bargaining agreements. In its most recent 10-K, the company notes that there have been no significant work slowdowns, work stoppages or other work disruptions in recent years.
SNA has paid a dividend since 1939 without interruption or reduction (slide 29, Q1 2022 investor overview) but it is not a dividend aristocrat because it did not increase the payout in 2009. Personally, I do not mind if a company does not raise its dividend for a year or two, as long as there are valid reasons to do so. Given SNA’s strong balance sheet, the company probably could have raised its dividend in 2009, but no one could have foreseen the duration of this severe recession in 2008-09. After the Great Recession, the company accelerated its payout to shareholders and has maintained an annual growth rate of over 13% since 2013. The current yield of 2.9% compares very favorably to the long-term average dividend yield of 1.9%. Going forward, it seems reasonable to assume somewhat slower dividend growth as cash flow growth through margin expansion is limited and financing-related revenue growth has slowed in recent years. However, if SNA maintains its sound M&A culture and continues to grow its top-line at a healthy rate, I see no reason why investors in SNA should not be able to continue to beat inflation. It also seems worth noting that Snap-on currently distributes only about 30% of its normalized free cash flow, and that does not include financing-related cash flows. Some of the strong free cash flow goes to share repurchases, which the company has used to more than offset dilution from share-based compensation. The weighted average diluted shares outstanding decreased from 58.4 million in 2010 to 55 million in 2021, increasing earnings per share by 6%.
Valuation
SNA shares have declined from $250 in May 2021, to $200 as of July 13, 2022. According to Seeking Alpha (Table 1), the shares are not a screaming buy. However, with long-term operating earnings growth of 13.7% and a current price-earnings ratio of 13, the PEG ratio (price-earnings divided by growth) is 0.94, indicating a good margin of safety.
Of course, a recession would cut into profits significantly, so waiting for a much higher P/E ratio might actually prove better, as Peter Lynch recommends. During the Great Recession, the stock fell more than 50% from its previous high, so it is reasonable to expect the stock to fall into the $100 range if the recession now widely expected is long and severe. Investors who are unable to ride out such a trough, or who lack the stomach to endure such pronounced volatility, had better not buy SNA at this time.
Table 1: Valuation metrics of SNA (obtained from SNA’s stock quote page on Seeking Alpha)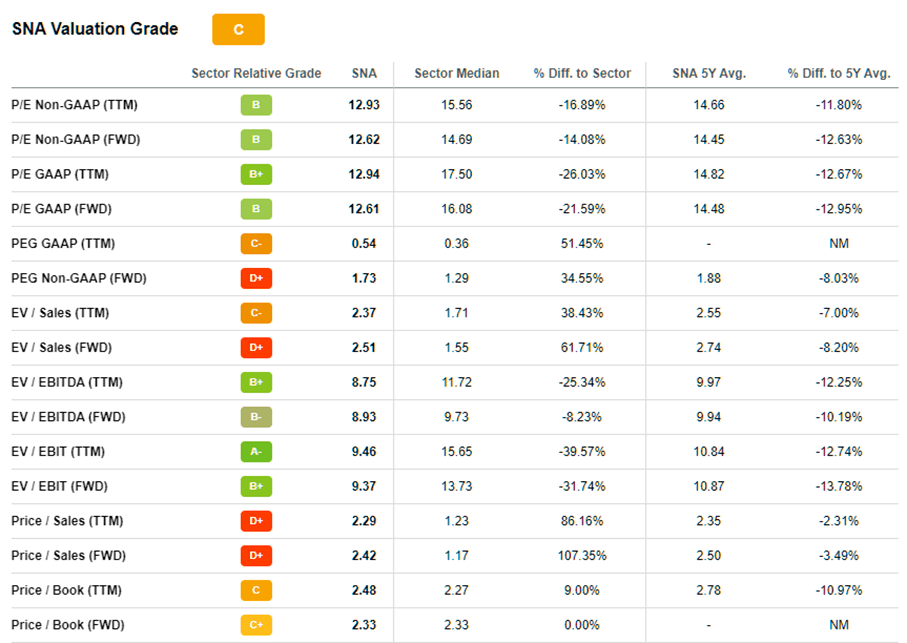
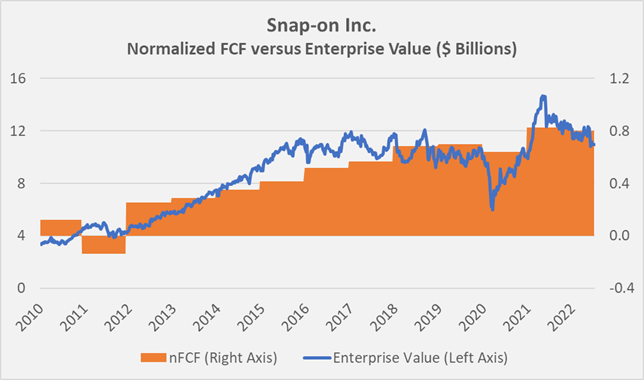
As an income-oriented investor, I think the current dividend yield of almost 3% is very enticing, considering the strong growth record and low payout ratio. From a historical free cash flow perspective (Figure 8), SNA is not a screaming buy, but keep in mind that these cash flows do not include the cash flows associated with Snap-on’s financing division. Figure 9 takes into account Snap-on’s entire capital structure (short- and long-term debt and operating and finance leases) and shows that the stock is currently close to the valuation seen since 2016, with the exception of the pandemic-related drop to $100. Of course, I would have considered SNA overvalued in 2015/16, but the current valuation is a much more reasonable reflection of the underlying cash flows.
Figure 8: Overlay of Snap-on’s share price and normalized free cash flow (nFCF) per share, without taking the company’s financing-related cash flows into account (own work, based on the company’s 2011 to 2021 10-Ks and the weekly closing share price of SNA) Figure 9: Overlay of Snap-on’s enterprise value and normalized free cash flow (nFCF), without taking the company’s financing-related cash flows into account (own work, based on the company’s 2011 to 2021 10-Ks and the weekly closing share price of SNA)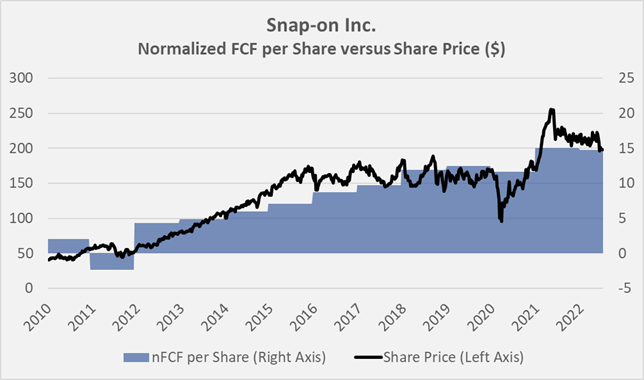
In conclusion, and given the consistency of Snap-on’s earnings, a look at the stock’s long-term root mean squared deviation (RMSD) chart is warranted. Figure 10 shows that the stock is currently fairly valued relative to its 30-year trend line. However, it should be remembered that Snap-on’s financing segment saw most of its growth after the Great Recession. Therefore, a 15-year RMSD chart appears more meaningful, but the current -1 RMSD deviation should not be over-interpreted given the uncertainties surrounding the continuation of the strong growth performance (Figure 11).
Figure 10: SNA’s 30-year root mean squared deviation (RMSD) chart (own work, based on SNA’s weekly adjusted closing price)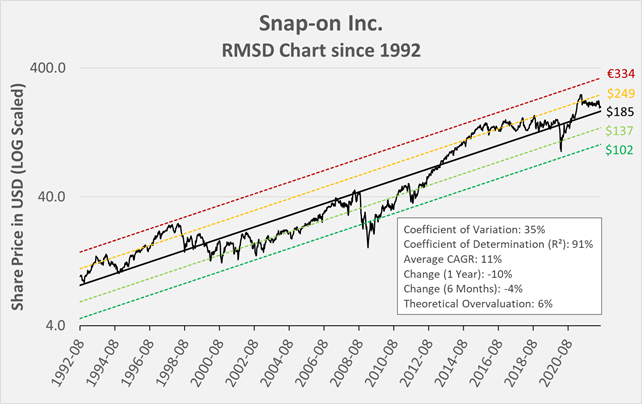
Conclusion
Snap-on is a very well run and highly profitable company with a very solid balance sheet. It is moderately cyclical, and a significant part of its revenues are closely correlated to the number of vehicles and their age. Management thinks that the service-related growth trend remains intact, as the U.S. vehicle parc at the end of 2021 amounted to 280.5 million, whereas the average vehicle age increased from 9.5 years in 2001 to 12.1 years in 2021 (slide 9, Q1 2022 investor overview). The trend towards EVs could work against the company’s service-related sales in the short term, but it can also be argued that during times of high inflation and reduced discretionary income, fewer people can afford a new vehicle, which benefits SNA’s repair and service portfolio. The company has pricing power, which it maintains through strong customer relationships thanks to its unique business model. On the other hand, the company’s OEM-related revenues are benefiting from new car sales, so the EV boom should generally be seen as a tailwind for SNA. Also, new drivetrains and an ever-increasing vehicle complexity create needs for new solutions. Finally, the company’s in-shop management systems aid car dealers and repair shops in improving their productivity, an issue that should not be underestimated.
Overall, I believe that Snap-on investors are on the winning side in the long term and that the shares offer a low-risk exposure to the automotive industry, in contrast to capital-intense manufacturers like GM, Tesla, or Ford. Investors should look past the currently languishing share price, not fear a continuation of the sell-off, and instead focus on the dividend and its growth. Snap-on is a classic example of a great company to own for the long term, but when buying, an emphasis should be put on cycle lows (which are arguably nearly impossible to time). I think the valuation is good enough to warrant a starting position, and I will therefore place an order shortly. However, given that this stock could suffer significant losses during a recession, I plan to build my position without haste, similar to my position in Stanley Black & Decker (SWK), see my recent article which explains my reasoning).
Thank you very much for taking the time to read my article. In case of any questions or comments, I’m very happy to read from you in the comments section below.
Be the first to comment