

Bill Pugliano/Getty Images News
Thesis
Mohnish Pabrai openly admits that, in terms of investment style, he’s a copycat of Warren Buffett. In his book, The Dhandho Investor, he actually promoted the idea of copycatting both in business and in investment: it is a good idea, instead of a bad one. Besides copycatting, another key principle that he promotes involves pushing value investing to the extreme: look for stocks with 1x PE. He dubbed this to be one of his 10 investment commandments (slightly edited by me):
It is best to look for stocks based on future earnings or hidden earnings that are trading at a 1x multiple. When you can buy at this valuation, good things tend to happen. Looking for the hidden PE is a really good exercise.
Of course, it is difficult to find such stocks, especially after a long bull market. However, in highly cyclical sectors such as the auto sector, there are some stocks that are getting close. As a matter of fact, one of Pabrai’s successful 1x PE cases was made on an auto stock, Fiat Chrysler. More specifically,
Pabrai says when he bought Fiat Chrysler, it was trading at less than $5 a share and the company had forecast by 2018 it would be making about $5 a share. In 2016 it spun off Ferrari, but including that it exceeded the forecast number. The PE of 1x materialized and the investment increased by 7 to 8 times in that time.
This leads to the thesis of this article. The thesis is twofold. First, you will see that recent market corrections have brought the PE of both Ford (NYSE:F) and General Motors (NYSE:GM) to the low-single-digits. It is getting close to the 1x PE bet that Pabrai promotes when future “hidden” earnings are considered. Second, you will see why after digging a bit deeper, we think F is a much better fit for the 1x PE commandment than GM (and that is why we actually hold F, not GM).
As seen from the chart below, both F and GM are currently trading in the single-digit PE. F is priced at 4.14x PE on a TTM basis and GM at 6.66x. On an FY basis, F is trading at 5.87x and GM 5.12x. These valuations are quite low, but still above 1x by quite a bit. And next, we will see that their true PEs are lower when their CAPEX expenditures are correctly interpreted.
Seeking Alpha Data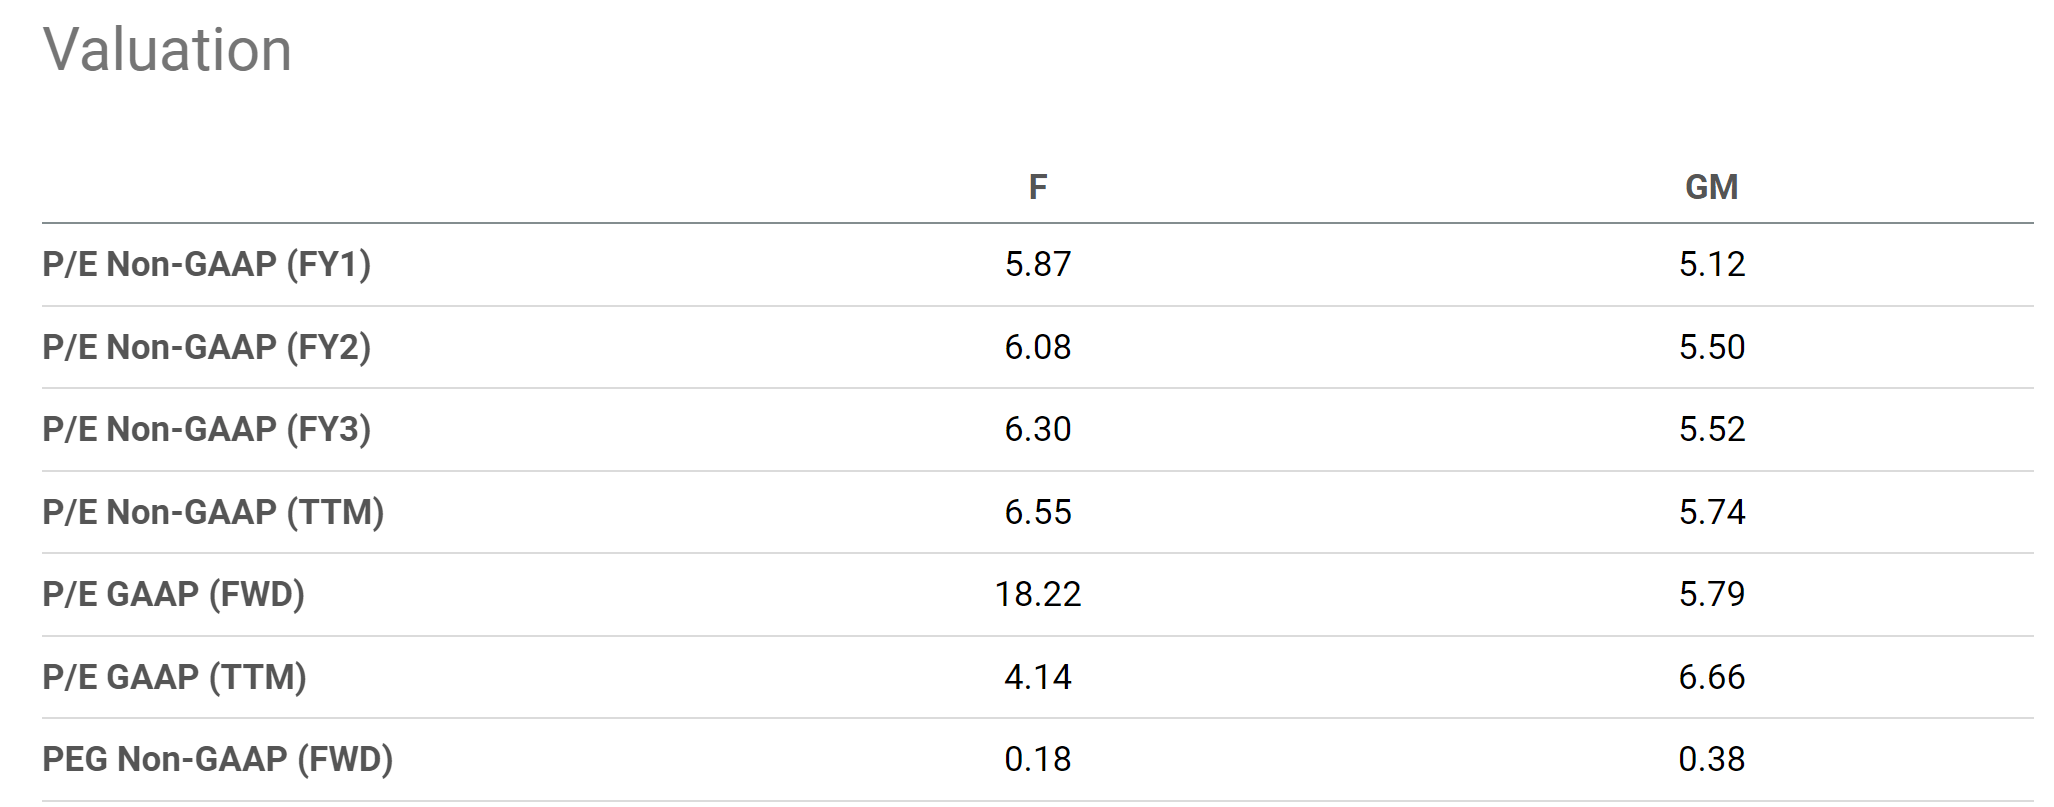
Accounting earnings vs. owners’ earnings
The auto sector is notorious for its heavy CAPEX investment requirements. F and GM are no exception. For businesses that incur sizable CAEPX expenses, the accounting earnings may underestimate the true economic earnings, as detailed in my earlier article,
- The key of interpreting owners earnings is to decompose the CAEPX expenses into two parts: the maintenance CAPEX and growth CAPEX. Maintenance CAPEX is the mandatory part to keep the business running. And the growth CAPEX is the optional part. The growth part should actually be considered part of the owners’ earnings because it can be returned to the owners if the owners decide not to grow the business anymore – a key insight that investors like Buffett have recognized.
- Under this background, the following chart shows my analyses to delineate the maintenance CAPEX and growth CAPEX of F. This analysis is performed by Bruce Greenwald’s method. Readers interested in more details could take a look at my earlier article on AAPL and/or Greenwald’s book entitled Value Investing.
The figure below shows F’s OE (i.e., owners’ earnings or its true economic earnings) compared to its accounting earnings (i.e., EPS). The chart shows that F’s OE has been consistently above its accounting EPS over the years. Actually, its OE has also been quite consistent and stable despite the cyclical behavior exhibited in its EPS. As you can see from the chart, it suffered negative accounting earnings in 2018 and 2019. However, once the growth CAPEX expenditures are adjusted, its OE has been positive and quite stable even during those two years.
To wit, its economic earnings in recent years have been on average $2.6 per share, which is almost 1.73x above its EPS. Consequently, this makes its valuation lower than on the surface. Its PE ratio based on economic earnings would be 2.34x at its current price level (obtained by dividing the 4.14x PE on GAAP TTM by 1.73), a lot closer to the 1x PE that Pabrai looks for.
Author Based on Seeking Alpha Data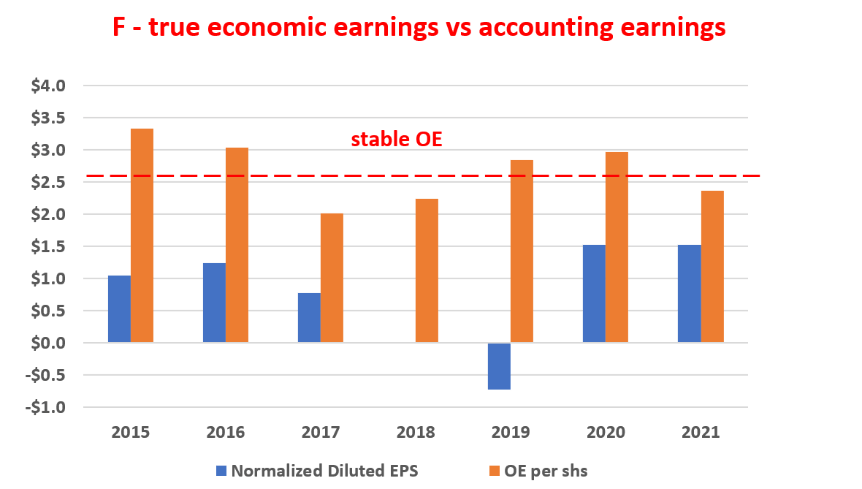
GM’s owners’ earnings
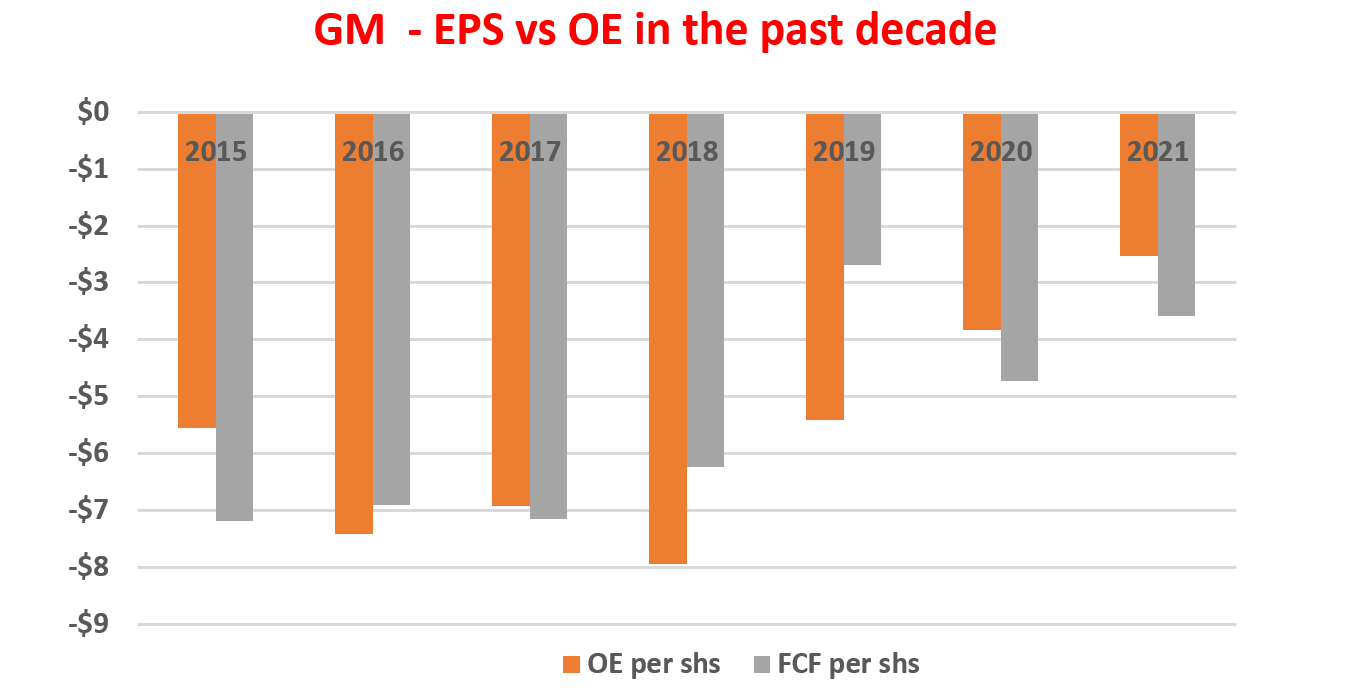
In contrast, the picture for GM is less attractive when the OE is considered. The figure below shows the FCF (free cash flow) per share for F and GM. As seen, GM currently (and historically also) suffers a negative free cash flow (something you probably already know very well). It is currently losing $3.58 per share of FCF. In contrast, F has been earning a positive FCF over the years. Its FCF hovers around about $1.48 per share. Recall that its OE is on average $2.6 per share. So, in F’s case, the FCF also underestimates its true earnings power (by about 75%).
The second chart below shows the OE analysis for GM, using the same Greenwald method used above for F. As you can see, the adjustment of the growth CAPEX indeed improves the picture for GM. GM has been spending about $1.4 billion per year on growth CAPEX on average in the past two years, translating into about $1.00 per share. When the growth CAPEX is added back into the cash flow, GM’s FCF became less negative than its accounting cash flow. However, it’s still negative. In terms of EPS, the adjustment of growth CAPEX would make the OE about 20% higher than its accounting earnings. Therefore, its PE based on OE would be about 5.55x (obtained by dividing the 6.66x PE on GAAP TTM by 1.20), still far above the 1x PE that Pabrai promotes.
And the above are the key considerations to make us like Ford much better than GM even though their accounting PE multiples are similar on the surface. Of course, different investors could make different arguments here involving the different business structures between F and GM (e.g., the role of GM’s financing arm). For us, our investment style prefers positive cash flow, consistent cash flow, and high owners’ earning yield.
Seeking Alpha Data Author Based on Seeking Alpha Data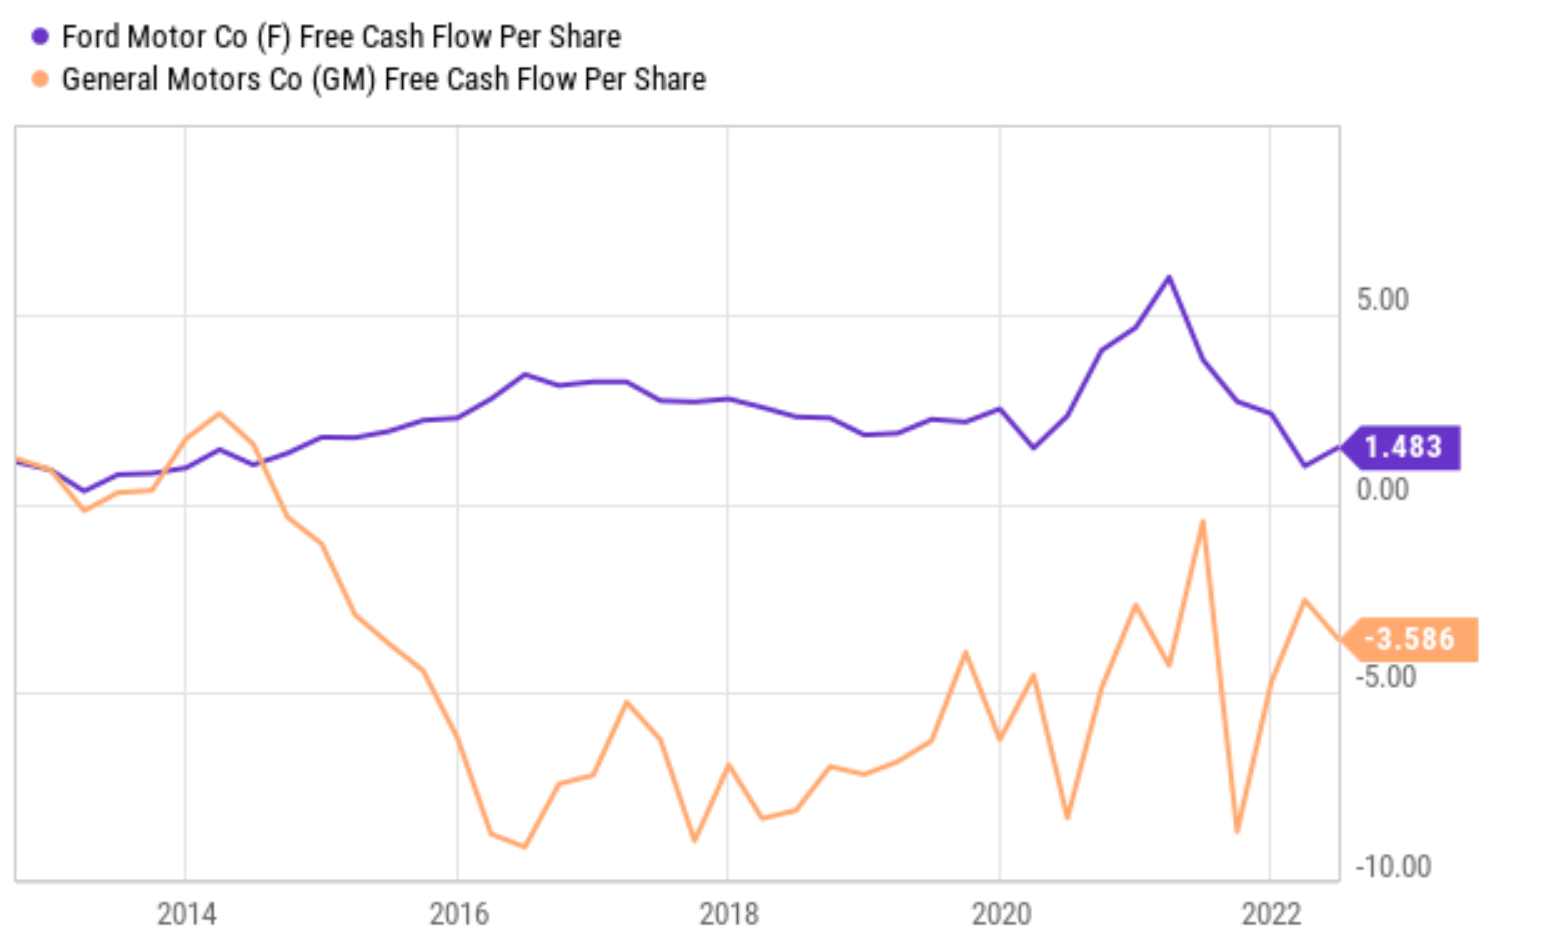
Business outlook
Another reason, a secondary reason, we like F better is the better growth prospects (as you can see from the following consensus estimates). To be sure, both F and GM will have their fair share of challenges in the near future, and we will detail these challenges in the final risk section.
On the positive side, F’s revenues for Q2 saw a spectacular growth of almost 50% YoY to $40.2 billion. A good part of this was driven by a 35% year-over-year improvement in wholesale volumes, a favorable pricing environment, and a mix weighted toward higher-profit offerings. All told, consensus estimates project a 7% annual growth rate in the next few years. By 2026, its EPS is projected to reach about $2.7. I tend to agree with such estimates, given its healthy ROCE and reinvestment rates.
Author Based on Seeking Alpha Data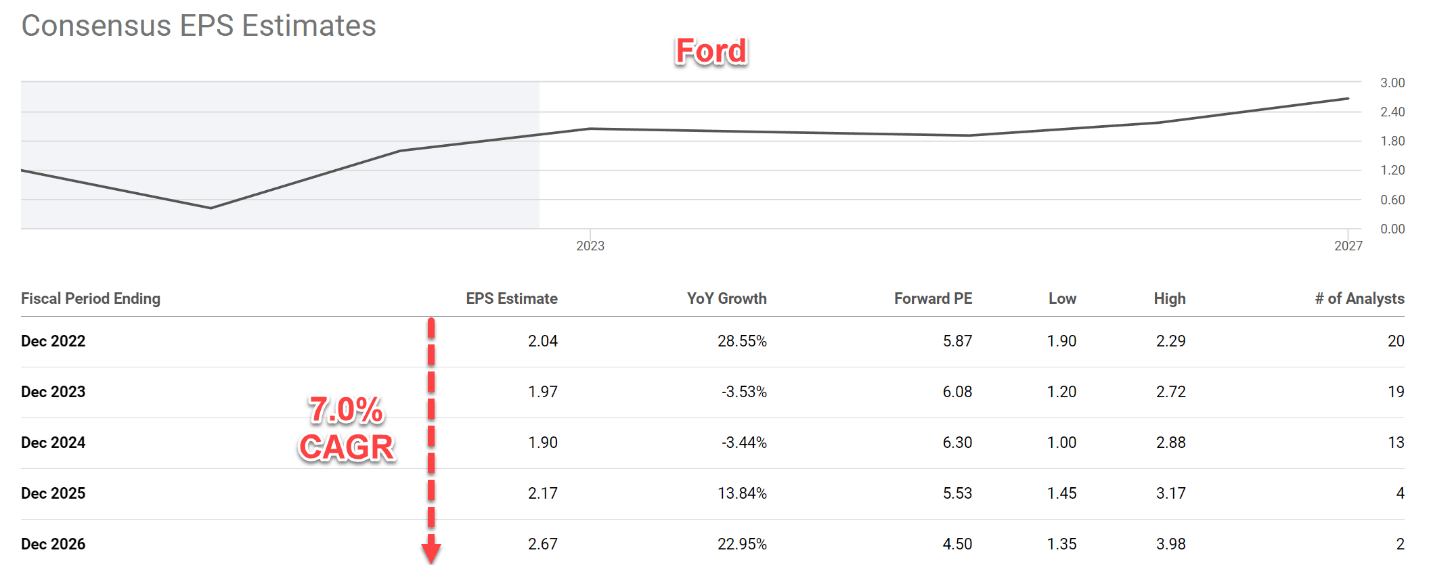
The growth projection for GM is only about 1.1% CAGR from consensus estimates. I think such a projection is too pessimistic for GM. Although I do agree with the consensus that GM’s growth rate would be somewhat lower than F in the next few years. Given its ROCE and reinvestment rates, my projection for its growth rate is in the mid-single digits, say 4%~5%. GM’s sales also enjoyed some growth drivers in the recent past, including higher pricing, lower incentive spending, and a focus on high-demand, higher-margin products. Furthermore, demand remains robust for its products, particularly for its solid lineup of pickups and SUVs. I expect these positive catalysts to remain in the coming quarters.
Author Based on Seeking Alpha Data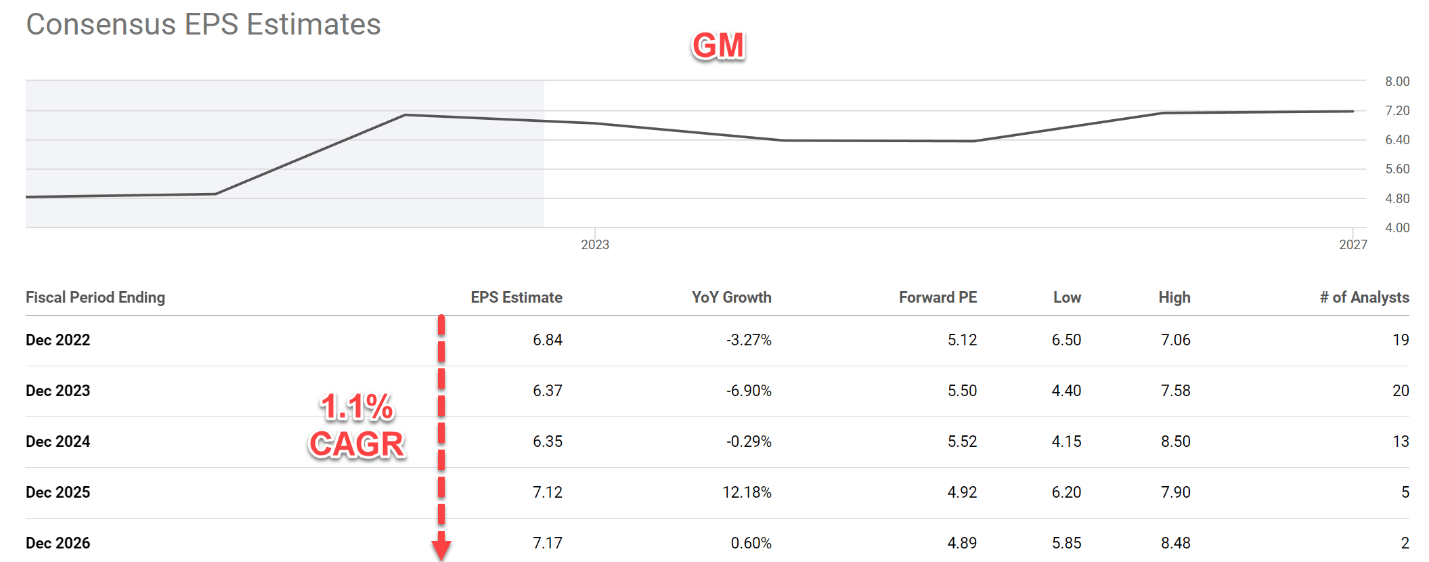
Risks and final thoughts
Both F and GM face considerable challenges in the near future. Both will continue to deal with supply-chain disruptions, the continued shortage of semiconductor chips, as well as other operational hurdles. Specifically, F is dealing with rising costs. Cost of sales increased by more than $10 billion versus last year, to $33.2 billion, largely due to inflation. Going forward, I expect such inflationary pressures to persist in the coming quarters. Also, F suffered a large loss (about a $2.4 billion mark-to-market loss during the past reporting period) on its investment in Rivian (RIVN). Rivian share prices have dropped more than 60% in value so far this year. And F’s remaining holders could face further losses. And GM has been facing cost pressures too. It suffered a 7% increase in the cost of sales and general & administrative expenses during the past quarter. Furthermore, there was a 10% rise in GM’s Financial expenses, to $2.1 billion. I expect pressures on both fronts to continue, given the persistent inflation and the expected hikes in interest rates. GM is dealing with these pressures by cutting back on discretionary spending and its hiring plan. Its current plan is restricted to hiring only for critical positions and those that support growth.
To conclude, highly cyclical sectors such as the auto sector are promising places to look for stocks with a 1x PE. And a notable example is Pabrai’s successful investment in Fiat Chrysler around 2016. In today’s market, recent corrections have brought the PE of both F and GM to the low-single digits. Once adjusted for their growth CAPEX, their true PEs based on owners’ earnings are even lower. To wit, F’s PE ratio based on economic earnings would be ~2.3x (compared to 4.1x PE on GAAP TTM basis). And GM’s PE based on OE would be about 5.5x (compared to 6.7x PE on GAAP TTM). When future earnings growth is considered, both are getting close to the 1x PE deal that Pabrai promotes (especially in the case of F).
Be the first to comment