

fotokostic/iStock via Getty Images
Introduction
It’s time to talk about one of the largest agriculture companies on the market. The Philadelphia, Pennsylvania, based FMC Corporation (NYSE:FMC) is one of the world’s largest chemical companies with a focus on agriculture crop protection, plant health, precision agriculture, and professional pest and turf management products. In other words, in a world where agriculture input materials are in a massive bull market, it’s the place to be. The company’s financials are rapidly improving, which is set to fuel the company’s already impressive dividend growth streak. In this article, I invite you to join me in taking a deeper dive as I explain how I would deal with this from a dividend (growth) point of view.
The Agriculture Bull Market
“How did that happen?” is what I keep asking myself, referring to the fact that I have never covered the FMC Corporation on Seeking Alpha, or anywhere else. After all, the agriculture bull market has been “my” thing since the early days of the pandemic when I started researching the agriculture trade.
Back in 2020, the bull thesis started rather simple as it was based on an end of lockdowns, higher energy, and food demand, and the impact this would have on what had been severely beaten down crop prices back then.
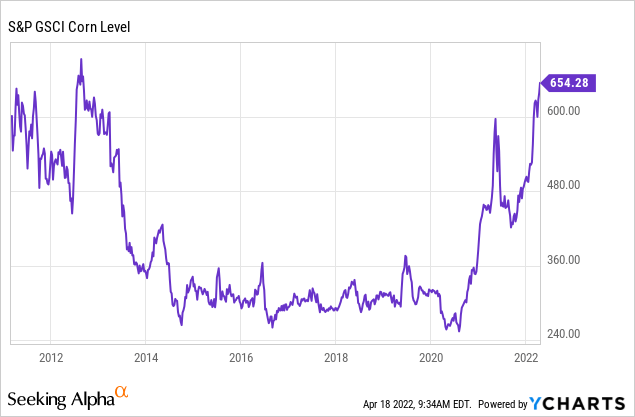
Demand was stimulated by high import demand from China, a rebound in ethanol production, higher meat production, and better margins. Then, in 2021, the energy crisis started to unfold as global oil demand/supply started to be impacted by a still ongoing imbalance. Also, 2021 was the year when Russia started to reduce energy exports to Europe, creating a situation that got only worse this year as energy prices were so high that i.e., fertilizer producers had to shut production. Additionally, because of the invasion of Ukraine, wheat and key crops in vegetable oil production are seeing shortages as well.
Now, we’re dealing with high crop, fertilizer, and related input prices. FMC investors have been in a good place this year – and prior to that. This year, the stock has advanced roughly 25%. The performance is +50% over the past six months.
FINVIZ
So, what does FMC actually do, and what does that mean for existing and new shareholders?
There’s Value In FMC
As I already briefly said, FMC produces agriculture input products like pesticides.
According to the company,
FMC Corporation is a global agricultural sciences company dedicated to helping growers produce food, feed, fiber and fuel for an expanding world population while adapting to a changing environment. FMC’s innovative crop protection solutions – including biologicals, crop nutrition, digital and precision agriculture – enable growers, crop advisers and turf and pest management professionals to address their toughest challenges economically without compromising safety or the environment. FMC is committed to discovering new herbicide, insecticide and fungicide active ingredients, product formulations and pioneering technologies that are consistently better for the planet.
With a market cap of $17.4 billion, FMC is the fourth-largest US stock-listed agricultural inputs company behind Corteva (CTVA), Mosaic (MOS), and CF Industries (CF).
The company has a well-balanced sales breakdown – both regional and by product category. The company has significant exposure in all areas of the world: Asia, North America, EMEA, and Latin America. 60% of its 2021 sales were provided by insecticides. These chemicals are formulated to kill, harm, repel, or mitigate one or more species of insects. This includes all crops imaginable from soybeans and corn to rice and sugarcane.
FMC Corp. (SEC 2021 10-K)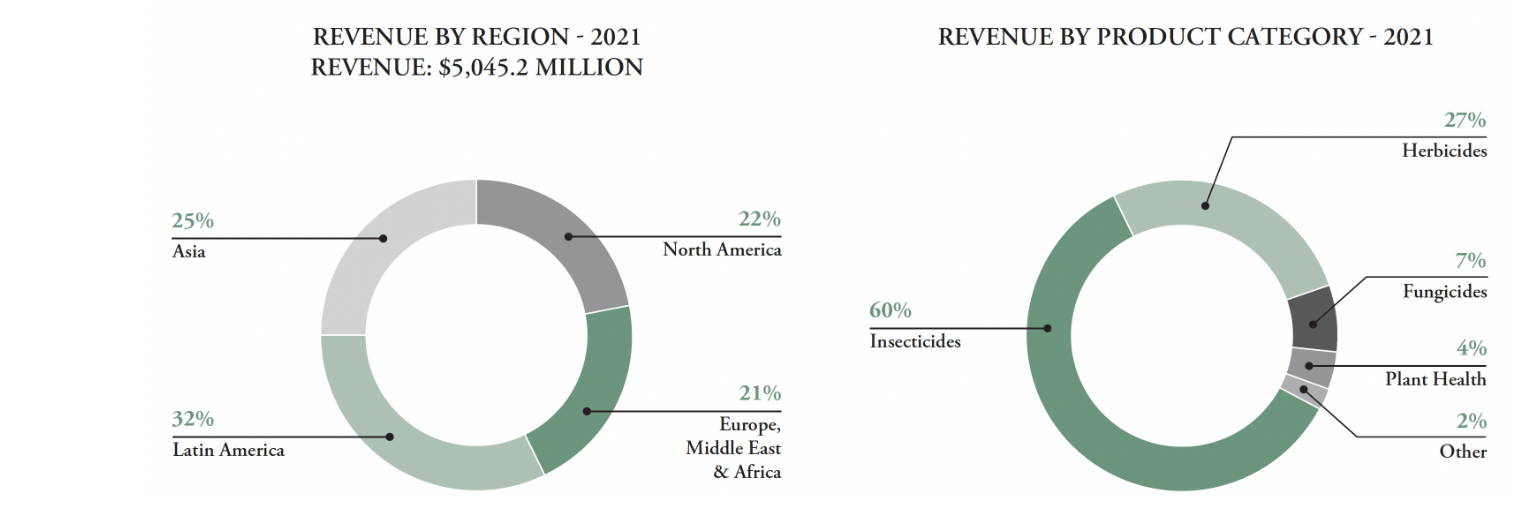
Because these chemicals are not *that* great for the environment in all cases, a risk is that countries “force” farmers to go organic. However, and to keep this short, it’s not a risk that keeps me up at night. The global need for food production has never been higher and these chemicals can be applied in a responsible manner. There are bigger risks to the environment than FMC’s products.
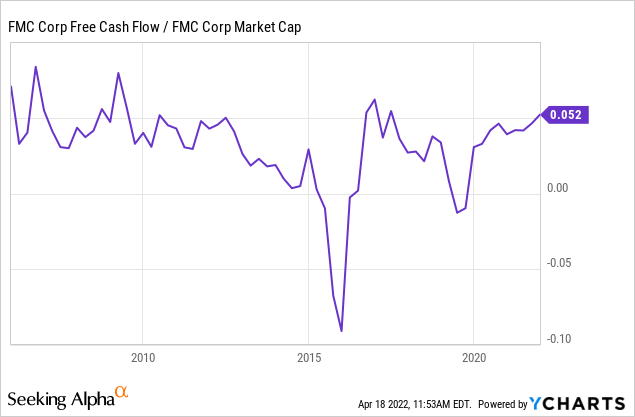
In the case of FMC, we do not see a big surge in its EBITDA or free cash flow, similar to other agricultural chemical companies. Right now, it’s mainly fertilizer companies who are surging as margins in the industry are exploding. This is not happening in the case of FMC, which is OK. FMC is also reporting long-term growth in its EBITDA and free cash flow. In 2018, for example, the company did $1.3 billion in adjusted EBITDA and roughly $290 million in free cash flow. Now, EBITDA is expected to end the year at $1.43 billion with free cash flow exceeding $720 million. In 2024, analysts expect the company to do close to $1.7 billion in EBITDA with free cash flow crossing the $1.0 billion mark for the first time ever.
TIKR.com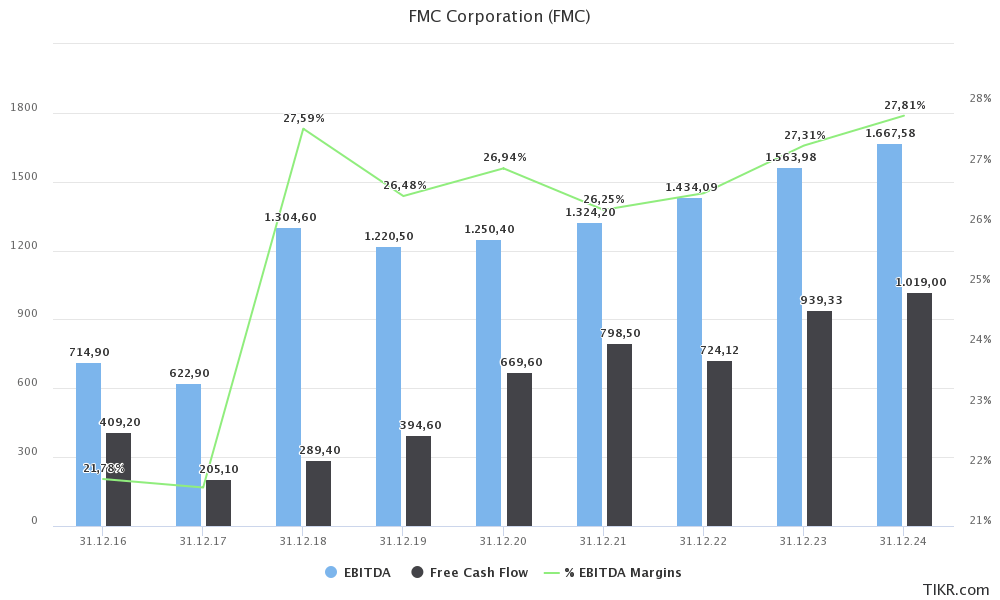
In order to give you an idea of how much value this company generates, we’re using the $17.4 billion market cap and $940 million in 2023 expected free cash flow. This gives us an implied free cash flow yield of 5.4%, which isn’t a blowout number, but it’s one of the highest in the company’s history.
Additionally, bear in mind that free cash flow is basically net income adjusted for non-cash operating items and capital expenditures. It’s cash a company can use to distribute a dividend, buy back shares, or lower total debt.
Right now, FMC investors enjoy a $0.53 quarterly dividend after the most recent hike of 10.4% on December 16, 2021. This translates to a $2.12 annual dividend and a 1.5% yield based on a $140 stock price.
If the company were to spend all of its free cash flow on dividends, the yield would exceed 5.0%. That’s not happening of course, but it gives you an idea of what FMC is capable of.
Based on this context, the Seeking Alpha dividend scorecard for FMC looks good. Dividend safety is high, and so is dividend growth. The dividend yield, however, is a big fat D+. In this case, 1.5% is not a lot, but the score is also low because it’s compared to the materials sector. A lot of companies in this sector have high yields, which makes 1.5% pale in comparison.
Seeking Alpha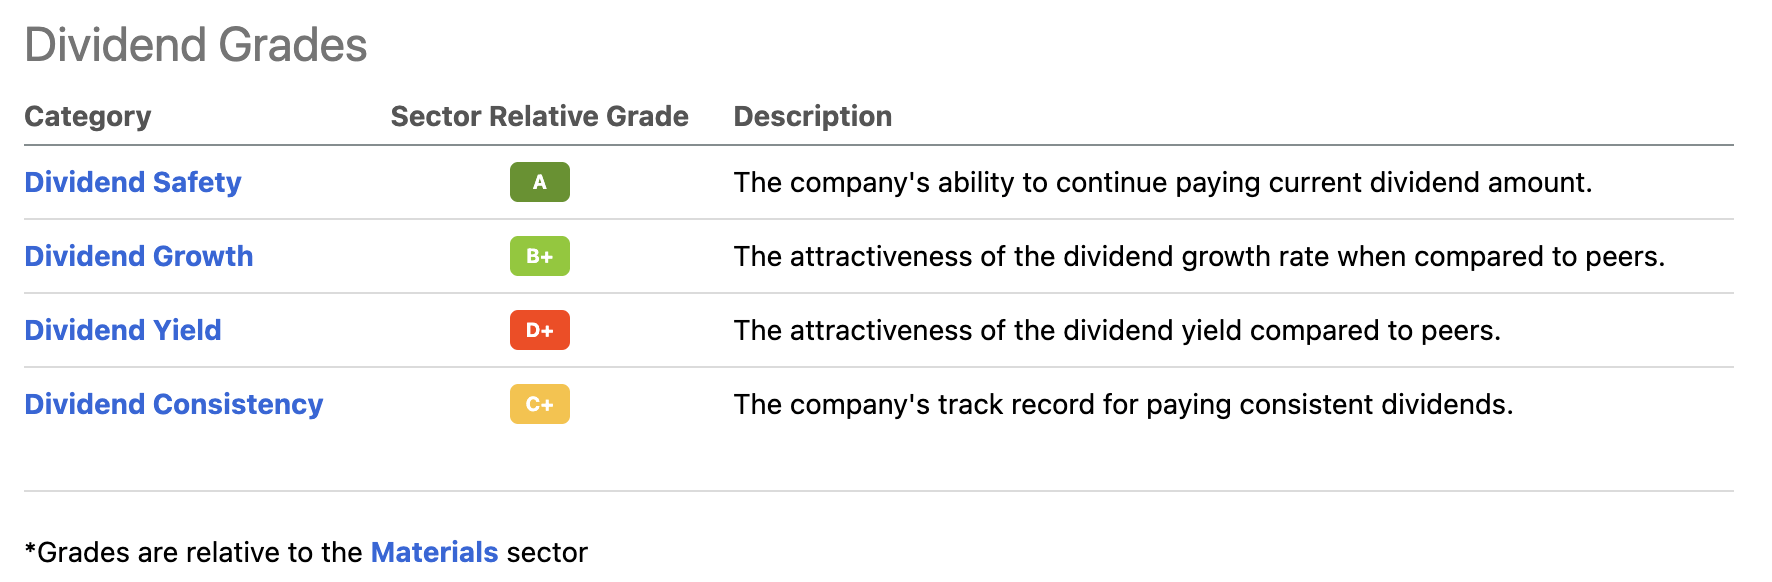
With that said, I agree that the two things that “bother” me are the yield and dividend consistency. FMC is not the kind of stock you want when you’re looking for consistent and somewhat predictable hikes. For example, investors benefited from strong double-digit hikes prior to 2016. Then, the dividend remained unchanged for three years. After that, it accelerated from $0.66 per year to $1.97 in less than 5 years. Between 2012 and 2021, the dividend has been hiked by 17% per year, on average. The most recent hike took place on December 16, 2021, when the company hiked by 10.4%.
TIKR.com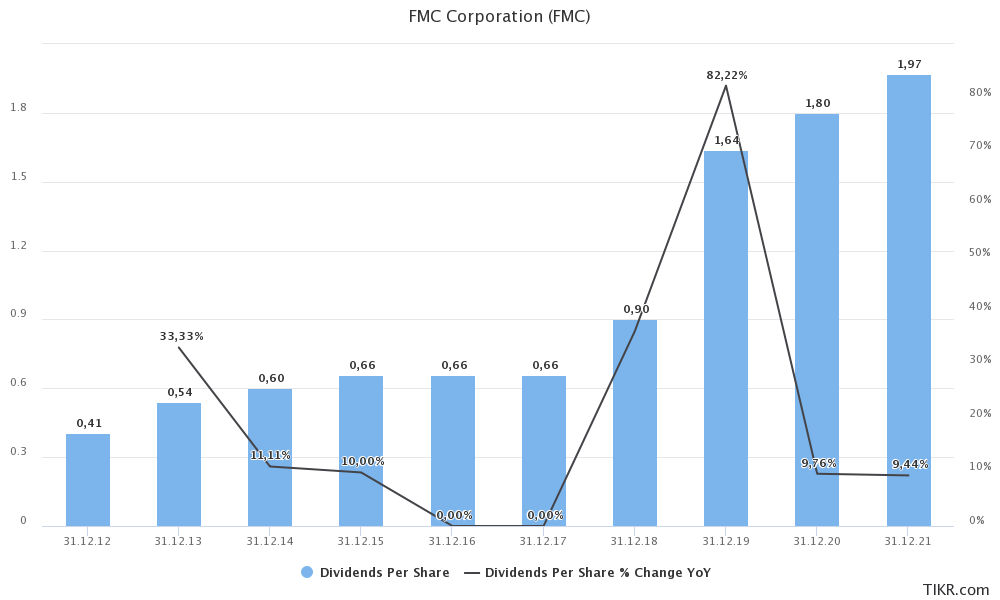
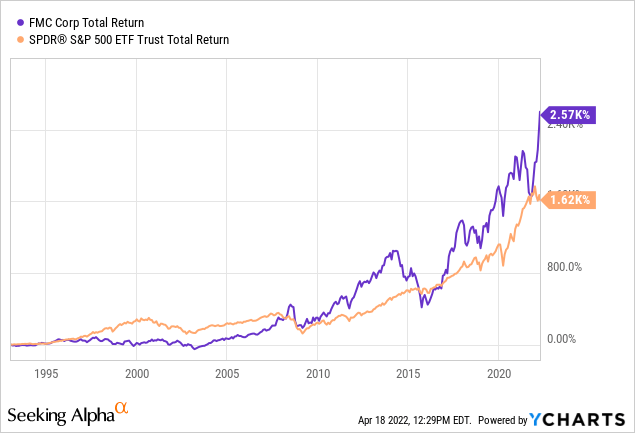
The dividend has helped the company to outperform the market. Since the early 1990s, investors have enjoyed 2,570% in total returns (including dividends). This is well above the (also impressive) 1,620% total return S&P 500 index investors got.
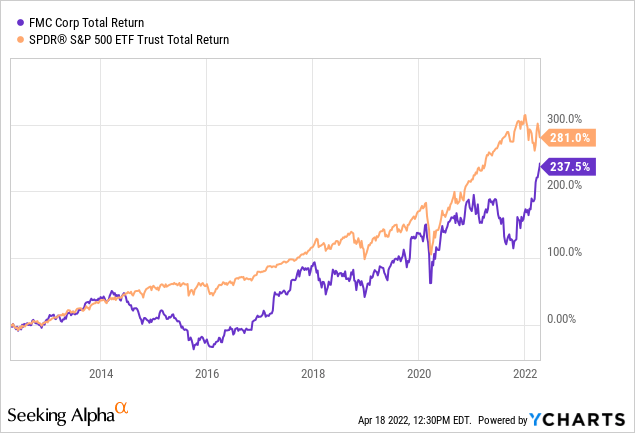
Reducing the time horizon to 10 years, we see that investors have enjoyed 238% in total gains. This is below the 281% return S&P 500 investors enjoyed. In this case, the underperformance is based on a somewhat significant drawdown between 2014 and early 2016 when the world entered a manufacturing recession that hurt basic materials as well. Oil and other commodities fell, causing most basic material companies to suffer from low margins.
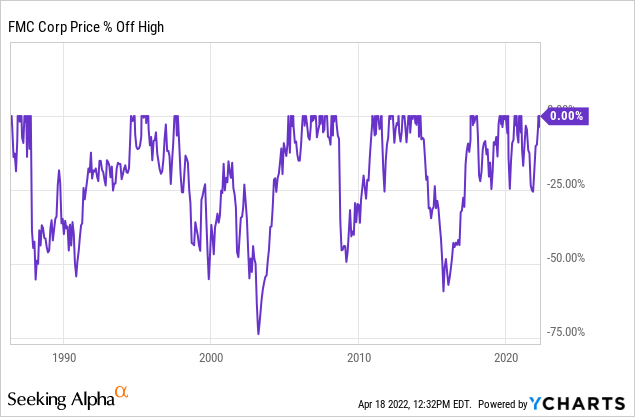
The next chart shows the company’s historic drawdowns. I believe that it’s on a monthly closing basis, which explains why the 2020 sell-off isn’t clearly visible. Back then, the stock lost roughly 48% between the highest pre-pandemic price and the lowest price during the pandemic sell-off.
Either way, what this tells us is that 25% drawdowns are very common with more pain during bigger recessions when commodity prices start to fall, too.
You may have guessed where I’m going with this, but these drawdowns mean that adjusted for volatility, investors were better off buying an index fund. Since the early 1990s, FMC has outperformed the S&P 500 by a big margin, yet, the Sharpe Ratio is much lower as the standard deviation is almost twice as high. It does not mean that FMC is a worse investment – after all, it outperformed – but it’s not great for people who like to avoid volatility.
Portfolio Visualizer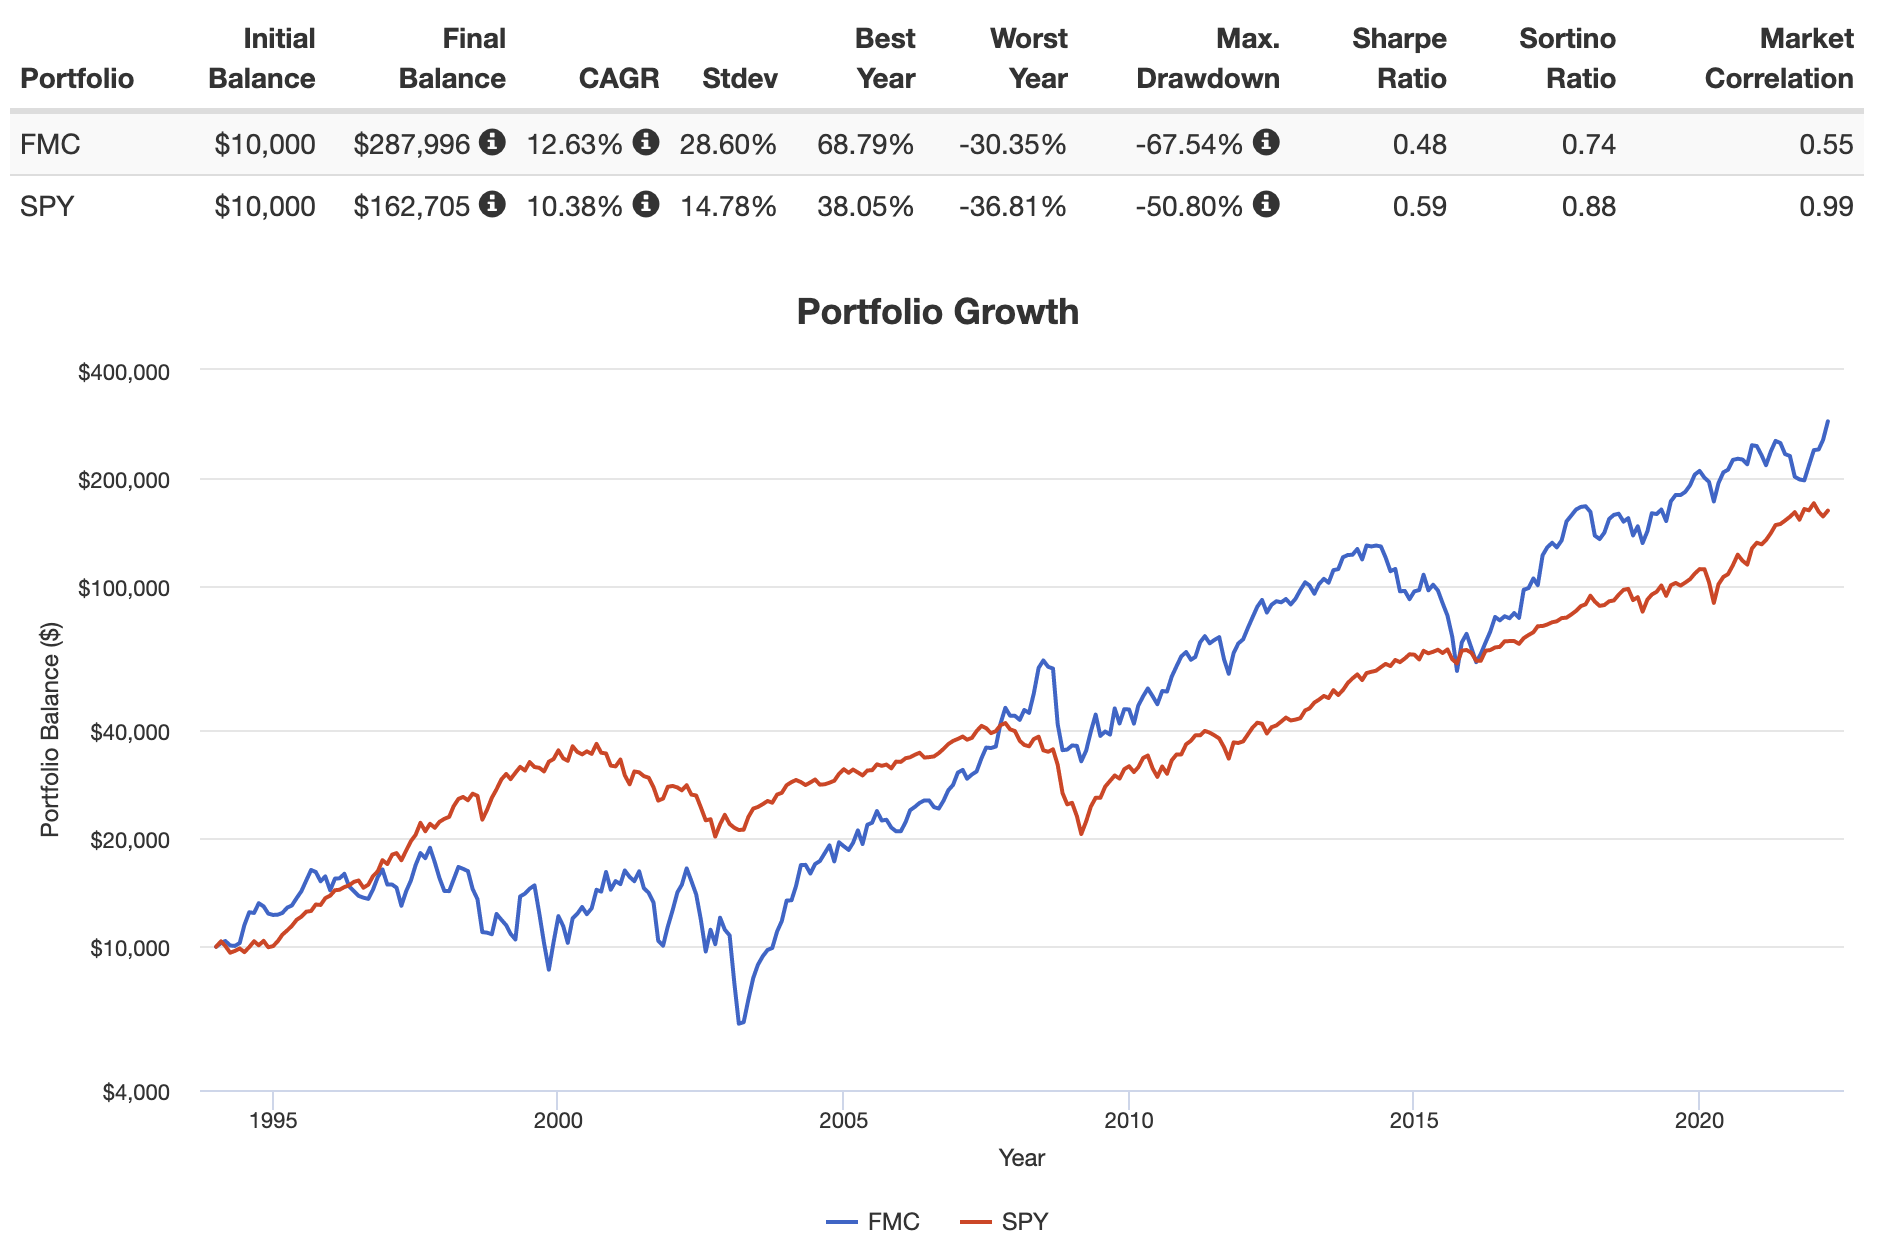
So, what about the valuation?
Valuation
This year, FMC is expected to do up to $1.48 billion in adjusted EBITDA according to the company. Analysts seem to be positive that this is indeed possible. This assumption is based on strong volume growth across the entire FMC portfolio, support from better pricing, new products, and biologicals supporting secular growth, and the ability to offset rising input costs. This assumption also includes mid-to-high single-digit price increases and easing cost headwinds. The company’s base case is $1.4 billion in EBITDA. It expects to do $1.32 billion in a scenario where demand weakness hits the market, which I do not expect this year.
TIKR.com
One part of the valuation has already been completed when I calculated the implied free cash flow yield of more than 5%. That number showed us that investors are not overpaying to get access to free cash flow, which is absolutely key.
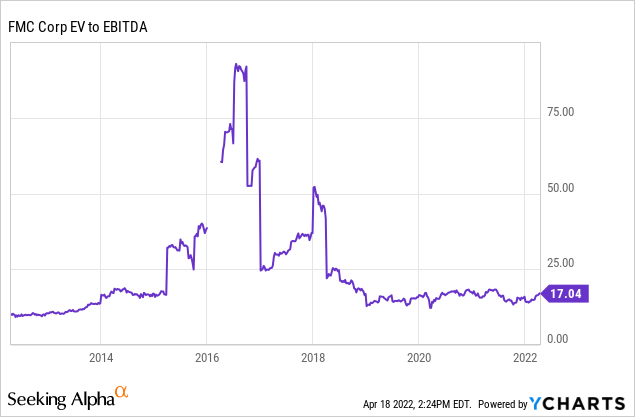
EV/EBITDA multiples are also valuable as they incorporate debt. In this case, we’re using the $17.4 billion market cap again. In addition to that, we need net debt, which is basically gross debt minus cash. In the case of FMC, net debt is expected to remain close to $2.7 billion in the years ahead. I expect that it ends the 2024 year well below $2.6 billion due to high free cash flow (roughly 1.4x expected EBITDA), but I’m sticking with this number for now. Also, I’m neglecting minority interest and pension-related liabilities, which don’t even make it to $70 million combined.
TIKR.com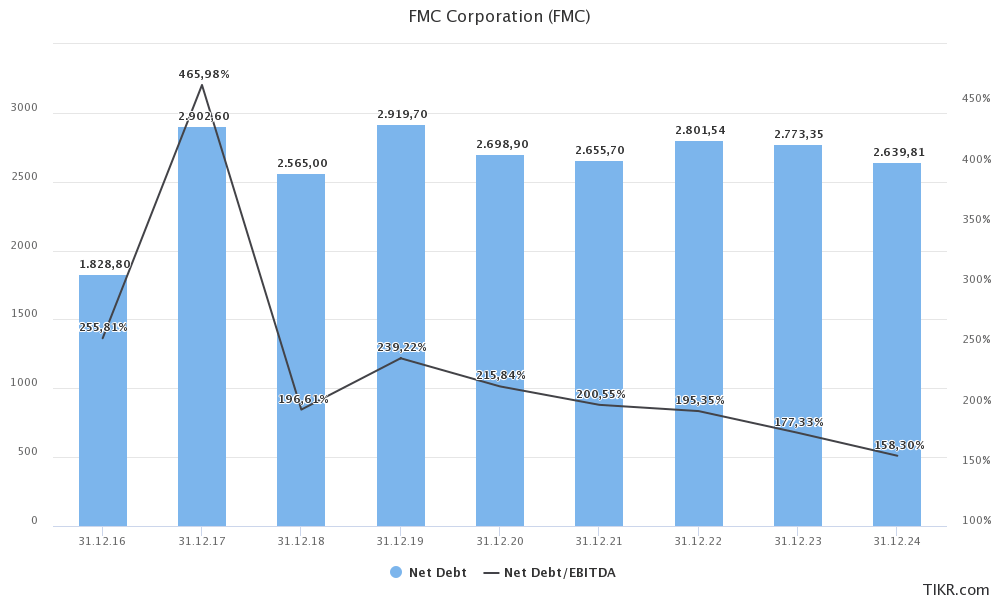
In this case, we get a total enterprise value of $20.1 billion. This is 12.6x 2023 expected EBITDA of $1.6 billion. This valuation is fair – just like the implied free cash flow yield.
Hence, I believe that the stock should have room to run to $140-$150.
Takeaway
In this article, I discussed the Pennsylvania-based FMC Corporation, an agriculture company that dominates a wide variety of inputs like pesticides and related crop protection chemicals. The company benefits from the agriculture bull market as it sees higher selling volumes and better prices. While the company does not benefit like its peers who produce fertilizers, it does see above-cost pricing and related higher margins.
On top of that, the company is a reliable dividend growth stock. While its dividend is not consistent, the company offers a 1.5% yield with a lot of room for the company to grow its dividend.
Thanks to strong cash conversion, the company is currently running an implied free cash flow yield of more than 5.0%, which does provide a great basis for high dividend growth and indicates a stock price valuation with more upside.
Right now, I believe that the stock has room to run to $140-$150. However, and this is important, I would not buy a big position at current prices. If investors are interested and looking to buy a position for their dividend portfolios, make sure to buy after a 20% sell-off. This tends to happen rather frequently and it does make it a juicier deal. Given FMC’s history and comparison to the S&P 500, I only recommend buying this stock on weakness.
It’s also the reason why I am “neutral” on the stock despite my view that there’s upside to $140-$150. It’s purely based on the risk/reward.
(Dis)agree? Let me know in the comments!
Be the first to comment