

olm26250/iStock via Getty Images
U.S. stocks began the week on a positive note with gains in all three major indexes. Technology shares gained heavily on Monday after Elon Musk reported a significant stake in Twitter (TWTR). One day later, however, the Nasdaq and the DJIA led the way down after comments from Fed governor Lael Brainard that suggested the central bank was committed to taking significant steps to reduce inflation. This came as a surprise since she was one of the more dovish governors just last year. The news of Brainard‘s comments distracted from the release of the Institute for Supply Management (ISM) survey, which came in strong at 58.3, an increase over the 56.5 reported in February.
Losses accelerated on Wednesday after investors digested details from the Fed minutes, which showed that officials considered raising rates by a half-percentage point last month, but decided not to given geopolitical uncertainties. On Thursday, however, indexes recovered some ground after the release of data that showed new applications for U.S. unemployment benefits falling to a 54-year low. In addition, positive sentiment was further reinforced by the disclosure of Berkshire Hathaway‘s stake in HP. As of mid-day trading Friday afternoon, stocks were mixed and were on pace to end the week with weekly losses, barring any major developments.
In addition to comments from the Fed and the release of their minutes, markets were affected all week by the rapid sell-off in U.S. Treasurys, which sent yields and rates on underlying borrowings, such as mortgage rates, soaring. The continuing crisis in Europe and China‘s strict COVID mitigation efforts further strained investor sentiment throughout the week.
The week offered potential buying opportunities on many stocks. For long-term, income-focused investors who seek upside at reasonable risk, there are five stocks this week that would fit well on the watchlist of any diversified portfolio.
Illinois Tool Works Inc. (ITW)
ITW is global manufacturer of a diversified range of industrial products and equipment. The company operates in seven distinct segments: Automotive OEM; Food Equipment; Test & Measurement and Electronics; Welding; Polymers & Fluids; Construction Products; and Specialty Products. In 2021, the company reported +$14.5B in total revenues, which was up 15% from the prior year and slightly higher than in 2019.
ITW Revenue Disaggregation – Form 10-K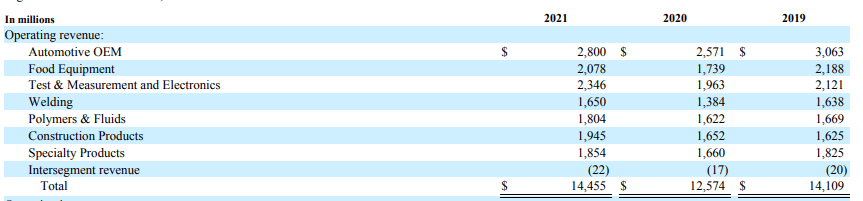
At the end of December 31, 2021, the company had +$1.5B in cash on hand, which represented over 20% of total current assets. In addition, the company generated operating cash flows of +$2.6B and returned +$2.5B to shareholders in the form of buybacks and dividend payouts. The dividend was fully covered by both operating and free cash flows (FCFs) and accounted for just over 50% of total net income. When including share repurchases, both were fully covered by net income and operating cash flows but slightly below full coverage from FCFs.
Author’s Summary of ITW’s Cash Flow Statement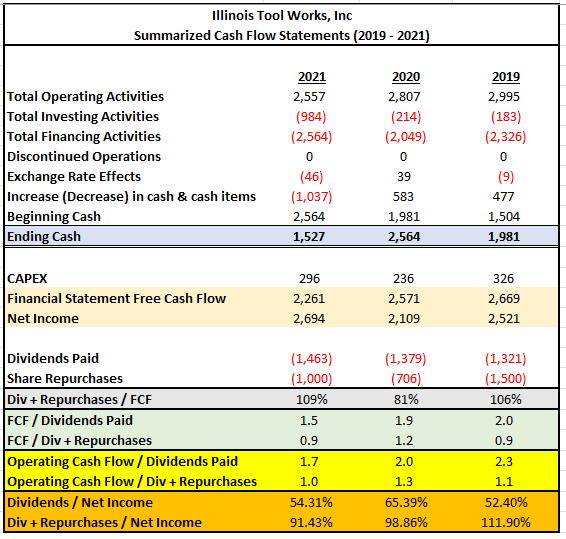
ITW is currently trading at around $205, which is near its 52-week lows. The company‘s annual dividend is currently $4.88 per share, and it has been growing at a 5-year CAGR of nearly 14%. The current yield is approximately 2.4%, which is about average from prior years.
Author’s Calculation of Price Targets of ITW Using Various Pricing Multiples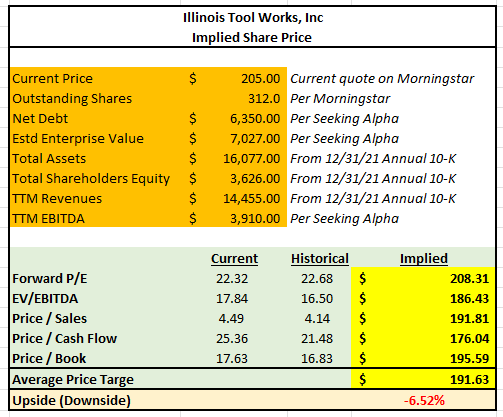
At present, shares are trading at 22x forward earnings, which is in-line with their historical averages. Based on various pricing multiples, the shares appear overvalued by about 7%. On further weakness, however, shares may be worth a further look.
FedEx Corporation (FDX)
FedEx provides a broad portfolio of transportation, e-commerce, and business services through four reportable business segments: FedEx Express; FedEx Ground; FedEx Freight; and FedEx Services. For its most recent quarter ended November 30, 2021, the company reported +$23.5B in total revenues, with 50% attributable to the FedEx Express segment. Reported revenues for the quarter beat estimates by about +$300M.
FDX Revenue Disaggregation – Form 10-K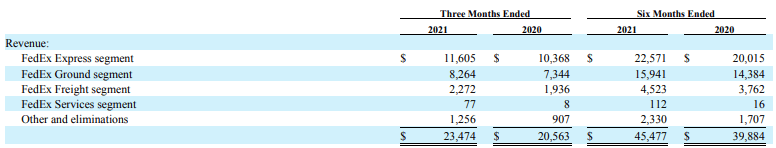
Over the past three months, FedEx is down 22.5%, which is significantly worse than UPS (UPS), which is down also but by only 11%. This is despite the two typically trading either on par or one or the other performing slightly better.
YCharts – 3-MTH Returns of FDX & UPS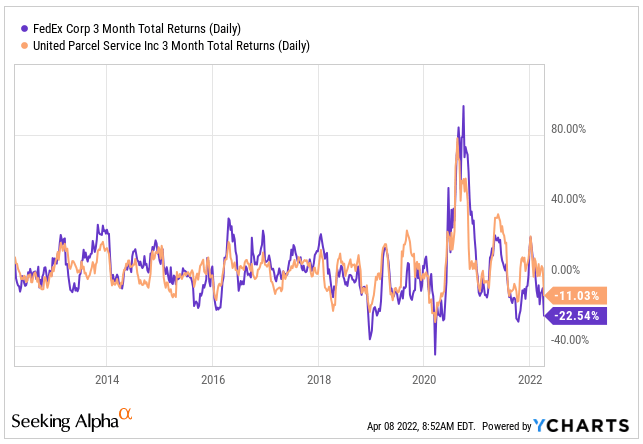
At an RSI of 36, shares are trading on deeply bearish sentiment and appear to be heading into oversold territory. At present, the company is valued at about 9x forward earnings versus a five-year average of 13.7x. At a 13.7x valuation, shares would be worth over $300, representing 46% upside.
YCharts – FDX RSI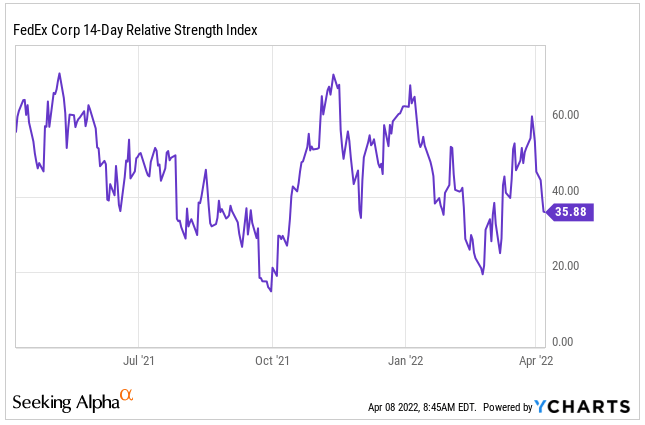
Fortune Brands Home & Security, Inc. (FBHS)
FBHS is a leading home and security products company that sells its products through a wide variety of sales channels in three business segments: Plumbing; Outdoors & Security; and Cabinets. Well-known brands listed under FBHS include Moen, Master Lock, and KitchenCraft, among others.
In 2021, the company reported net sales of +$7.7B, which was up 25% from 2020 and 32% from 2019. Sales derived from each segment are essentially proportional to each other. Of the total, sales to The Home Depot (HD) and Lowe‘s (LOW) each accounted for 14% of total net sales.
FBHS Revenue Disaggregation – Form 10-K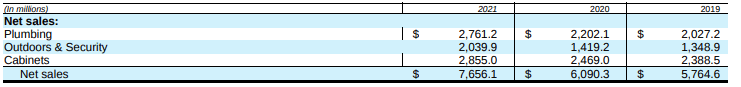
While there are concerns about rising rates and the impact on the housing market, demand for homes still exceeds the supply of homes on the market. Even if demand pulls back from rising rates, prices should remain supported by the dearth of supply. Record home prices have contributed to record net household worth. This will continue to support the home improvement market in 2022 and beyond.
Board of Governors of the Federal Reserve System (US), Households; Net Worth, Level [BOGZ1FL192090005Q], retrieved from FRED, Federal Reserve Bank of St. Louis; April 8, 2022.![Board of Governors of the Federal Reserve System (US), Households; Net Worth, Level [BOGZ1FL192090005Q], retrieved from FRED, Federal Reserve Bank of St. Louis; https://fred.stlouisfed.org/series/BOGZ1FL192090005Q, April 8, 2022.](https://static.seekingalpha.com/uploads/2022/4/8/49921492-1649439660941712_origin.png)
In 2021, FBHS generated +$689M in operating cash flow and had +$476M in cash on hand. Additionally, the company paid out nearly $600M to shareholders in fully covered dividend payouts and share buybacks. The cash flows of the company are very strong, and the payouts appear safe for the foreseeable future, despite the dividends growing at a 5-year CAGR of nearly 10%.
Author’s Summary of FBHS’ Cash Flow Statement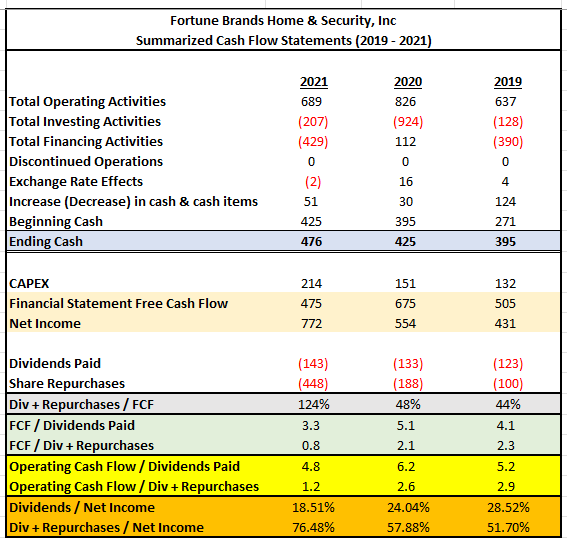
The share price has dropped significantly from its 52-week highs and shares are now trading near their five-year average but well above their lows from 2020.
YCharts – Historical Pricing of FBHS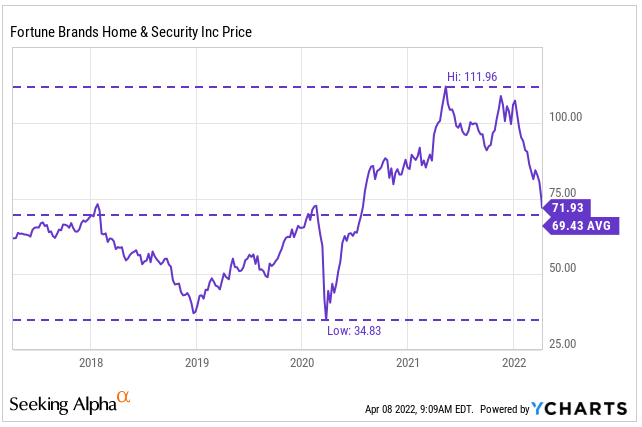
At present, shares appear undervalued by about 30% based on various pricing multiples. For example, the forward P/E is currently 11.20x versus a five-year average of 16x. This would indicate an implied price of $109.
Author’s Summary of FBHS’ Cash Flow Statement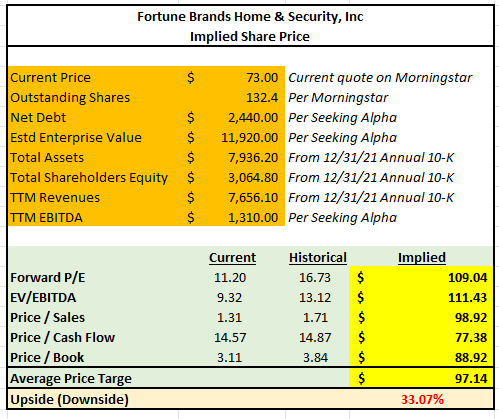
Cummins Inc. (CMI)
Cummins Engine Company is a global power leader that designs, manufactures, and distributes powertrains and powertrain-related components, among other businesses. The company operates in five operating segments: Engine; Distribution; Components; Power Systems; and New Power.
In 2021, the company reported total net sales of +$24B. This was 21% greater than 2020 and slightly higher than in 2019. During the year, over 50% of net sales were attributable to the United States.
CMI Geographical Revenue Disaggregation – Form 10-K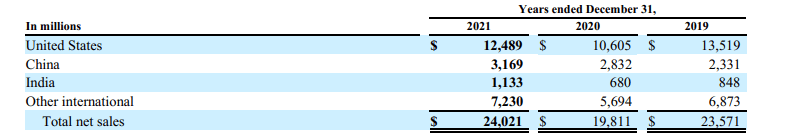
Over the past three months, CMI has significantly underperformed when compared against the broader S&P. While the S&P is down only 3%, CMI is down nearly 16%.
YCharts – 3-MTH Returns of CMI & Overall S&P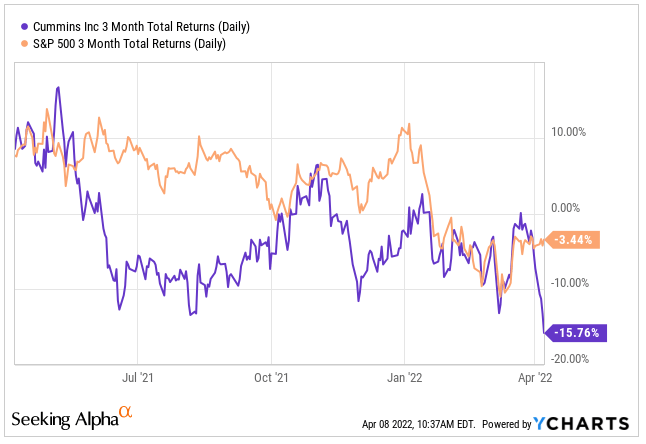
The underperformance is at odds with the historical performance of the company. Over the past ten years, the company has consistently outperformed the S&P. In 2020, however, performance has suffered and has yet to return to normalized levels. Significant input cost inflation, supply disruption, and general uncertainty in the operating environment is fueling much of the declines.
YCharts – 10-YR Returns of CMI & Overall S&P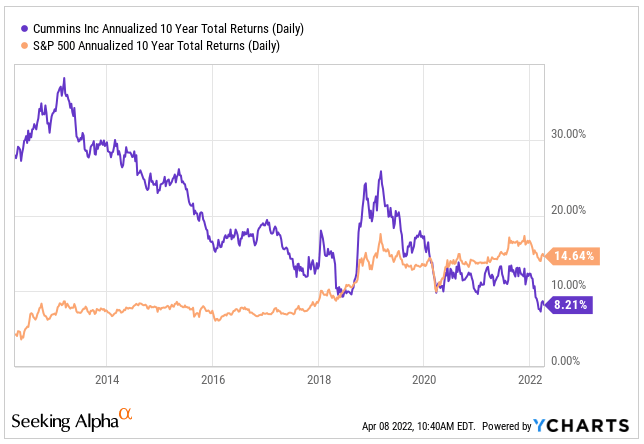
The pullback in the shares has presented an attractive opportunity for long-term investors. Shares are currently trading near their lows and at a discount to their historical pricing multiples. In applying their historical forward multiple to current pricing, a target price of nearly $250 is obtained. Additionally, for 2024, the consensus dividend estimate is $6.71, which would represent a yield-on-cost of 3.42%. This is at odds with their current yield of about 3.0%. Adjusting for this would yield a target price of approximately $220, which would be about 12% above current levels.
Citigroup Inc. (C)
In the past month, Citi is down 7% and has been hovering around $50 for the past several days. The spread between its 52-week low and its 52-high is over 60%, which indicates significant upside potential.
The company has been trading well below its 50-day moving average, which indicates bearish sentiment. The crossover of the 200-day and 50-day averages in late December was an early indicator, and since then the stock has been on a steady downtrend. At times, shares made a run higher but quickly hit resistance and traded back down.
YCharts – Moving Averages of Citigroup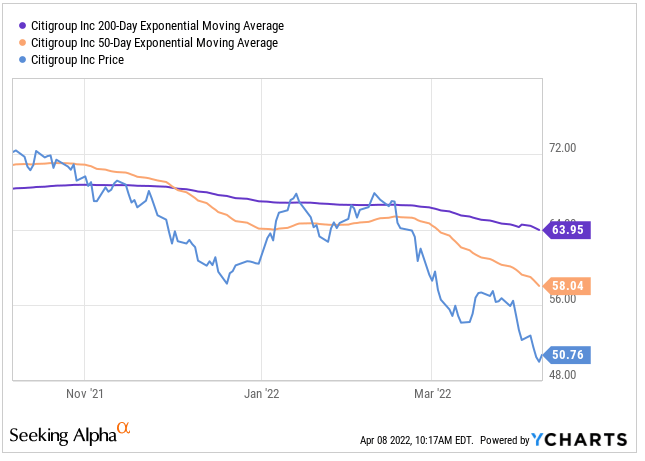
The RSI, however, is suggesting the stock is deeply in oversold territory.
YCharts – Citigroup RSI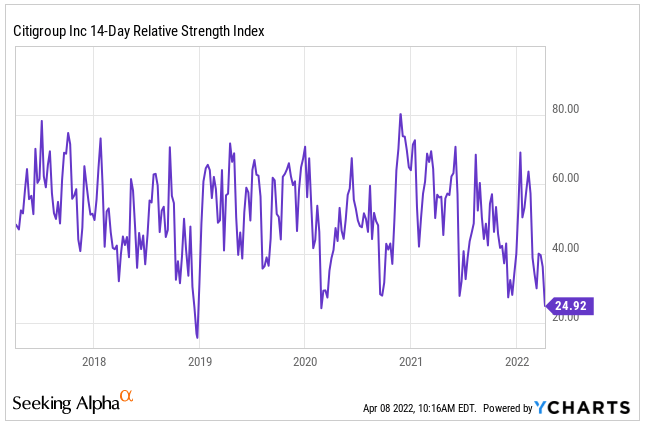
Citi is set to report earnings on Thursday, April 14. Given the oversold nature of the company, it‘s possible the shares will experience a rapid reversal if the company were to report a stellar beat with unexpectedly positive guidance. At present, shares are currently trading at 6.9x forward earnings versus a historical average of 10x. The implied price, therefore, would be about $75, which is in-line with consensus estimates from Wall Street. In addition to the upside potential, the dividend is currently yielding over 4%, which is higher than historical yields for the company. Citi, therefore, is attractive at current levels.
YCharts – Total Returns of Citigroup and Their Peers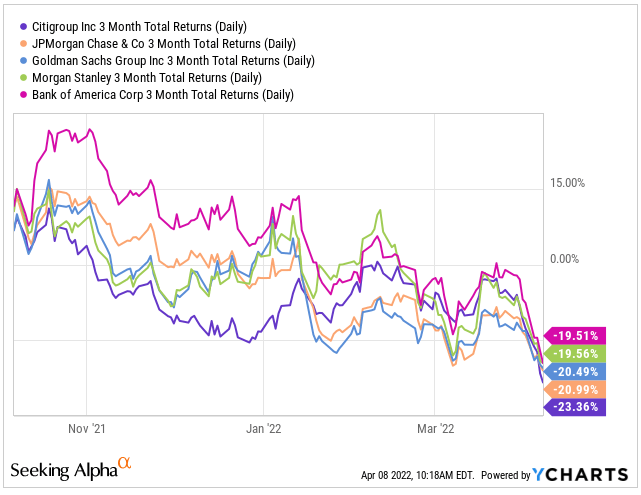
Conclusion
Established companies with solid fundamentals have historically performed well over the long term. Any declines in the value of these companies are, therefore, worth further examination. FBHS and Citi are two companies that warrant extra attention, given their significant underperformance.
While further analysis must be performed to obtain a more complete picture of the five companies mentioned above, an attractive opportunity exists for the companies to be added to the watchlist of any long-term diversified portfolio.
Be the first to comment