

jetcityimage/iStock Editorial via Getty Images
Five Below, Inc. (NASDAQ:FIVE) is growing rapidly due to its new store openings. New product offerings improve consumer satisfaction levels. The stock is considerably undervalued compared to its historic multiples. Peers with similar growth rates are trading at higher multiples.
Five Below is growing rapidly mainly due to its successful store count growth. A new store brings the business about 150% IRR with a payback period less than 8 months. The company was able to record 23.1% revenue growth due to new store openings in the last decade. The management considers new store openings a good way to increase brand value and attract new shoppers, that is why the total store count target has been revised upwards.
The management intends to reach 3,500 stores by 2030, which indicates 14.5% store-count CAGR in an 8-year period. The new goal is a substantial upward revision from the former 2,500 target. In 2021 the company opened 170 new stores in 24 states, as currently the brand is present in 40 US states (1,190 stores). At the same time the company is successfully increasing comparable sales, as the comps sales increased by 3.4% YoY in Q4 2021 and recorded 3.5% CAGR in the last decade.
The company is actively investing on innovative solutions which can cut costs and make the shopping experience more convenient. The Associate Assisted Self-Checkout (ACO) solutions help the company to reduce inflationary pressures coming from wage increases and enable it to improve the consumer experience. Five Below has already started to use ACOs in 60% of its stores and intends to gradually increase the number to 100%.
The CEO of the company, Joel Anderson, expressed his opinion about the ACOs:
ACO allows our crew to move from behind the register to the floor to assist our customers with their shopping and checkout process, which makes for a better and faster customer experience.
The company is gradually expanding the proposed product base. Management sees significant success in its Five Beyond offerings, as an average Five Beyond shopper spends 2.5 times more money than Five Below consumers. So the number of stores where one can find Five Beyond offerings is rising quite fast. In 2020, only 12.7% of stores offered Five Beyond products while the number is expected to cross 40% level in 2022 and 60% level by 2024.
Du-Pont Analysis
The company has a quite high ROE margin at around 25% level. During the last 5-year period, the margin improved from 21.7% to 24.9%.
Author’s Model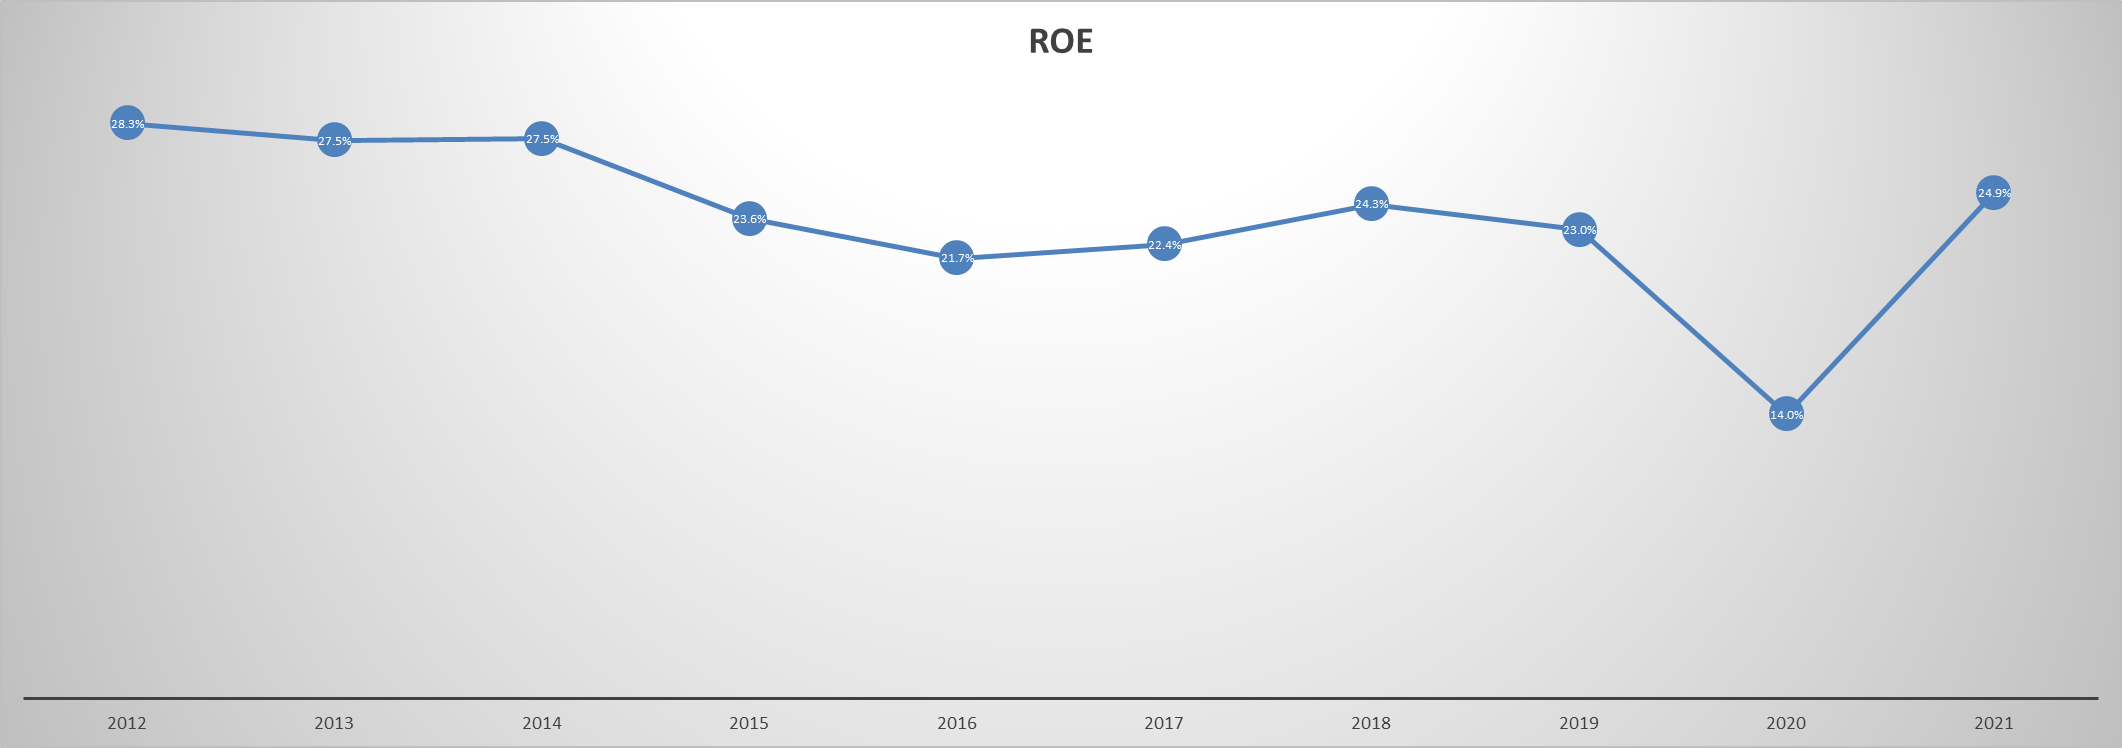
The main driver of the improving ROE was increasing net profit margin. In 2012, the margin was at around 5% level, while in 2021 it reached the 9.8% level. Meanwhile, the asset turnover ratio declined substantially from 2.2 to 0.99. Despite the decline, we should notice that the ratio is not too low. The total leverage significantly increased during the last decade; however, as the debt burden is low, it will not cause problems in upcoming years.
Author’s Model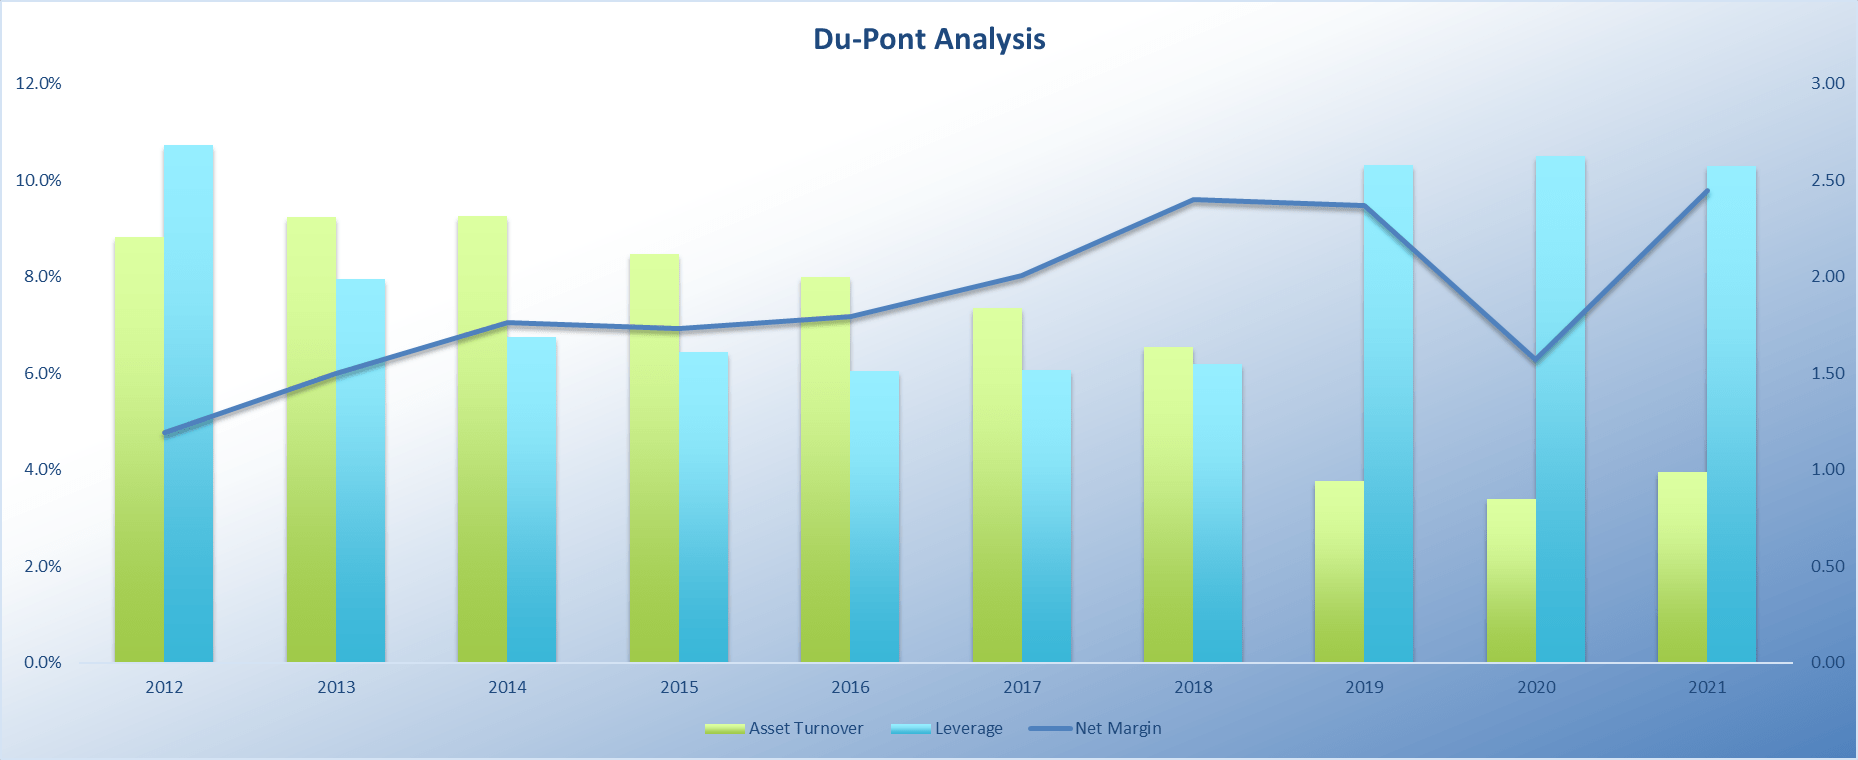
So the Du-Pont analysis indicate that the profitability of the company is in a healthy condition.
It is also worth mentioning that the ROE margin significantly exceeds the required rate of return. Using the CAPM model (1.48 beta, 5.37% equity risk premium and 2.4% risk free rate) we get required rate of return of 10.3% which is substantially lower than TTM ROE of 24.9% and even lower than 2020 ROE of 14%. This means that the management is successfully creating value for shareholders in a long-term horizon.
Risks
Like every brick-and-mortar retailer the company faces significant risks coming from e-commerce providers. The online shopping companies are gradually grabbing market share from traditional retailers. Thus, the management must invest heavily to develop its own online shopping infrastructure.
The company faces substantial inflationary risks, as it offers cheap products and cost increases may squeeze the narrow margins of the business.
Valuation
In recent 10-year period, the stock traded at an average P/S TTM multiple of 5.6, while the 5-year average is 3.8 and the 3-year average is 4.1. Currently the stock trades at a 3.1 P/S TTM multiple, which indicates below-average valuation.
Author’s Model (seekingalpha.com)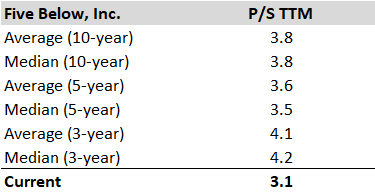
To better understand the relationship between sales and the market cap, we have built a regression model of TTM revenues against market caps. As a result we see strong correlation between the two variables as the R square is equal to 84.9%. Considering analysts’ 2022 revenue estimate of $3.24 billion and using the regression equation, we get an implied market cap of $17.37 billion, which is 95.8% higher than the current market cap.
Author’s Model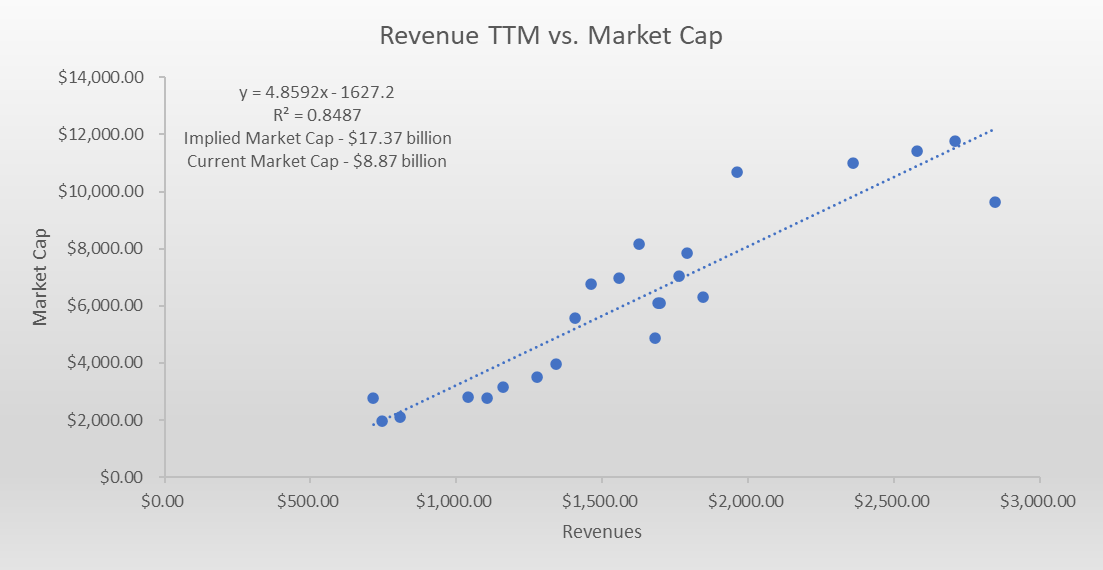
Despite the declining P/S ratio, management was able to keep gross margin stable while improving the EBITDA margin. The 10-year average gross margin is 36.3%, while the TTM margin is 36.2%. The 10-year average EBITDA margin is 14% against the TTM margin of 16.3%.
Author’s Model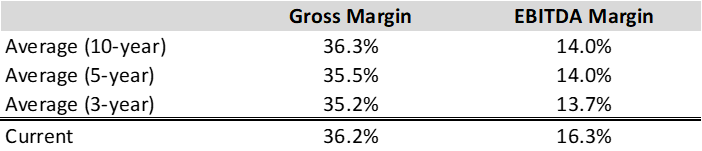
Regressing historic TTM gross profits against market caps, we get a high correlation coefficient as the R squared is 86.8%. Using 3-year average gross margin of 35.2% and 2022 estimated revenue of $3.24 billion, we get an implied market cap of $13.4 billion, which is 51% higher than the current market cap.
Author’s Model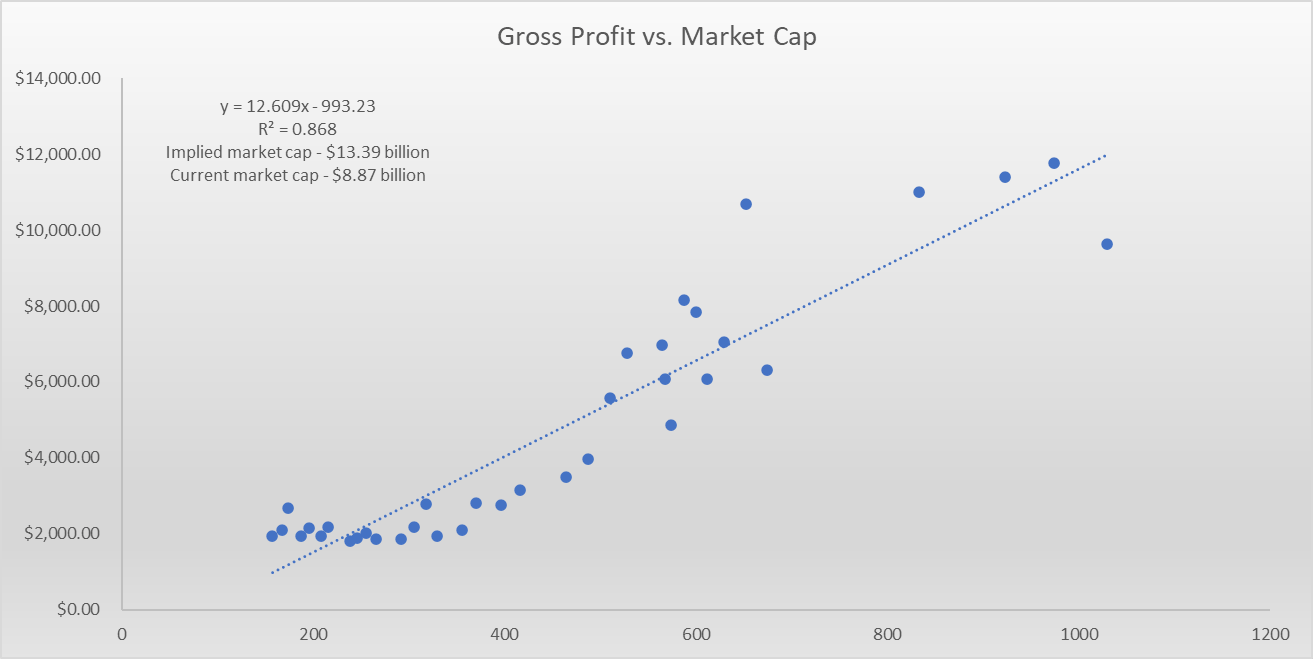
Regressing the historic EBITDA against historic market caps, we witness strong relationship, as the R square is equal to 81.1%. Using 3-year average EBITDA margin of 13.7% and estimated 2022 revenue of $3.24 billion, we get implied market cap of $11.86 billion, which is 33.7% higher than the current market cap.
Author’s Model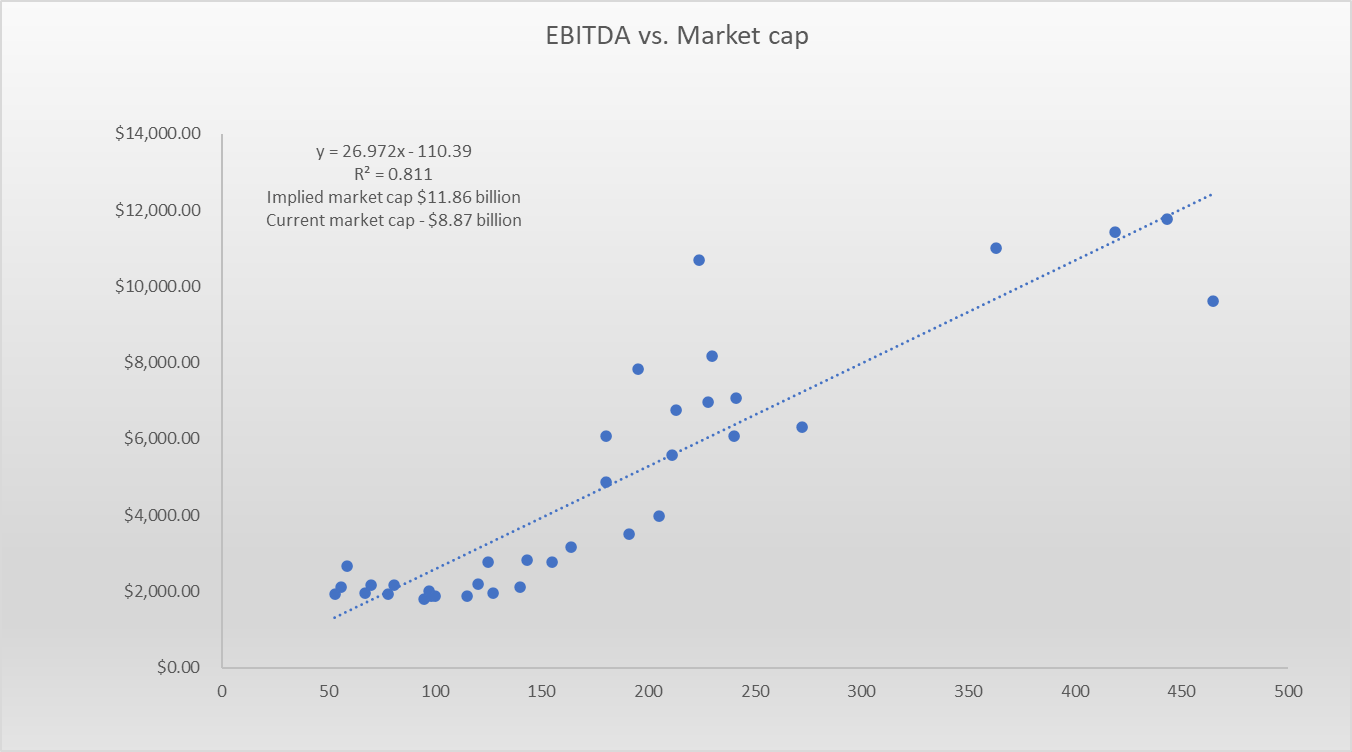
We have also conducted a comparable valuation analysis to assess FIVE valuation against competitors.
Author’s Model (seekingalpha.com)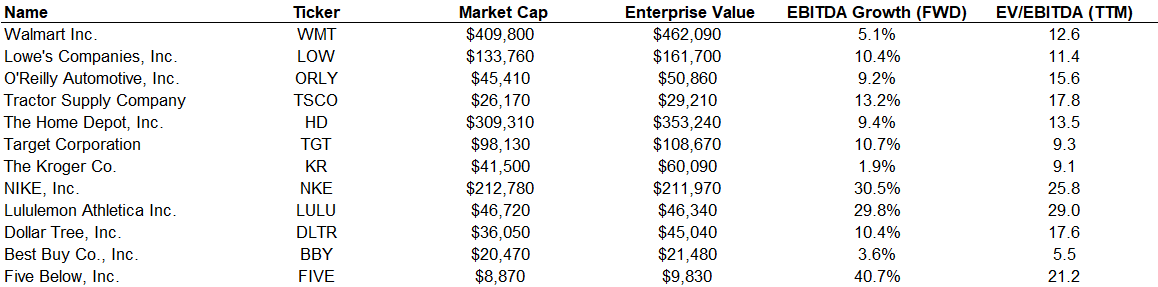
As a result we see that the company is valued quite conservatively. Using the data we have built a model regressing competitors’ EBITDA FWD (FY1) growth rates against EV/EBITDA TTM ratios. As a result, we get an implied EV/EBITDA multiple of 28, which is 32.3% higher than the current multiple.
Author’s Model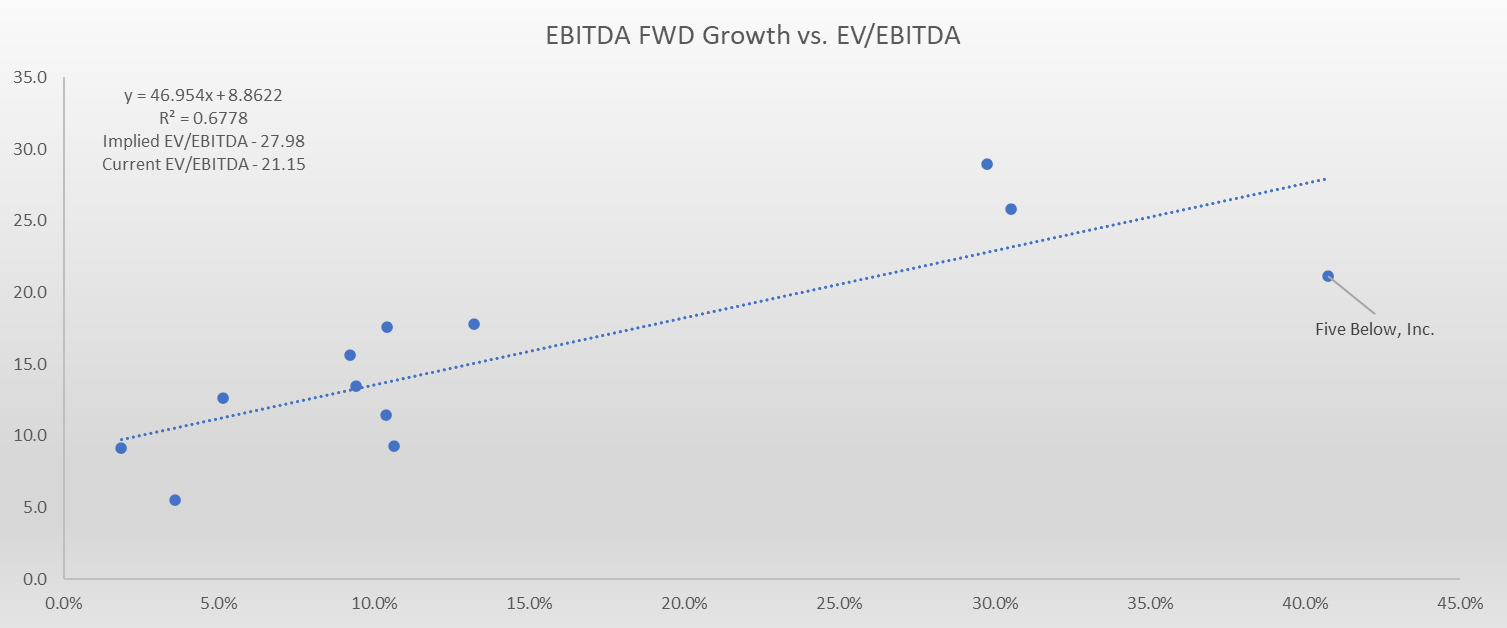
We see a similar picture when we regress peers’ expected EPS growth rates (FY1) against P/E FWD multiples. The regression analysis yields R square of 56.9% and 36.4 implied P/E FWD for Five Below. The result indicates that the stock has 23% upside potential.
Author’s Model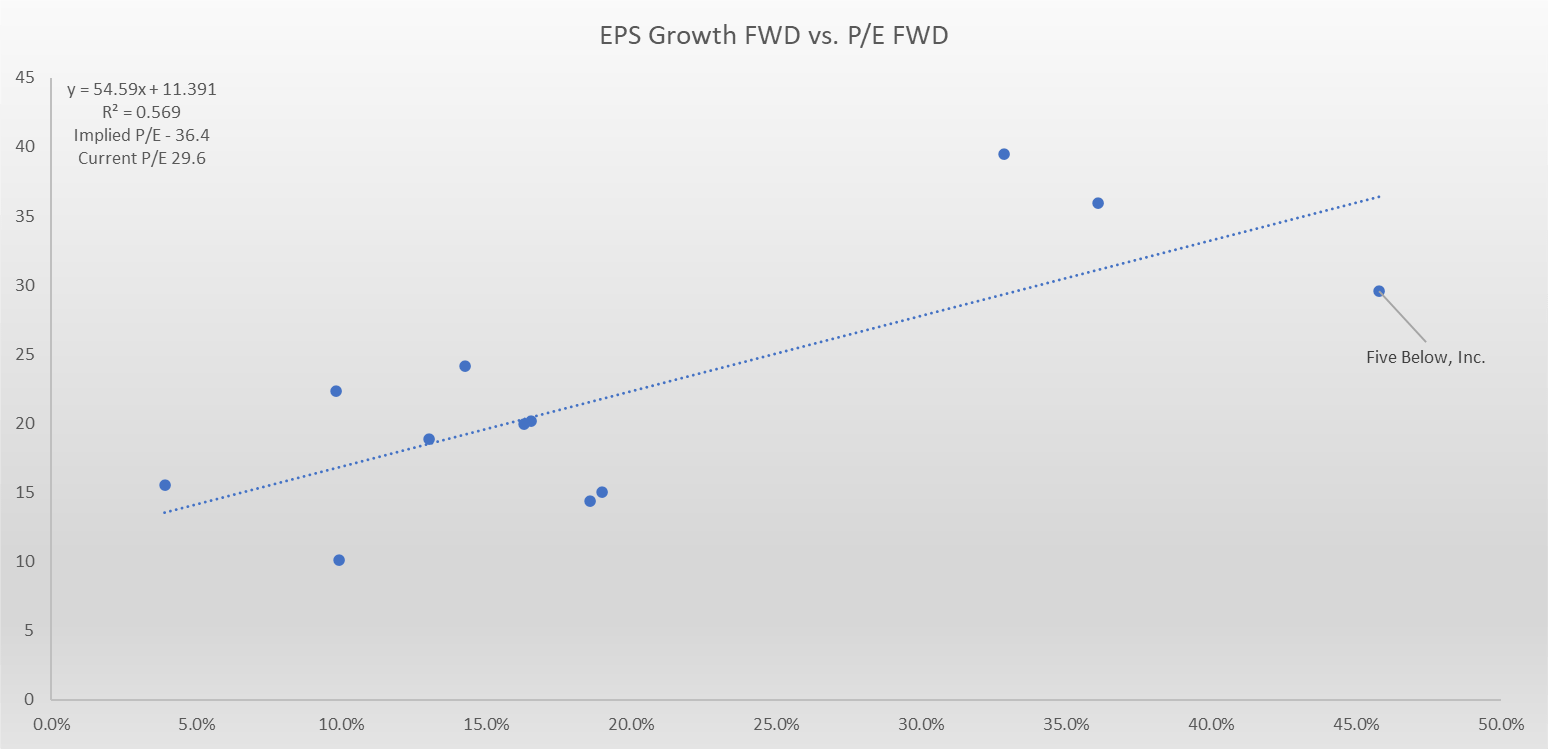
Conclusion
Five Below has adopted a quite successful business model and achieves attractive growth. Increasing store count and comp sales growth might yield near 20% CAGR in upcoming decade. Our valuation analysis indicate that the stock is currently undervalued, as, using the average of our valuation results, we get an implied stock value of $239.4.
Author’s Model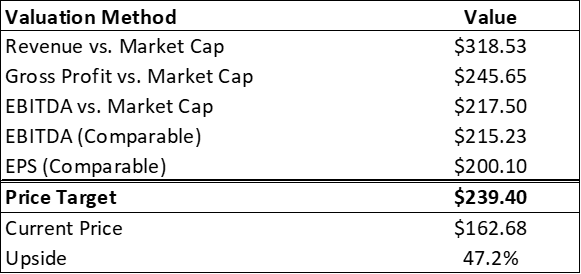
Our target price is almost 50% higher than the current market price. Thus, we believe that the stock can be a good choice to outperform the market.
Be the first to comment