

Portra
First Industrial Realty Trust (NYSE:FR) is a real estate investment trust (“REIT”) that is focused on 15 key logistics markets with a coastal orientation.
As an industrial REIT, FR is currently enjoying many of the same tailwinds as their peers. This includes low vacancy rates, near-full occupancy, and soaring rental rates. All of this has contributed to robust earnings strength and positive revisions to guidance.
Taken together with their strong balance sheet and reliable dividend payout history, FR does make for an adequate portfolio holding for existing shareholders.
But offsetting their strengths is a significant pipeline of in-process construction projects that are speculative in nature. While these projects are expected to contribute meaningfully to value-creation, there are too many uncertainties in the current market environment.
While the industry outlook, overall, is positive, investors would be better positioned seeking out less speculative exposure.
Operating Markets
Some of FR’s top markets include Southern California (“SoCal”), South Florida, and key regions within the Northeastern U.S., such as Central/Eastern Pennsylvania. In part, these areas make up the company’s coastal exposure, which account for over 50% of total rental revenues.
November 2022 Investor Presentation – Snapshot Of Current Operating Markets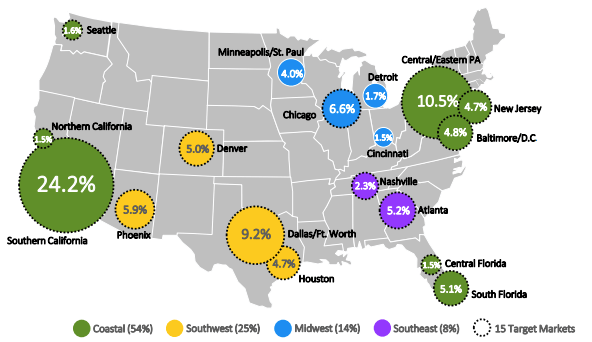
Exposure to these coastal regions provides the company with a footprint in some of the most supply constrained markets in the country, particularly SoCal, which is especially so.
In addition, these markets also benefit from favorable population metrics, such as growth, size, and income, all contributing factors to the vibrancy of the local economies.
The Peer Group
With a current enterprise value of +$8.5B, FR is on par with EastGroup Properties (EGP) in terms of size.
Seeking Alpha – Current Market Cap Of FR Compared To Peers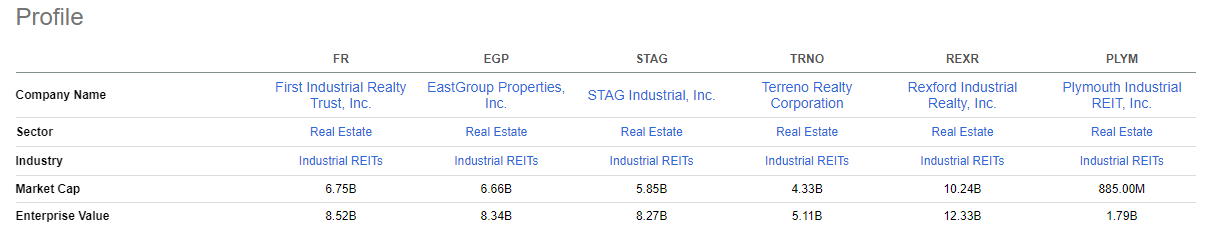
And though both companies trade at a similar multiple of 22x forward funds from operations (“FFO”), FR has outperformed EGP on a YTD basis. While shares in both are down significantly, the losses incurred by FR’s shareholders is less, at 24%, compared to those holding EGP, which is down over 30% over the same period.
Seeking Alpha – YTD Performance Of FR Compared To EGP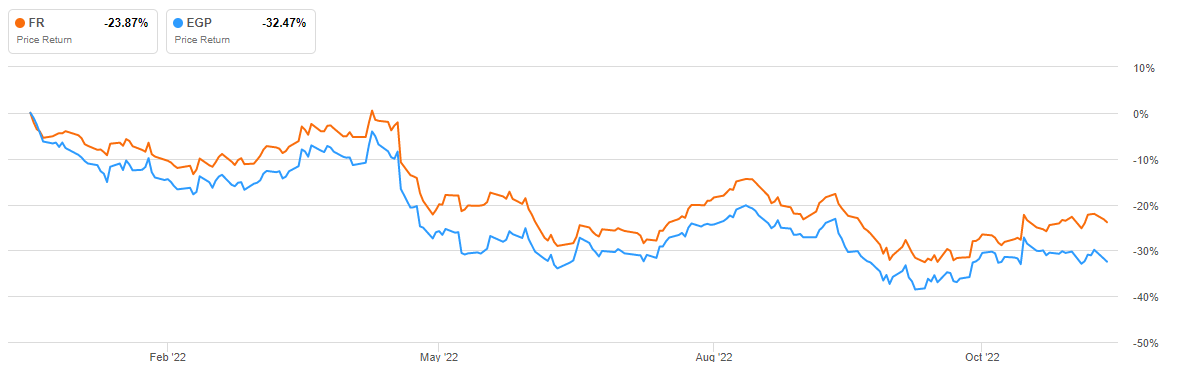
Recent Performance
In-service occupancy levels continue to hold above 98% and vacancy rates in their markets remain below 3%.
This elevated degree of tightness in relation to prior years is providing the company with enormous pricing power on lease renewals. Overall cash spreads in 2022, for example, are hovering around 25%.
And the company is already making notable headway on their 2023 expiration schedule, having addressed 38% of the population at spreads of 28%. Given that 36% of the remaining 2023 rollovers are in their SoCal markets, which are among the strongest industrial markets in the country, one can reasonably expect continuing strength in renewal spreads in subsequent periods.
Same-store cash net operating income (“NOI”) growth has clearly benefitted from the strong portfolio metrics, and this outperformance is reflected in recently increased full-year guidance.
FR is also capitalized conservatively, with a manageable debt profile. Consolidated leverage is just 25.6% and their net debt in relation to EBITDA is within internal targets. Furthermore, the company’s portfolio is essentially unencumbered, which is a credit positive. An upper-single digit interest coverage ratio provides even further confidence of their debt servicing capacity.
The well-positioned balance sheet in-turn provides FR with the firepower to capitalize on opportunistic acquisitions and/or to deploy to their development pipeline, which is a critical aspect of their business, perhaps overly so.
The Development Pipeline
Over the last six-plus years, the company has created $7.70/share of value through their pipeline of developments. And at present, there is +$3.7M SF under construction, which represents approximately 5.5% of their total gross leasable area. While this is ultimately expected to generate over +$500M in value creation, most of the projects are not pre-leased and are, therefore, speculative.
November 2022 Investor Presentation – Summary Of Developments Under Construction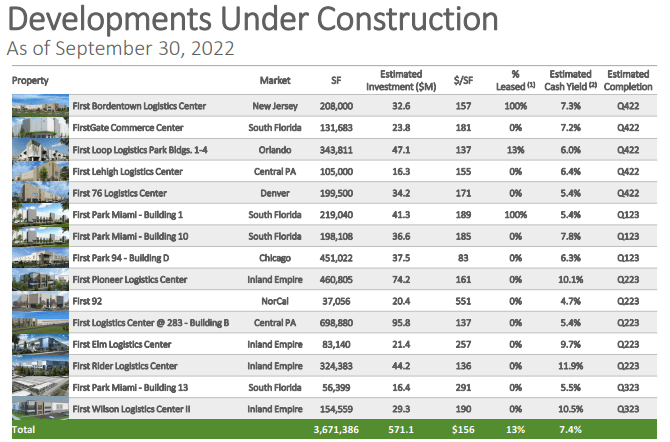
The speculative nature of the projects is a key risk factor, especially in the current market environment. As it is, major market players are shying away from building new warehouses with tenants not already signed on.
Industrial giant, Prologis (PLD), noted on their conference call that a higher share of Q4 starts would be geared towards build-to-suit, signaling a more cautious approach to deployment in the coming months.
FR, on the other hand, initiated additional starts during the quarter, all of which were speculative. Certainly, the company has the expertise in this area, but a deterioration in the economic environment could subject them to more elevated losses than their peers, who tend to have a more diversified pipeline of projects.
Unexpected increases in development costs via rising labor and materials or regulatory hurdles could easily throw off management’s margin targets, which are currently in the range of 73%-83%.
In addition, further pullbacks in the industrial market, similar to Amazon’s (AMZN) recent plans to sublet millions in warehouse space, could produce a drag in the market at the same time of rising supply, which would ultimately pressure rents and result in an uptick in vacancy rates.
AMZN is also FR’s top tenant, accounting for over 5% of annualized net rents. They are, therefore, at higher risk of loss resulting from any significant pullback of AMZN from the market.
Q3FY22 Investor Supplement – Partial Summary Of Top Tenants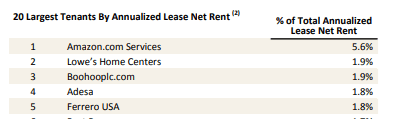
This concern, however, was already addressed on the Q2 conference call. At that time, management noted that the space they have with AMZN is at below market rates and that there were no active discussions with the company regarding any subleasing plans on their existing space.
While the concerns were downplayed, it is still worthy of attention, considering AMZN is FR’s premier tenant.
Better Left On Hold
At 22x forward FFO, shares are trading at the same multiple as PLD, which is a company in a league of its own in terms of size and scale. In fairness, other names of similar size as FR also trade at similar multiples.
EGP, for example, also trades at a 22x multiple. And, in fact, another peer, Terreno Realty (TRNO), even fetches 29x FFO. Yet both these companies lack the speculative exposure of FR.
The weighted average leased rate of EGP’s construction pipeline, for example, is 35%. That’s low, too, but compares favorably to FR’s pipeline, which was just 13% leased as of September 30, 2022.
Though the company has benefitted from favorable industry dynamics, good times remain good until they are not. As such, a higher risk premium is warranted for FR’s speculative exposure, especially considering the current uncertainties in the external market, which may put an end to the good times sooner than later. For new investors seeking an industrial addition to their portfolios, better alternatives exist elsewhere.
Be the first to comment