


Gumpanat
The Funds: XLE & FILL
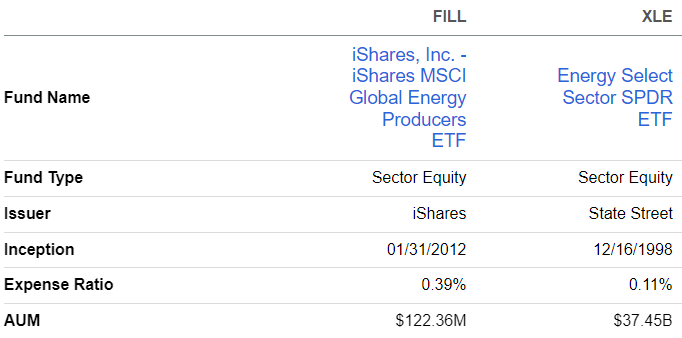
The Energy Select Sector SPDR Fund (NYSEARCA:XLE) is an exchange traded fund launched by State Street Global Advisors, Inc. XLE seeks to track the performance of the Energy Select Sector Index of the S&P 500 Index by using full replication technique.
The iShares MSCI Global Energy Producers ETF (NYSEARCA:FILL) is an exchange traded fund launched by BlackRock, Inc. The fund is managed by BlackRock Fund Advisors. FILL seeks to track the performance of the MSCI ACWI Select Energy Producers Investable Market Index by using representative sampling technique.
Fund Profiles
Seeking Alpha
FILL has a higher expense ratio of 0.39% vs that of XLE at 0.11%. Fill is also a much smaller fund with only $122.36M under management or just 0.3% of XLE’s $37.45B under management.
Fund Quant Grades
Seeking Alpha
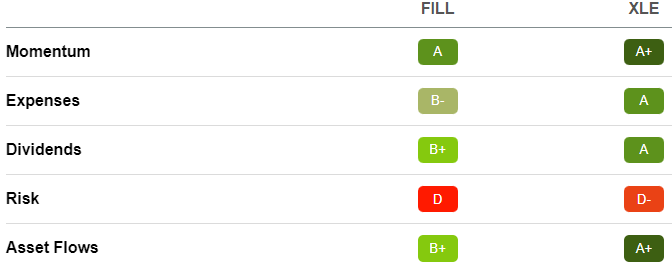
Both funds have comparable Quant scores with good grades for momentum, expenses, dividends, and asset flows with XLE scoring slightly better in each category. FILL and XLE offer similar dividend yields at 4.06% and 4.31% respectively. However, both funds are relatively high risk with FILL and XLE scoring D and D- respectively.
Holdings: Top Ten, Market Cap Distribution, & Geographic Diversification
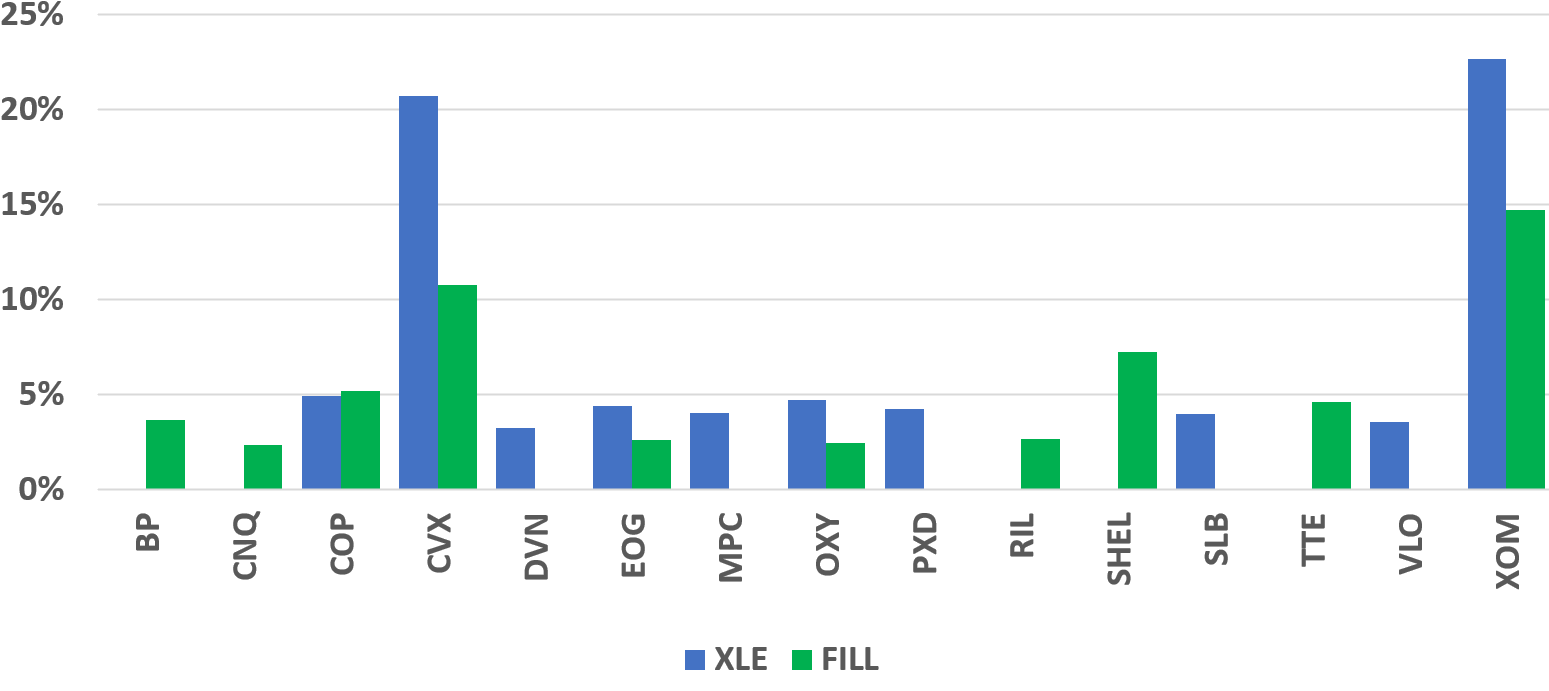
Although both funds follow energy indexes, top 10 holdings, concentration, market cap distribution, and geographic distribution are notably different. FILL is substantially less concentrated with 286 holdings and top ten holdings making up just 56% of total holdings while XLE has only 24 holdings with 76% concentration in its top ten holdings.
Top 10 Holdings Distribution
Author, SA Data
Chevron (CVX) and Exxon Mobil (XOM) are the top two holding for both funds and both funds also include COP, EOG, and OXY in top ten holdings. Notably, the remainder of FILL top ten is international exploration and production companies including BP, CNQ, RIL, SHEL, and TTE.
Holdings Market Cap Distribution

Author, BOA Data
The two also exhibit notable differences in their market cap distributions. XLE is most heavily weighted towards giant caps while FILL has more large, medium, small, and micro-cap exposure.
Holdings Geographic Diversification
Author, BOA Data
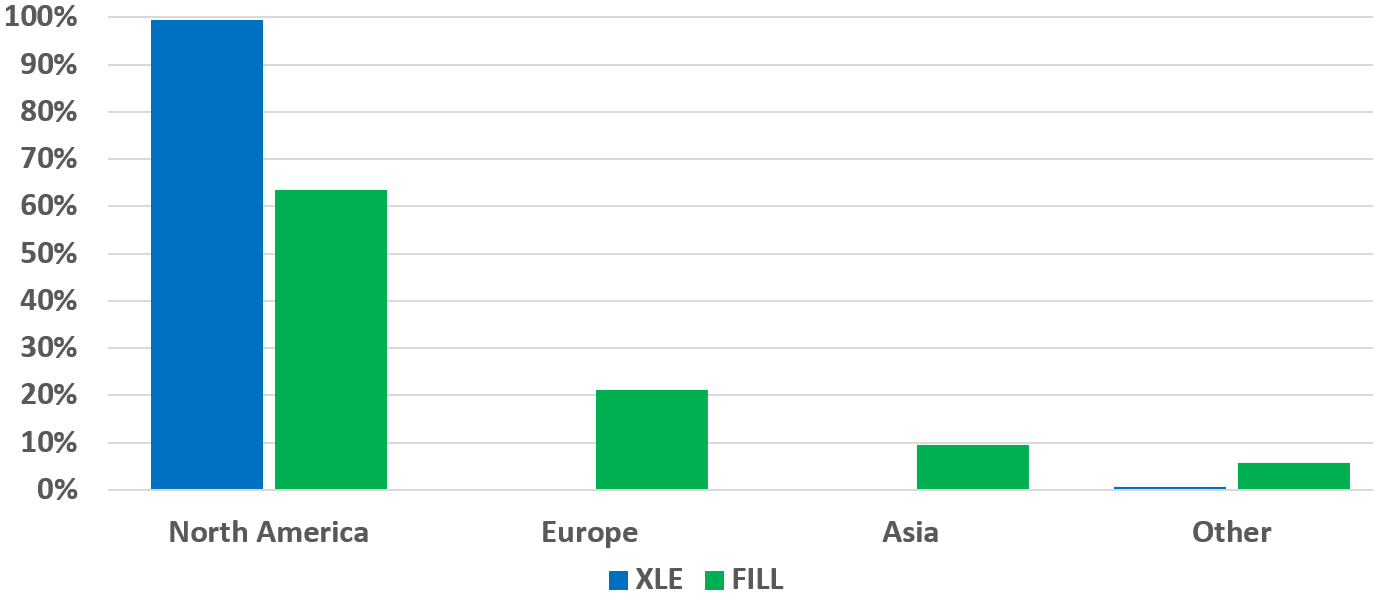
FILL is most heavily exposed to North America but also includes exposure to Europe, Asia, and other regions. XLE exposure is almost 100% North American.
Historic Return and Current Momentum
Total Return: 3-Yr

Seeking Alpha
Over the past 3 years, FILL has returned 8.83% lagging XLE return of 18.41%.
Total Return: 1-Month
Seeking Alpha
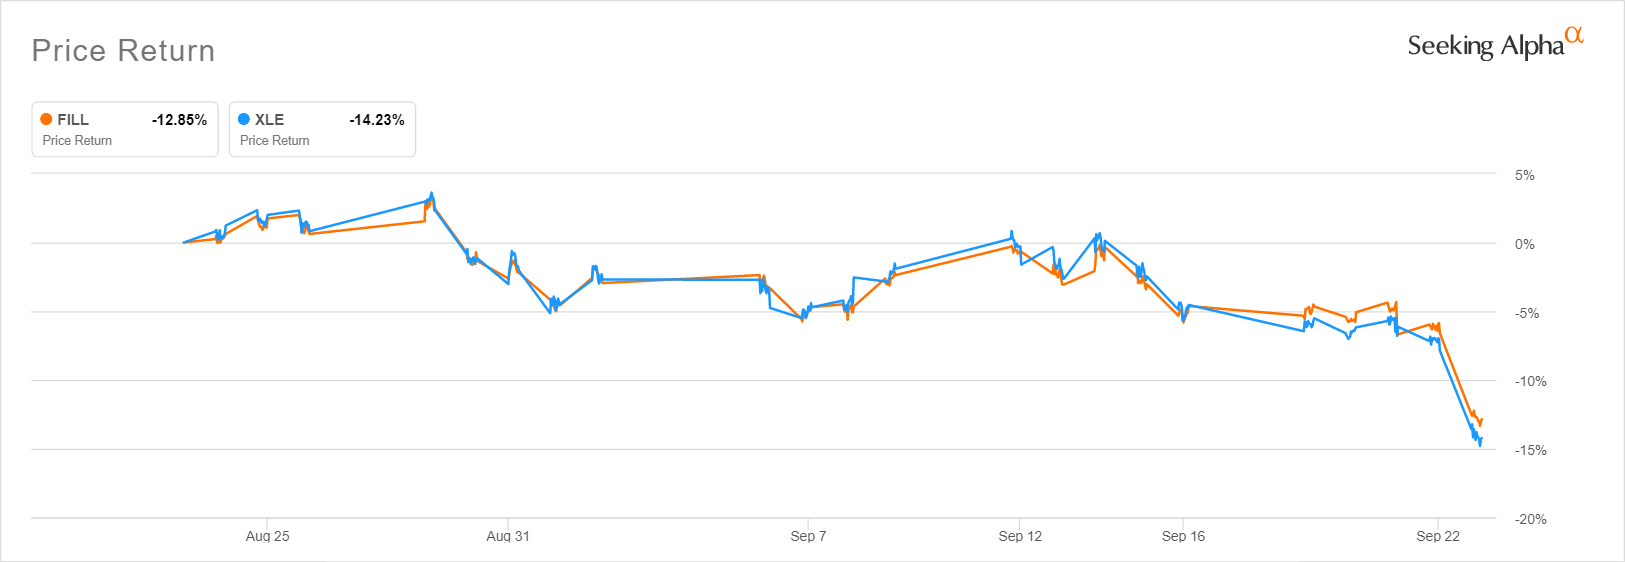
Recently however, with market conditions deteriorating on fears of demand destruction and recession, FILL has been a safer investment. Over the last month, FILL has declined 12.85% while XLE declined 14.23%.
FILL Momentum
Seeking Alpha
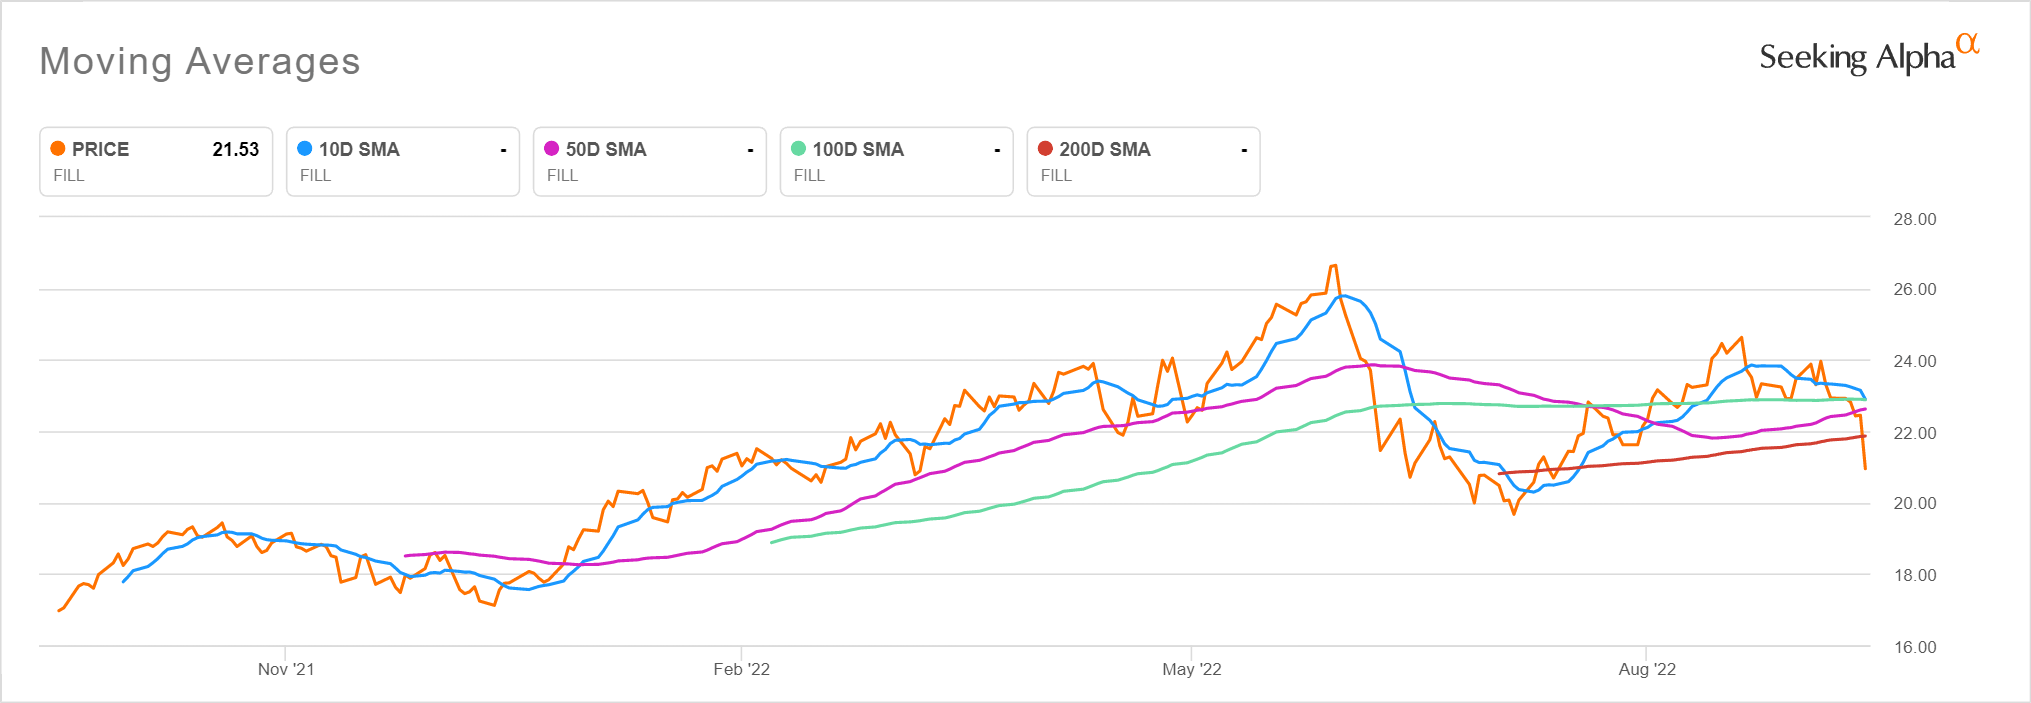
FILL is currently below its longer-term moving averages and below its 10 day moving average by 8.5%.
XLE Momentum
Seeking Alpha
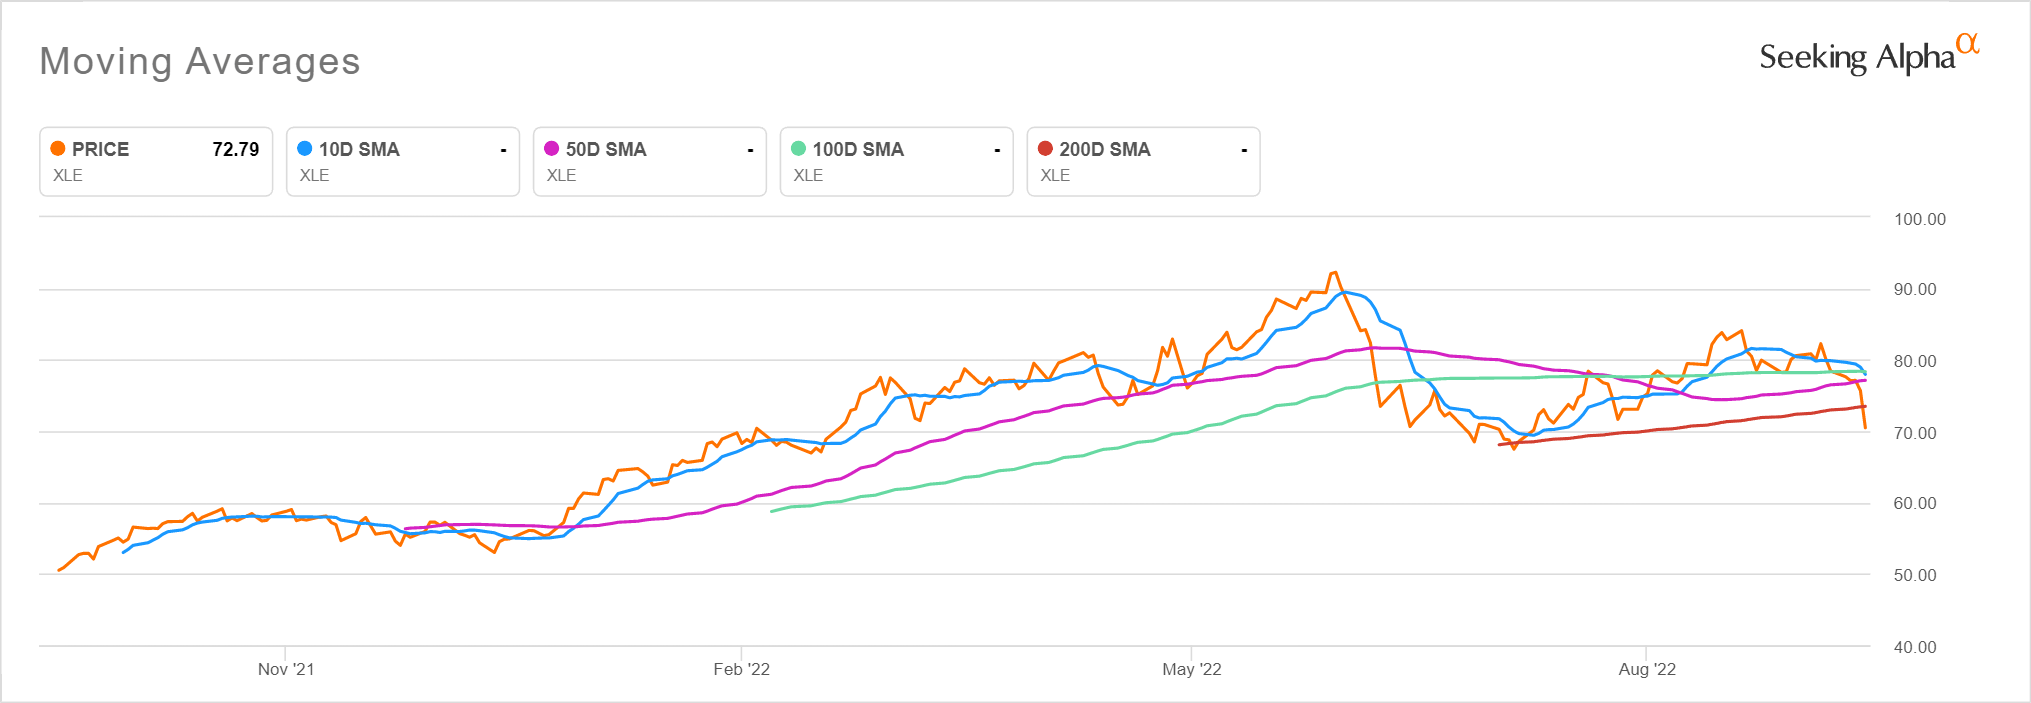
XLE is currently below its longer-term moving averages and below its 10 day moving average by 9.6%.
Current Market Mood: Fear
The current mood in the broader market is fear. Inflation is the dominant concern with the Federal Reserve responding with quantitative tightening and by raising benchmark interest rates.
The Federal Reserve now owns about a third of Treasury and mortgage-backed-securities after 2 years of quantitative easing including emergency buying to prop up the U.S. economy during the Covid-19 pandemic. As a result, the central bank’s balance sheet doubled to about $9 trillion. The additional liquidity helped fuel significant gains in the stocks, bonds, and housing, and other assets.
More recently, the Fed has reversed course in response to inflation and is unwinding its portfolio and thereby reducing market liquidity via quantitative tightening. In June, the central bank began reducing its portfolio by letting up to $30 billion of Treasuries and $17.5 billion of mortgage-backed securities mature without reinvesting the proceeds. This month, the fed will double that figure as additional assets mature and an additional $35B in market liquidity is removed.
Last week, the Federal Reserve approved its third consecutive interest-rate increase of 0.75% and signaled additional large increases were likely even at risk of driving the economy into recession. Stock markets immediately responded with increased volatility and sharp declines. The S&P 500 fell 1.7% while the FILL and XLE fell 6.68% and 6.9% respectively. More broadly, energy lead losses as U.S. crude oil declined more than 7% to its lowest level since January.
Shouldn’t Prudent Investors Just Run Screaming Away From Energy?
In a word, no. Energy fundamentals remain strong particularly with relation to supply.
Natural Gas Storage Volumes
U.S. EIA
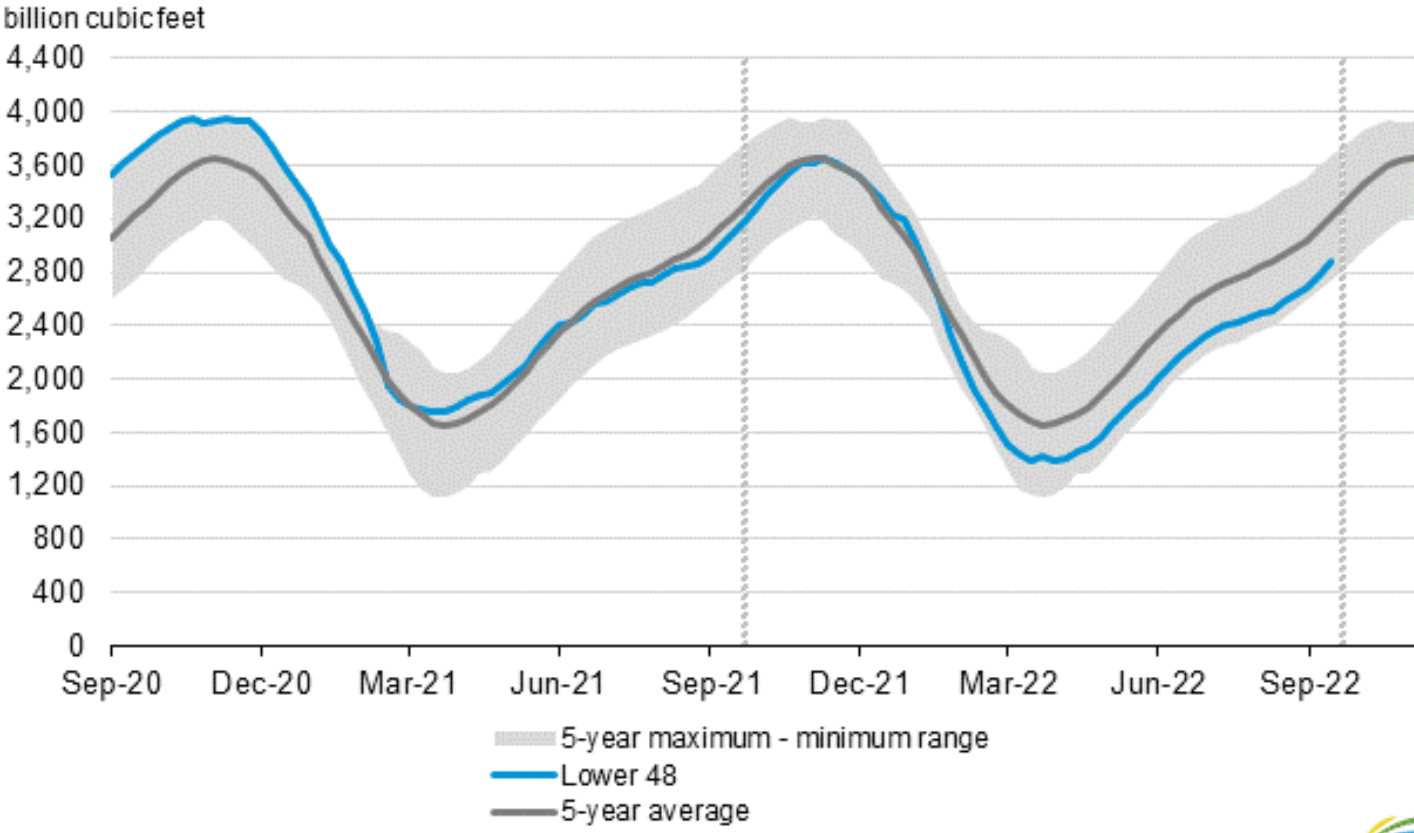
EIA’s most recent weekly natural gas storage report indicates precariously tight supply with storage volumes well below 5-Year averages. U.S. natural gas consumption is also expected to increase to an all time high in 2022.
U.S. Natural Gas Consumption by Sector

U.S. EIA
EIA expects natural gas consumption to increase in all end-use sectors this year with total consumption increasing by over 4% to 86.6 billion cubic feet per day.
U.S. Crude Oil Stocks (million bbl)
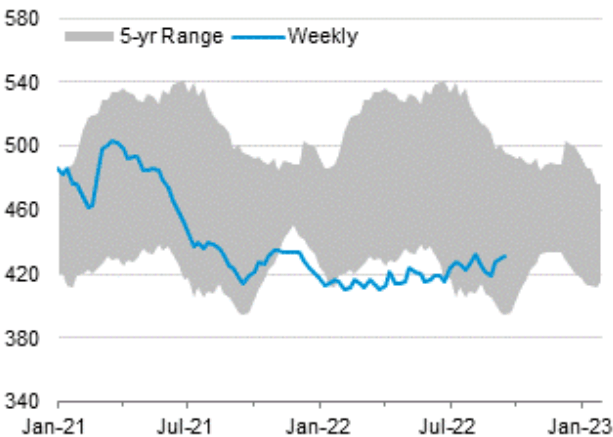
U.S. EIA
Oil supplies are even tighter with weekly storage volumes well below 5-Yr averages. Further oil markets remain largely at the mercy of OPEC+ whose members are now producing below quotas by 3.58 million barrels per day or about 3.5% of global demand. With tight supplies and very limited spare capacity, many predict crude oil will average between $80 – $100/bbl next year.
FILL vs XLE
Given current market conditions, I believe FILL is a safer investment than XLE based on holdings concentration and diversification. FILL has 286 holdings with 56% concentrated in top ten holdings while XLE has only 24 holdings with 76% concentrated in its top ten holdings. FILL has significant large, medium, small, and micro-cap exposure while XLE is more heavily weighted towards giant caps. At the same time FILL holdings include significant exposure to Europe, Asia, and other regions while XLE exposure is almost 100% North American.
Recent price return and momentum indicate FILL is responding more favorably to current market conditions. Over the last month, FILL has declined 12.85% while XLE declined 14.23%. FILL is currently below its 10 day moving average by 8.5% while XLE is below its 10 day moving average by 9.6%.
Some readers may favor large cap and North American Exposure or argue that I am splitting hairs. I feel like prudent investors should always be splitting hairs, particularly now. I am convinced that FILL holdings’ broad diversification make it a safer investment while retaining total return potential if energy should rebound. I recommend energy investors hold XLE and buy FILL at current market prices.
Only a burning patience will lead to the attainment of a splendid happiness. -Pablo Neruda
Be the first to comment