

oatawa/iStock via Getty Images
It goes without saying that when markets are jittery, carefully calibrated investment strategies capable of exploiting the prevailing zeitgeist, correctly identifying the trend to rotate out of laggards and boost exposure to winners quickly, are in high demand.
However, as I noted a few times in the past, a degree of sophistication is not what is driving alpha. Quite frequently, it does the contrary.
More complicated, higher-turnover strategies in most cases perform poorly, to say the least. Consistently beating the bellwether funds like the iShares Core S&P 500 ETF (IVV), let alone its racier peer Nasdaq 100 (QQQ) in the past was unachievable for most.
Today, I would like to explain why I am skeptical about the Innovator IBD 50 ETF (NYSEARCA:FFTY), a growth-heavy mid-caps-leaning fund with what I call a highly sophisticated hybrid active/passive strategy.
In short, I dislike FFTY for a few reasons, with chronic underperformance being the principal one. Elevated fees, together with gargantuan turnover, also contributed. At the same time, it does have advantages that I appreciate.
Strategy essentials
First, let us take a closer look at the fund’s strategy. Incepted in April 2015, FFTY tracks the IBD 50 Index, “the Investor’s Business Daily signature investing system.” The index encompasses 50 high-conviction picks selected from the list of around 7,000 equities. This group must sport outstanding growth and quality characteristics. The cornerstone of the selection process is the CAN SLIM Investing System.
The prospectus says that 11 proprietary factors are taken into account, including EPS, relative price strength, sales margin return on equity, accumulation distribution, industry group relative strength ratings, etc. The full list can be found on page 3.
Stocks boasting the highest ratings (hence, top growers with top-notch profitability) are selected, with a weight assigned depending on the composite score. The index is reconstituted and rebalanced weekly, which is why I call this strategy hybrid active/passive.
It would also boost its cash position to 50% in the case the market downturn is looming (assessed by a combination of four factors including “S&P 500 more than tripling in value over a 5-year time period”), in order to minimize the downside and pick promising stocks at a discount when the storm is over.
Its investment strategy is not limited to U.S. companies. Instead, FFTY embraces exposure to the U.S. quoted international stocks, even from emerging markets; for example, it allocated ~3% to Li Auto (LI), a Chinese EV player. Amongst developed-world names Equinor (EQNR), a Norwegian energy heavyweight, is worth mentioning; FFTY allocated ~2% to it.
The portfolio
As the dataset on its website illustrates, as of August 3, the fund’s largest investment shares in Celsius Holdings (CELH), a mid-cap generously valued growth player in the consumer staples sector, accounting for ~4.2%.
Speaking of the sector mix, FFTY is heavily invested in healthcare, with over 29% of the net assets deployed. It is also noticeably positive on the prospects of the mid/small-cap IT league which accounts for more than 20%.
Anyway, the sector weights are not set in stone; for example, the investor guide shows that in March 2021, FFTY was overweight in consumer discretionary (over 31%) and financials (17.6%).
Despite being growth-heavy, the current version of the FFTY portfolio also has a strangely material share of value stocks or those sporting a Seeking Alpha Quant Valuation rating of B- or better, around 37%. My point here is this is mostly the consequence of its tilt towards the smaller size companies that tend to trade with cheaper valuations compared to the sector medians; almost 67% of the holdings have a market value below $10 billion.
Meanwhile, the growth ratings are what FFTY can be justly proud of. I found out that ~75% of the portfolio has a Quant Growth grade of B- or better, a result nothing short of impressive. Quality is even better, as around 87% have at least B- Profitability rating.
I also delved a bit deeper, assessing earnings growth rates and Return on Equity. Specifically, ~61% boast a Forward EPS growth of at least 20%, while those that delivered a 20% 3-year EPS CAGR account for around 59%. Almost 69% of the holdings have an ROE of greater than 20%.
Unsatisfying performance with a few bright spots
Focus on earnings growth, due attention paid to quality, comparatively cheap valuation, and a mid-cap tilt. In fairness, a beautiful mix of factors. But did it deliver?
I would like to share a few tables illustrating that its earnings-focused quality strategy did have a few bright spots in the past, namely in 2017, but most time frames do not speak in its favor.
First, let us compare it with IVV. The cells when FFTY outperformed this bellwether cohort are highlighted with green.
Created by the author using data from Portfolio Visualizer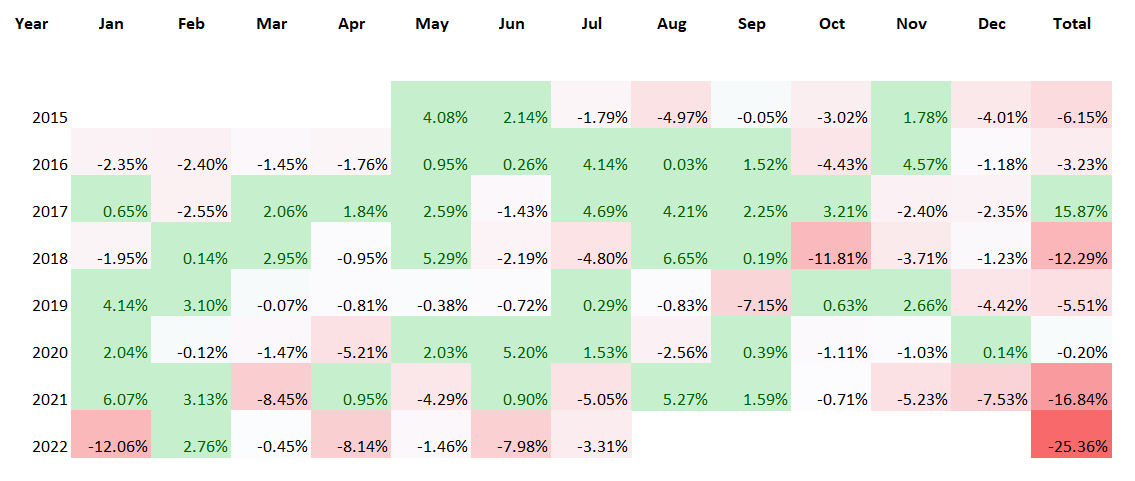
As my dear readers can notice immediately, they are aplenty. Yet annual results are relatively soft, and 2017 was the only year when the Innovator fund trounced the S&P 500, with a phenomenal margin. Then things went south in 2018. And risk-averse 2022 has been a sheer calamity for it, as it underperformed IVV by more than 25% in the first seven months.
What is especially surprising is that FFTY failed to underperform IVV in 2020 during the heyday of growth investing when billions were poured into the economy to stave off a painful lockdowns-induced recession, and the pandemic winners saw their market values rising meteorically. The market was bidding up multiples of growth players, precariously ignoring valuations, a backdrop looking entirely supportive of FFTY’s gains. Yet its total return was only on par with the S&P 500.
Now, QQQ vs. FFTY, which is a more fair comparison as some of my dear readers might point out.
Created by the author using data from Portfolio Visualizer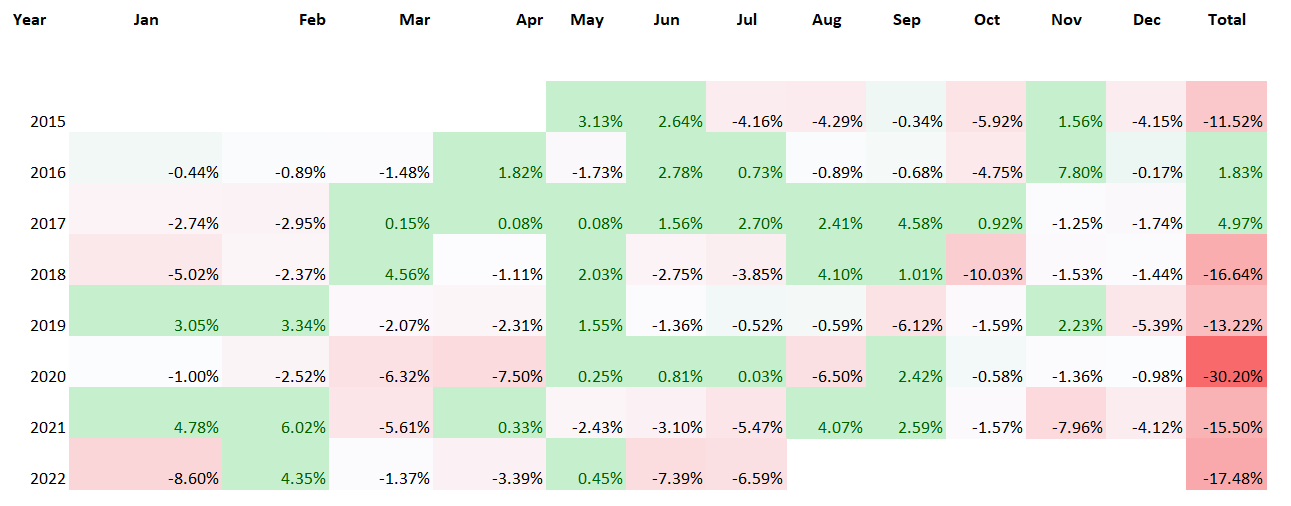
A similar story; we see a plethora of green cells, but when it comes to annual returns, the Innovator fund beat the Nasdaq 100 only twice, in 2016 and 2017. Even during the value rotation of 2021 and investor exodus from the growth echelon this year, QQQ fared better.
The next table adds a bit more color, comparing volatility characteristics, the CAGRs over the May 2015 – July 2022 period, and the risk-adjusted returns.
Created by the author using data from Portfolio Visualizer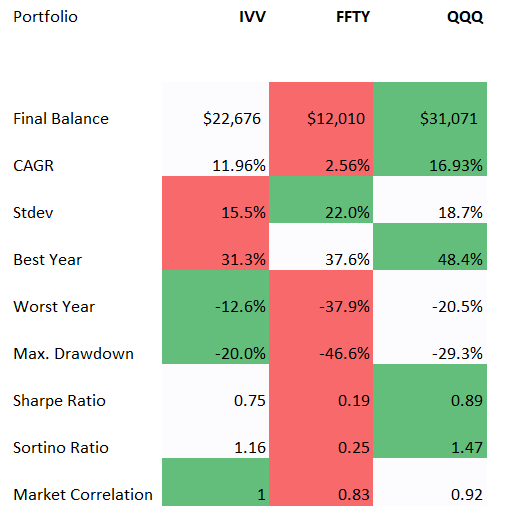
Again, it is tough to defend FFTY. Standard deviation is the largest, while the Sharpe and Sortino ratios are the lowest. The same applies to the CAGR achieved.
Elevated fees eat into returns
Certainly, for an investment vehicle with such a labyrinthine strategy and gargantuan turnover of 1,133% as mentioned in the prospectus, humongous fees are to be expected.
FFTY has a D Expenses grade, meaning its fees are almost 78% higher than the median of all other rated ETFs. There is no denying that the fund with an 80 bps is barely cheap. Stellar performance can justify higher fees, but FFTY’s returns were patchy in the past; for example, in 2020, expenses were more likely the principal detractor from the performance that hindered it from outperforming IVV.
Is FFTY a Buy? Final issues to consider
Betting on 50 U.S. and international winners and adjusting the portfolio weekly did not undergird FFTY’s alpha in the past. I would not say its strategy totally flopped. Certainly not. Of course, there are a few bright stops but they are not enough.
Let me be crystal clear, the strategy it relies on is beautifully calibrated. But returns and fees disappoint me. The rating is a Hold, at best.
Be the first to comment