

Andrii Yalanskyi/iStock via Getty Images
Thesis
The Flaherty & Crumrine Preferred and Income Securities Fund (FFC) is a closed end fund which has high current income and capital preservation as its investment objectives. The vehicle invests its cash in a portfolio of preferred securities, mainly from the banking and insurance sectors. The asset manager for the fund is Flaherty & Crumrine, a boutique premier asset manager in the preferred securities space with an enviable track record. The CEF has very good 5- and 10- year total returns which stand at 7.8% and 9.6%, respectively. The fund has a long history having been started in 2003, and has been slightly NAV accretive in the past ten years. FFC exposes a high Sharpe ratio of 0.64 (as measured on a 5-year basis) and a fairly low standard deviation of 12.88. As described above, the fund focuses on bank and insurance preferred shares with a profile that tends to be overweight investment grade ratings (Baa ratings for 42% of the portfolio). While historically rising interest rates have not significantly affected the portfolio performance, we do see a downdraft in prices during the beginning of each Fed tightening cycle. As the Fed raises rates the underlying assets are going to keep being under pressure, albeit at a much smaller degree than classic fixed income bonds. We are seeing the same price performance in FFC now, with the fund having a negative performance year-to-date and a premium to NAV that has shrunk to almost zero. The fund also has a tax advantage angle with most of the 2021 distributions being labeled as qualified dividends. These types of dividends end up being taxed at the lower long-term capital gains tax rate. We like FFC and its historical risk/rewards metrics but we anticipate further weakness from a pure price perspective, with a flat or modest negative total return in the next six months due to the aggressive rates path pursued by the Fed. We are rating FFC as Hold for now. A retail investor looking to deploy new capital into this fund is best suited to wait for another -5% sell-off and the presence of a discount to net asset value.
CEF Metrics
This section details some CEF metrics and overall fund analytics:
Leverage Ratio: 33%
- Leverage is on the higher side
Expense Ratio: 1.82%
Manager: Flaherty & Crumrine
- Independent, employee-controlled investment adviser
- One of the oldest and most experienced firms specializing in the management of preferred securities
Yield: 7.21%
- Average for the asset class.
Discount/Z-Stat: 0.85% / -1.88
- The fund is currently trading at a premium.
AUM: $0.95 billion
- The fund has a high AUM for the asset class
Holdings
The top holdings for the fund are composed of large bank securities:
Top 10 Issuers (Fact Sheet)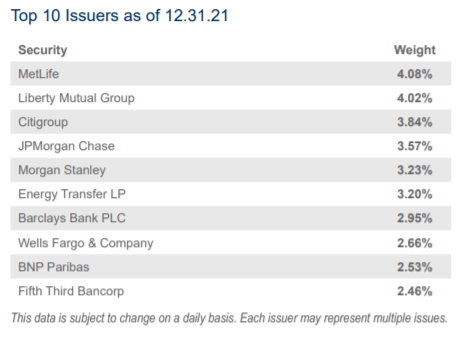
We can see that we do have a bit of concentration in a couple of names (i.e. total net exposures above 3%), but those names are extremely large Tier 1 institutions outside Energy Transfer LP.
Banks remain the favorite credits for the fund, as reflected by the high allocation to the sector. Bank balance sheets strengthened through the pandemic, and the credit outlook is very positive given the rising interest rate environment. Insurance companies have also done well, although insurers’ earnings continue to be a step behind banks due to lower investment yields and higher catastrophe losses recently:
Sector Allocation (Fund Fact Sheet)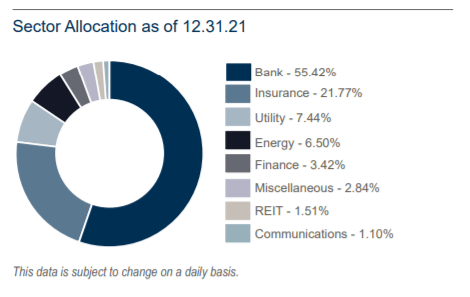
While the portfolio is tilted towards investment grade names, the fund runs very significant credit risk:
Credit Quality (Fact Sheet)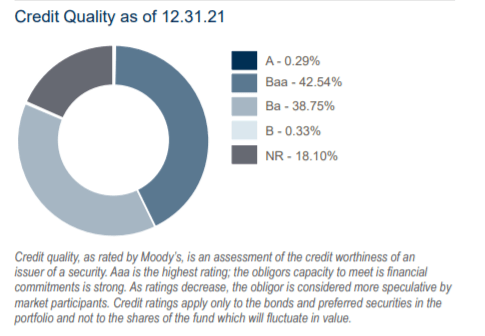
In effect the credit profile of the fund gives us a flavor for its historical performance – while not greatly affected by a rising interest rate environment, the fund has experienced drawdowns on the back of credit spread widening events as witnessed at the end of 2018.
Performance
The fund is down -3.5% from a total return perspective in the past year due to the increasing interest rate environment and narrowing of the premium to NAV:
Total Return 1-Year (Seeking Alpha)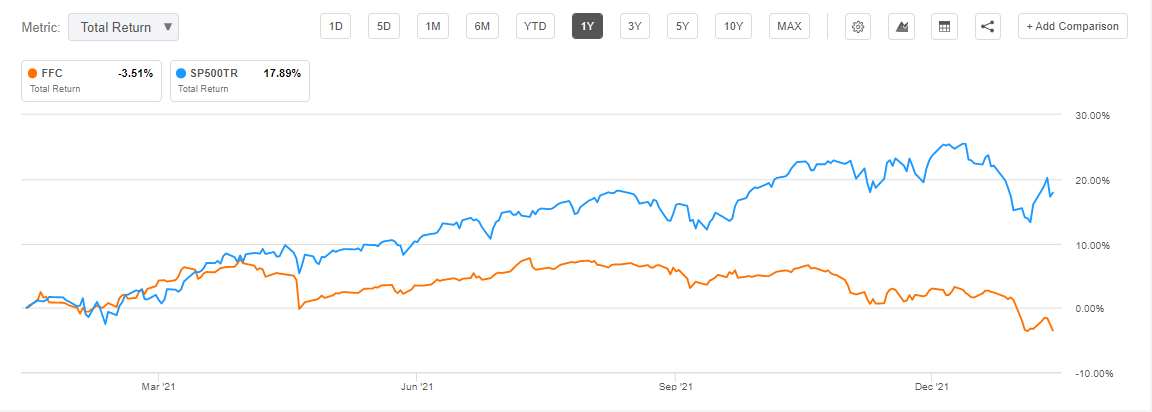
While most of the underlying securities are fixed-to-floating, they are nonetheless paying a very high spread on the floating rate even when they convert:
Fixed to Floating Portfolio Allocation (Fact Sheet)
This feature coupled with the long predicted maturity date on most of the securities creates a long duration profile for the portfolio which translates into interest rate sensitivity and NAV depreciation as interest rates rise.
The fund lost value during the initial stages of the past Fed tightening cycle but subsequently recovered robustly:
Total return 2013-2015 (Seeking Alpha)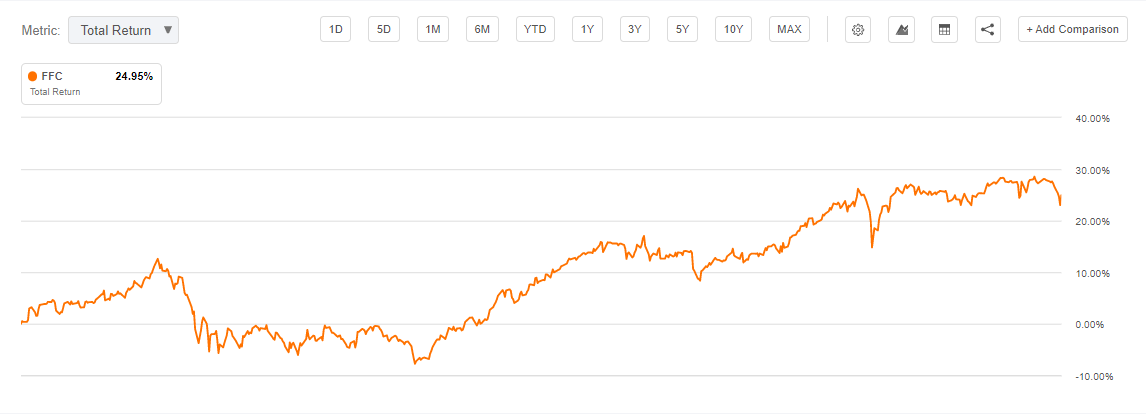
We can see from the above that the fund lost value from a total return perspective in the initial stages of the last Fed tightening cycle when the tapering was announced, and subsequently on the announcement of the first interest rate hike in 2015. This time around the cycle has been much more compressed with certain participants talking about a 50 bps raise in March 2022. This will translate to significant NAV pressure for the CEF in the first half of 2022.
On a long-term basis the fund experiences significant drawdowns only during notable credit events / market risk-off periods:
Drawdowns (PortfolioVisualizer)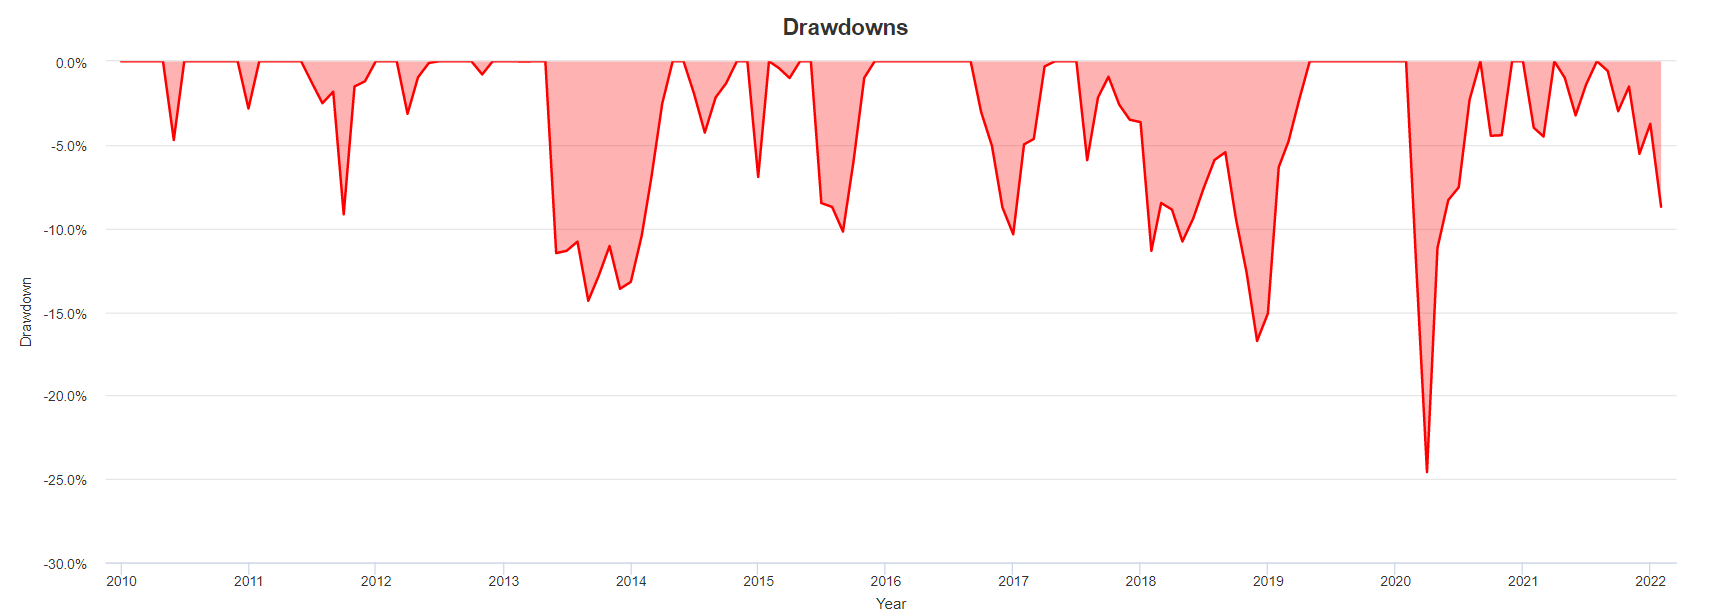
We can observe the late 2018 market sell-off drawdown and the Covid induced sell-off were the most severe experienced by the fund.
The fund has a very similar performance to its sister fund FLC:
Historical Performance (Seeking Alpha)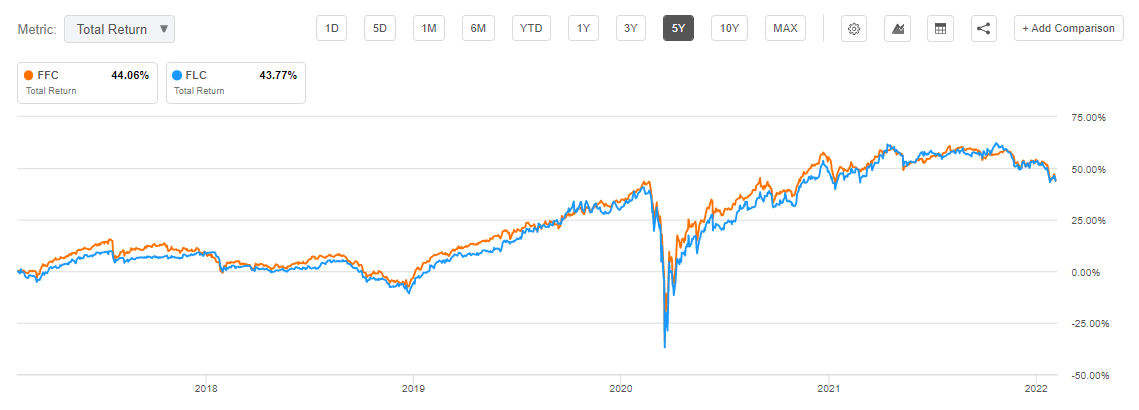
We can observe that the small sister fund from Flaherty & Crumrine tracks closely the overall performance throughout time.
Premium/Discount to NAV
The fund tends to trade at a premium to NAV for long periods of time:
Premium to NAV (Morningstar)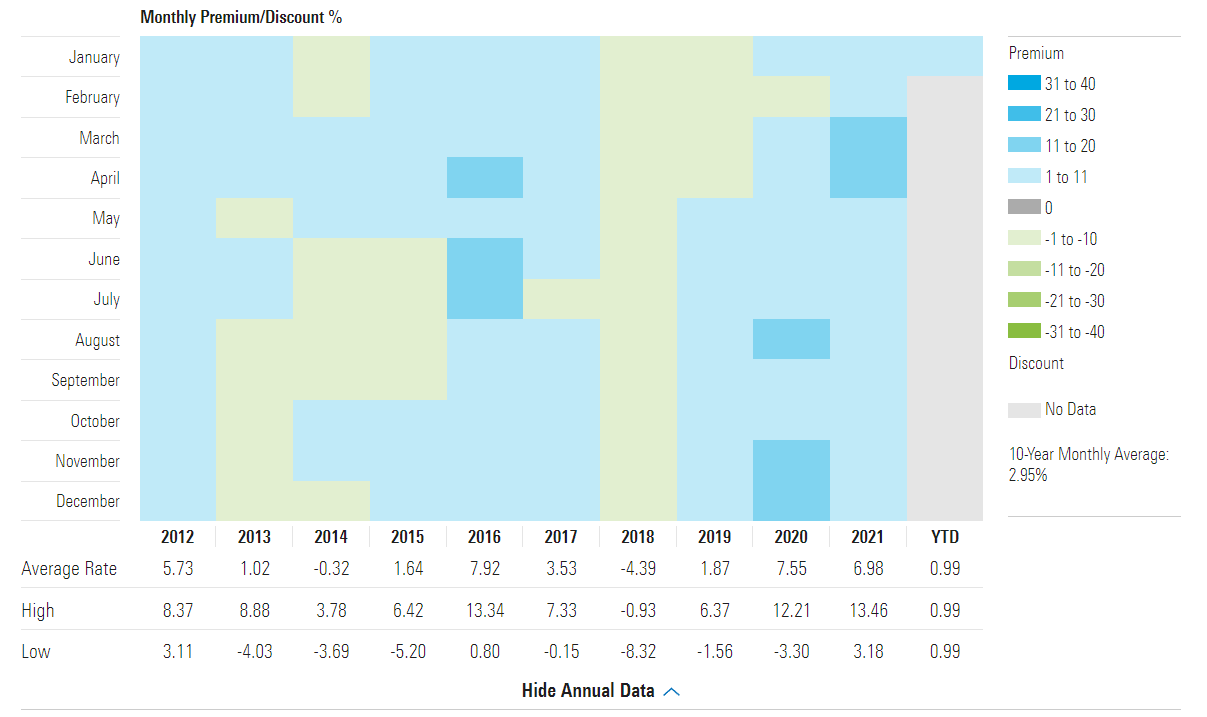
In the above graph the blue area are the periods of time when the fund was trading at a premium to its net asset value. We can notice that outside of 2018 and the other tightening cycle in 2013-2015 the fund has a propensity to have a market value above net asset value. As we are entering an aggressive tightening cycle we believe this CEF will start occasionally to trade at a discount to NAV, especially on the back of risk off scenarios.
Dividends
The fund dividends have varied throughout time with a small degree: Dividend History (Fund Website) We can note that the fund both cut and increased its dividend in the past years.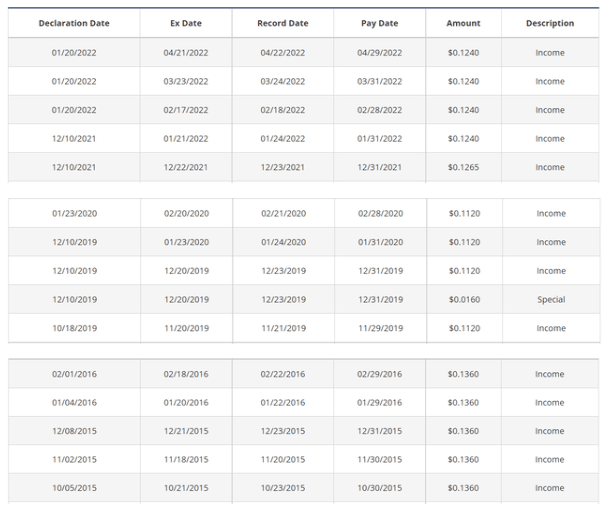
To also note that the fund offers a tax-advantageous wrinkle through its high qualified dividend income distribution:
2021 Tax Information (Fund Website) Qualified dividends are ordinary dividends that meet specific criteria to be taxed at the lower long-term capital gains tax rate rather than at higher tax rate for an individual’s ordinary income.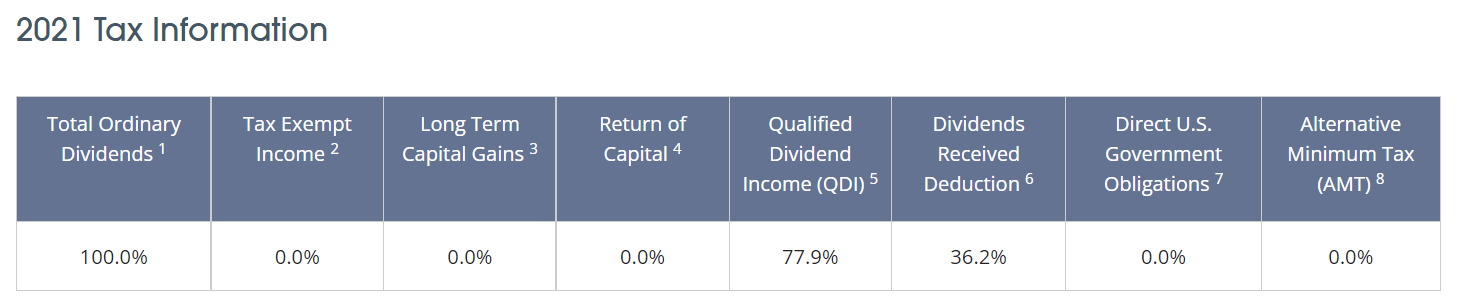
Conclusion
Coming from a boutique asset manager with significant experience in this niche sector FFC is a robust well proven long-term investment. Its main risks lie with credit spread widenings and overpricing due to premiums to NAV. The fund tends to weaken in the first innings of a Fed tightening cycle, a performance we are witnessing as we speak. Well set up as a long term buy-and-hold vehicle FFC needs to be entered at an attractive point. We are rating FFC as Hold for now. A retail investor looking to deploy new capital into this fund is best suited to wait for another -5% sell-off and the presence of a discount to net-asset-value.
Be the first to comment