

-Oxford-
FedEx Q1 earnings recap and thesis
FedEx (NYSE:FDX) just reported disappointing results for its FY2023 Q1, and the market response was truly brutal. The bloodbath started on Sept. 16 after FDX reported its preliminary Q1 as you can see from the chart below. Its results missed estimates, largely due to global volume softness, and the market responded with a 21% price decline. The issues FDX was facing are sector-wide as reflected in the price movement of its close peer United Parcel Service (UPS).
Source: Seeking Alpha and YCharts data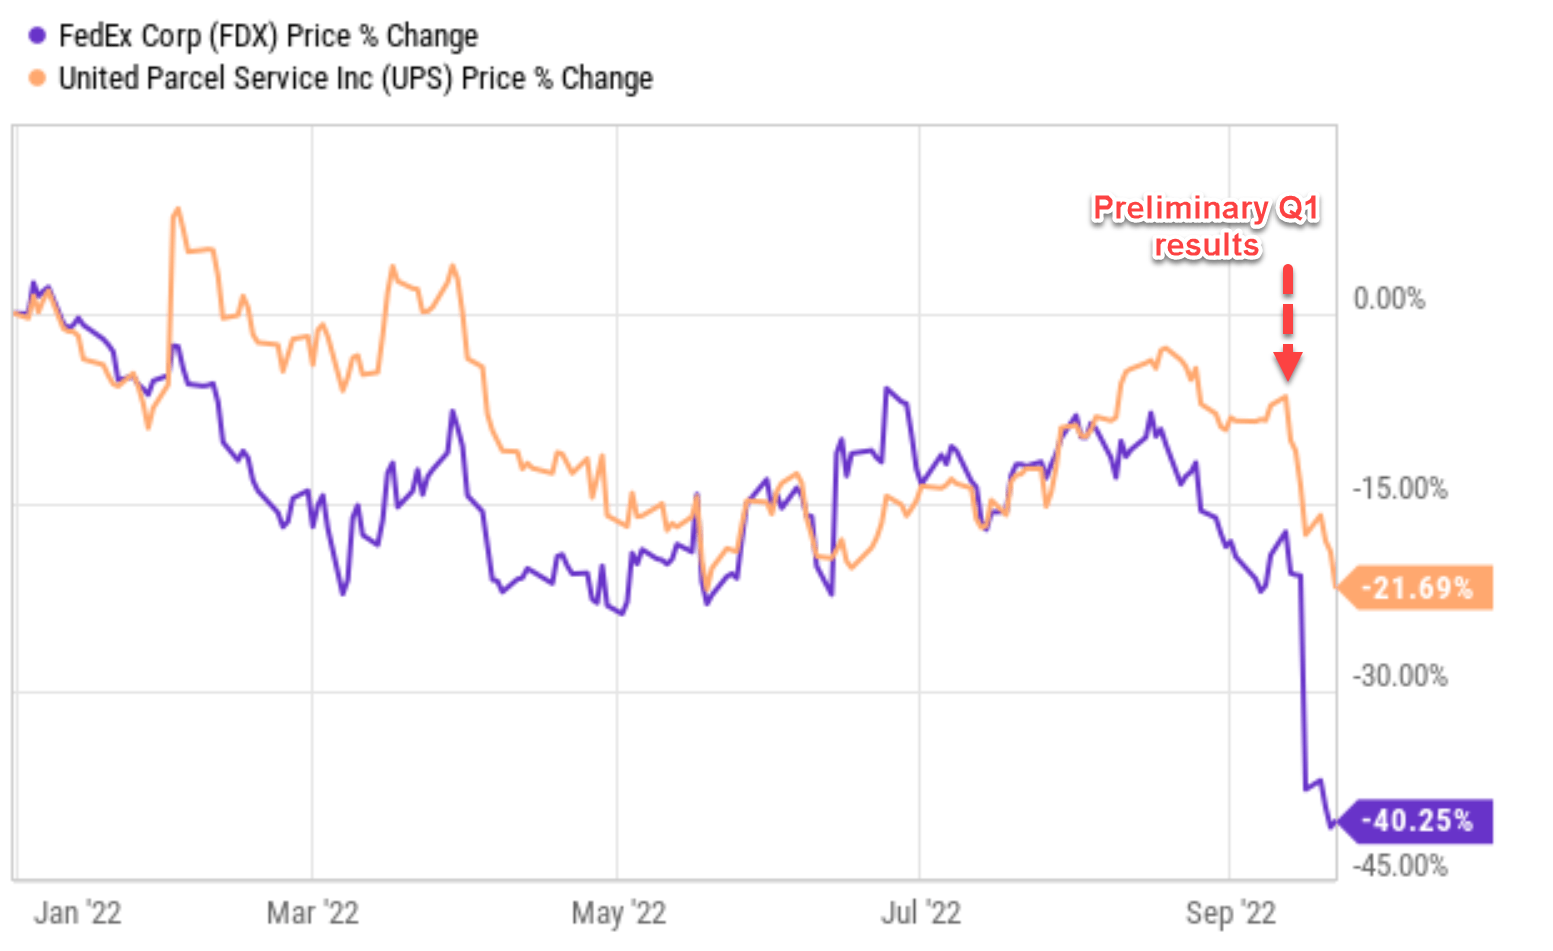
The selling pressure continued after the company reported its earnings release (“ER”) yesterday, as you can see. All told, the stock price has plummeted from about $205 per share before reporting the preliminary results to the current level of $155 as of this writing, a decline of 39%. And by the way, such a decline would take a 64% rally to break even.
By this time, I assume you already have fully digested the ER and plenty of other SA authors have provided deep dives already. And I will just quickly go over a few key points of relevance to the subsequent analysis in this article. Overall, it’s a disappointing quarter. Total revenues came in at $23.2B, a growth of 5.5% YoY, though missing consensus estimates by $580M. What’s truly concerning is the bottom line. On a GAAP basis, as seen from the chart below, the operating margin has shrunken by more than 130 basis points from 6.4% a year ago to 5.1%. As a result, despite the growth in the top line, both operating income end EPS have decreased substantially, by about 15% and 19%, respectively.
Because the price movement is so much more than fundamentals, the stock valuation is currently at a cyclical low. And my thesis here is that the downside has been fully priced in already, and the investment now actually offers solid return potential in the long term, as we will discuss immediately next.
Source: FDX Q1 press release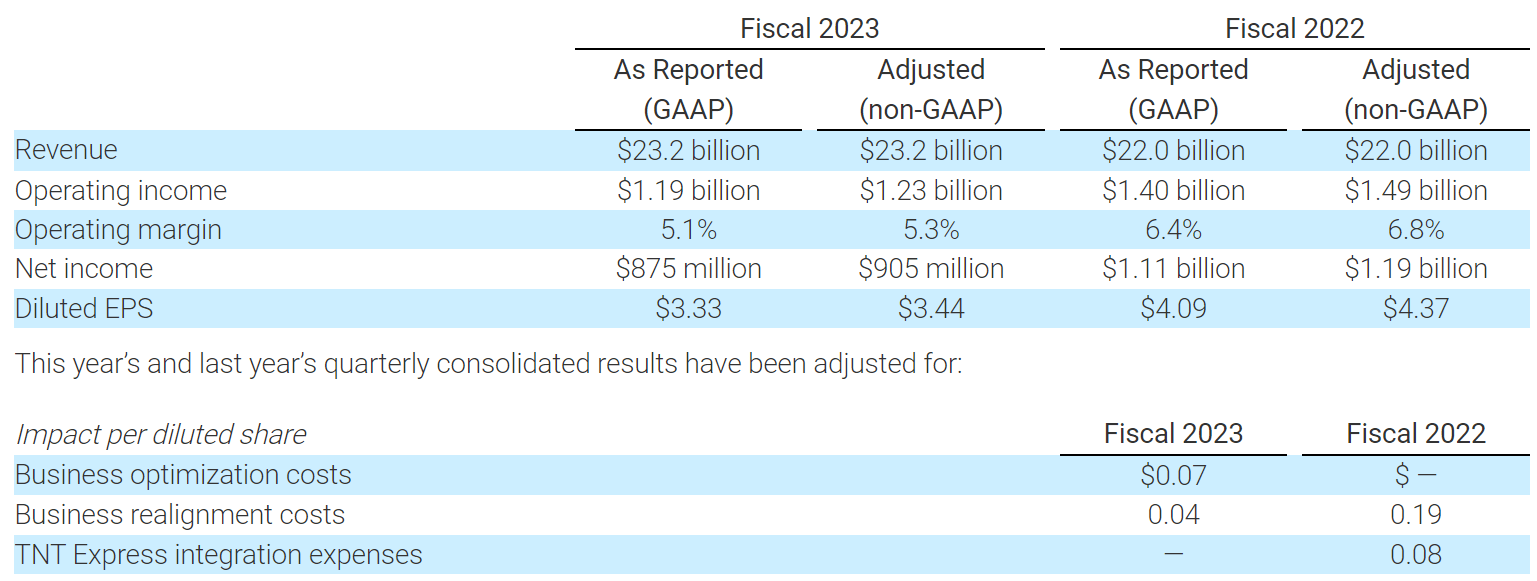
FDX stock valuation is at a cyclical low
As just mentioned, the stock valuation is currently at a cyclical low, as you can see both from its dividend yield and price/cash flow multiples in the next chart. The recent large price corrections have sent its dividend yield to 2.46%. To put things under perspective, the dividend yield for FDX has fluctuated in the past decade between 0.38% to 2.87% with an average of 0.93%. Thus, its current dividend yield of 2.46% is not only far above its historical average by also close to the peak level of 2.87% (which occurred during the peak of the COVID fire sale). The price/cash flow multiple shown in the bottom panel of this chart paints the same picture. As seen, its current price to CFO ratio is only 4.18x. And again, it’s not only far below its historical average of 9.2x but also essentially at the lowest level in a decade.
Given the consistency in the signal sent from both valuation metrics, this article will use the dividend yield for the remainder of this analysis. A yield near 2.5% is becoming of interest to income-oriented investors. Even for investors who do not focus on dividends, the results in this article should still provide a unique window to look into its finances holistically. After all, dividends are the most direct and reliable financial data – probably the only piece of financial information that’s not subject to any subjective interpretation.
Source: Seeking Alpha and YCharts data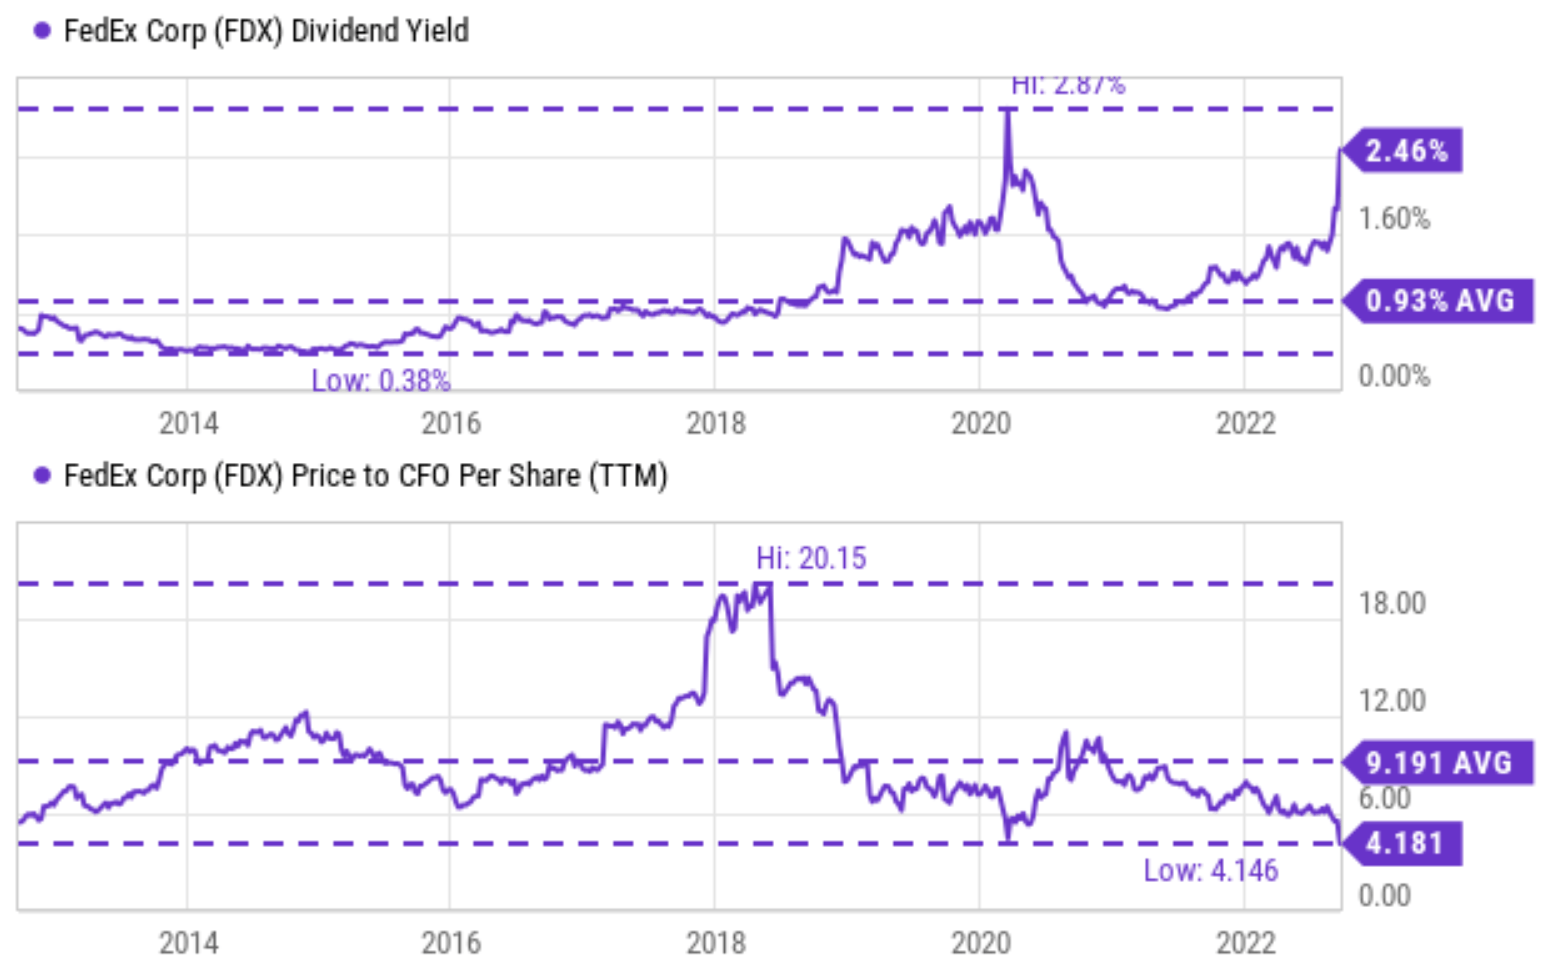
FedEx dividend cushion ratios
The next chart shows the commonly quoted earnings payout ratio for FDX and UPS in the past 10 years. As long-term dividend payers, both FDX and UPS have been doing a consistent job of managing their dividend payout. And FDX’s payout ratios have been consistently below UPS as seen (except for the outlier data point in 2019). FDX’s current payout ratio is 20.7%, substantially below UPS’ 39.2%. Compared horizontally against its own history, its current payout ratio of 20.7% is also below its long-term average paled ratio of 33% (again with the outlier data point in 2019 excluded) by a good margin.
Source: Seeking Alpha and YCharts data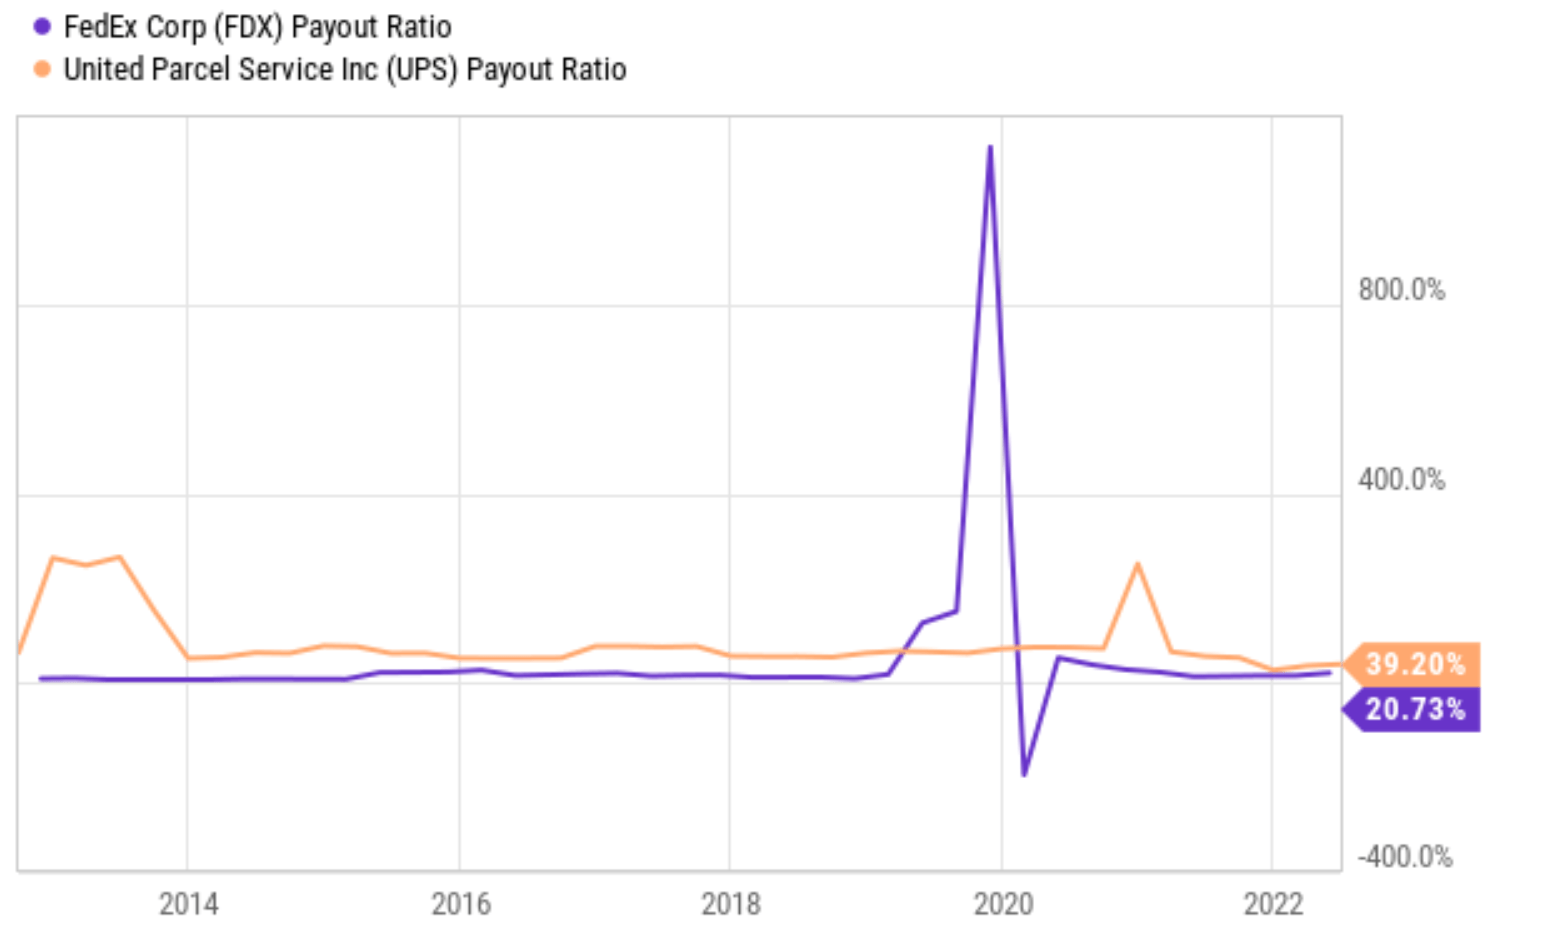
Next, we will examine its dividends and overall financials a bit deeper. As detailed in my earlier article here, the major limitations of the above simple payout ratios are twofold:
- The simple payout ratio ignores the current asset that a firm has on its balance sheet. Obviously, for two firms with the same earnings power, the one with more cash sitting on its balance sheet should have a higher level of dividend safety.
- The simple payout ratio also ignores the upcoming financial obligations. Again, obviously, for two firms with the same earning power, the one with a lower level of obligations (pension, debt, CAPEX expenses, et al) should have a higher level of dividend safety.
The above simple payout ratios ignore all these important pieces. For a more advanced analysis of dividend stocks, we find the so-called dividend cushion ratio an effective tool. A detailed description of the concept can be found in Brian M Nelson’s book entitled Value Trap. And a brief summary is quoted below:
The Dividend Cushion measure is a ratio that sums the existing net cash (total cash less total long-term debt) a company has on hand (on its balance sheet) plus its expected future free cash flows (cash from operations less all capital expenditures) over the next five years and divides that sum by future expected cash dividends (including expected growth in them, where applicable) over the same time period. If the ratio is significantly above 1, the company generally has sufficient financial capacity to pay out its expected future dividends, by our estimates. The higher the ratio, the better, all else equal.
Note that our following analysis made one revision to the above method. Instead of subtracting the total long-term debt, we subtracted the total interest expenses over a past five-year period. The reason for this revision is to adjust the status of businesses such as FDX. Mature businesses like these probably will never have the need to repay all of their debt at once. But it does need to have enough earnings to service its debt (i.e., cover the interest expenses).
With this background, the dividend cushion ratios for FDX and FDX are calculated and shown below. As can be seen, FDX has been improving its dividend cushion ratio consistently since 2018, when its cushion ratio bottomed at 0.52x. Since then, it has been strengthening its overall financials continuously. As a result, the cushion ratio climbed steadily and reached a peak level of 3.71x based on TTM 2022 financials. As aforementioned, a cushion ratio of 1x is regarded as the threshold for a safe dividend. In FDX’s case, its current cushion ratio is at 3.71x, substantially above the threshold level.
Indeed, the headwinds on the horizon will pressure its cushion ratio as you can see from my projections below. However, the impact would be minimal, and its cushion ratio will only slightly decrease from the peak level of 3.71x to 3.64x. And my forecast is based on the following assumptions:
- An expected capital spending of $6.3B for FY23.
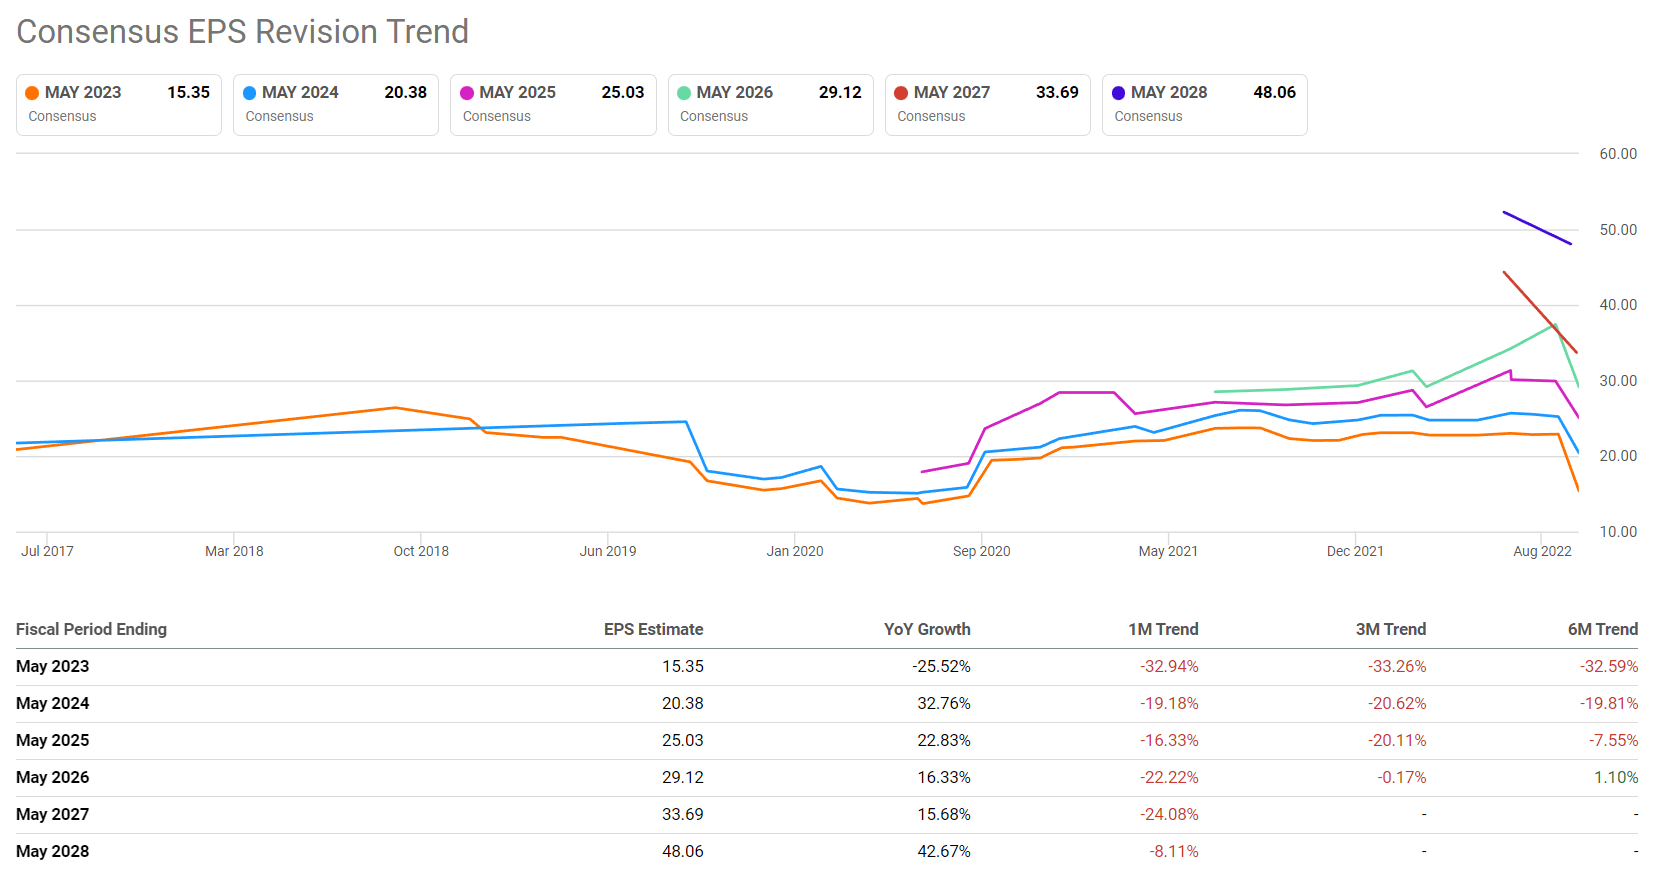
- A 20% decrease in earnings based on consensus forecast as seen in the second chart below.
- And an annualized dividend of $3.8 per share (assuming it maintains its $1.90 per share semi-annual payout).
Based on these assumptions, its cushion would take a small impact and be thinned to 3.64x, still a strong level. To put it another way, such a cushion ratio indicates that FDX won’t have to cut dividends even if it suffers earnings hiccups (like what it is experiencing now) for about 3.5 years in a row.
As such, I don’t see a possibility of a cut, not even remotely. And for investors who subscribe to the idea of using dividends as a window to look into a company’s finances, such a thick cushion ratio also indicates its strong finances holistically.
Source: Author based on Seeking Alpha data Source: Seeking Alpha data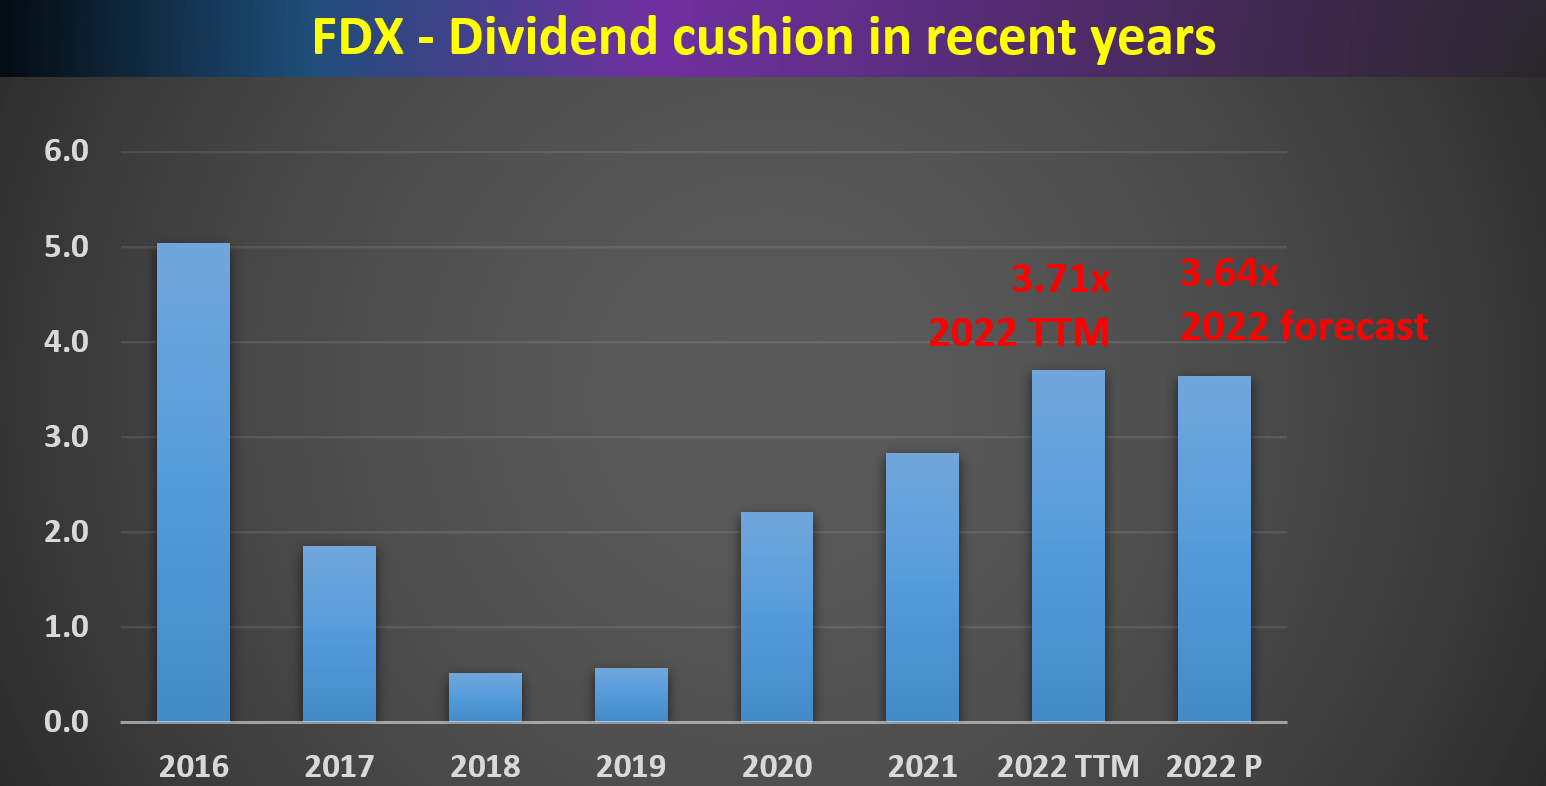
Other risks and final thoughts
Despite the compressed valuation and safe dividends, there are plenty of risks to consider, especially in the near term. There are a series of macroeconomic risks ranging from geopolitical risks to a recession. These risks are best summarized by the following comments from its press release (abridged by me).
… additional COVID-19-related business restrictions, successful completion of the planned stock repurchases during the second quarter, and no additional adverse geopolitical developments.
Specific to FDX itself, the volume shrinkage and cost raise are likely to persist into the near future given the current conditions of the global supply chain congestion and inflation. As a result, the company has to trim its FY23 capital spending a bit to $6.3B, down from its prior outlook of $6.8B.
On the positive side, the company has a sound cost reduction plan and a long-term vision. CEO Raj Subramaniam puts a greater emphasis on revenue quality. It also plans to use technology and data to support higher yields and better capital efficiency. These changes are capsulated in its Network 2.0 initiative. The initiative aims to facilitate greater collaboration between the various business and remove redundancies between Express and Ground while increasing route efficiency. As CEO Raj Subramaniam commented in the ER (abridged and emphases added by me):
Our team has already started implementing cost reductions under this program and this will ultimately enable Network 2.0, the long-term end-to-end trend optimization of our network. Sriram Krishnasamy, our newly appointed Chief Transformation Officer, will facilitate DRIVE and continue reporting directly to me. In total, we expect to take out an additional $4 billion in costs related to DRIVE by fiscal year 2025… These transformational changes will lay the foundation for Network 2.0, which will create an additional $2 billion benefit over the long term.
To conclude, my verdict is that the market response to FDX’s Q1 FY2023 results is overblown. The overreaction has created an entry opportunity for long-term investors to buy the stock at a cyclical bottom valuation, despite its growth catalysts and overall financial strength. To be sure, there are plenty of headwinds, possibly strong headwinds, in the near future. But for long-term investors who can wait out the near-term volatility, the long-term return potential is very appealing.
Be the first to comment