

DOW JONES, HANG SENG, ASX 200 INDEX OUTLOOK:
- Dow Jones, S&P 500 and Nasdaq 100 indexes closed -0.54%, -0.72% and -0.85% respectively
- Stocks pulled back as investors assessed tapering risk after a Fed official gave hawkish comments
- The Hang Seng and ASX 200 indexes may fall following a sour lead from Wall Street
US Earnings, Fed, RBA, BoE, Nonfarm Payrolls, Asia-Pacific Week-Ahead:
Investors eye a busy week ahead, with US earnings, RBA and BoE interest rate decisions, US and Chinese trade data, as well as US nonfarm payrolls figures in focus. Mainland Chinese markets are shut for the Labour Day holiday and will resume trading on Thursday. Japanese markets are also closed on Monday. Therefore, there will be lower liquidity and fewer participants on the first day of May in Asia-Pacific trade.
Wall Street equities pulled back broadly on Friday as a Fed official hinted at rising tapering risks. Signs of excessive risk-taking suggest it’s time to start debating a reduction in bond purchases, said Robert Kaplan, president of the Dallas Federal Reserve. His hawkish rhetoric stocked market fear about tapering risks, pulling US equity benchmarks from their record highs.
The US earnings season continued to deliver positive surprises. Around 60% of S&P 500 companies reported their Q1 results so far. Among those, more than 86% have beaten market expectations. According to data compiled by FactSet, the blended earnings growth rate for the first quarter is 45.8%, much higher than the previous forecast of 23.8%. In aggregate, companies are reporting earnings that are 22.8% above the estimates, which is far above the five-year average of 6.9%. All eleven S&P 500 sectors reported stronger-than-expected EPS growth rates, led by consumer discretionary (+181.6%), financials (+133.7%) and materials (57.1%).
This week, 139 S&P 500 companies, or 28% of the index’s constituents will release their Q1 results. Looking further ahead, analysts project double-digit earnings growth for the remaining three quarters of 2021, with a peak expected in Q2 at 58.3%. These above-average growth rates are attributed to both a faster pace of economic recovery and a low-base effect.
US Q1 Earnings Highlights
Source: Bloomberg, DailyFX
Asia-Pacific markets look set to kick off the week on the backfoot. Futures in Australia and Hong Kong are in the red despite a mild rebound in the US. A worsening pandemic situation in India casts a shadow over Asia-Pacific markets, as investors assess the risk of reopening delays and stricter border controls. Singapore saw a rising number of community Covid-19 cases after a cluster was found in a local hospital. The country has reinstated some social distancing rules and tightened border restrictions.
Looking ahead, RBA and BoE interest rate decisions lead the economic docket alongside trade data and US nonfarm payrolls numbers this week. Meanwhile, oil traders will eye Wednesday’s API crude inventory data for clues about the supply and demand relationship. Find out more from theDailyFX calendar.
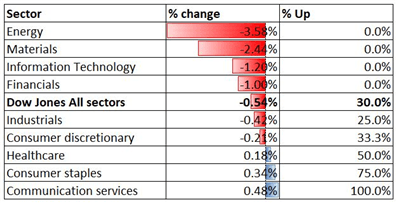
Looking back to Friday’s close, 6 out of 9 Dow Jones sectors ended lower, with 70% of the index’s constituents closing in the red. Energy (-3.58%), materials (-2.44%) and information technology (-1.20%) were among the worst performers, while communication services (+0.48%) and consumer staples (+0.34%) outperformed.
Dow Jones Sector Performance 30-04-2021
Source: Bloomberg, DailyFX
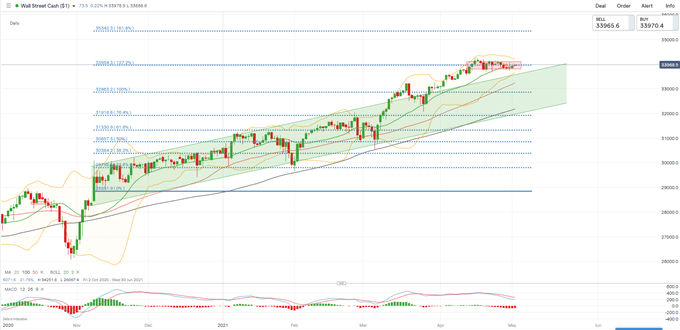
Dow Jones Index Technical Analysis
The Dow Jones index has hovered near the 127.2% Fibonacci extension level over the last two weeks, resulting in a narrowing Bollinger Band width. The MACD indicator has formed a bearish crossover and trended lower since, suggesting that upward momentum is fading. An immediate support level can be found at the 50-day SMA line (33,220), whereas 34,000 remains a key resistance.
Dow Jones Index – Daily Chart
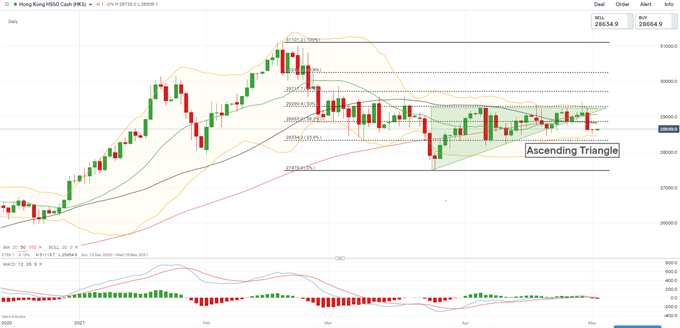
Hang Seng Index Technical Analysis:
The Hang Seng Index (HSI) broke down out of an “Ascending Triangle” chart pattern, potentially paving the way for further losses with an eye on 28,334 (the 23.6% Fibonacci retracement) for support. A large bearish candlestick formed last Friday showed strong near-term selling pressure. The MACD indicator formed a bearish crossover near the neutral midpoint, suggesting that momentum is tilted to the downside.
Hang Seng Index – Daily Chart
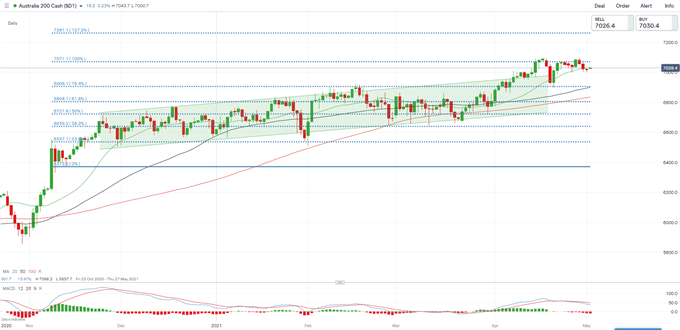
ASX 200 Index Technical Analysis:
The ASX 200 index appears to be hitting a key resistance level at 7,070 – the 100% Fibonacci extension. A firm breakout above 7,070 would likely open the door for further upside potential with an eye on 7,260 – the 127.2% Fibonacci extension. A deeper pullback from here may lead to a test of the 76.4% Fibonacci extension (6,906) for support. The MACD indicator has turned bearish, suggesting that a technical correction may be underway.
ASX 200 Index – Daily Chart
— Written by Margaret Yang, Strategist for DailyFX.com
To contact Margaret, use the Comments section below or @margaretyjy on Twitter
Be the first to comment