

Economic Composite
I updated my economic composite to reflect the release of the U.S. Labor Department’s employment report on March 6. The report showed a rise in nonfarm employment of 237,000 in February. The number was better than the consensus estimate of 175,000. But nonfarm is a concurrent economic indicator at best, so this month’s gain was not particularly interesting.
Temp employment, however, is a leading indicator. The number of temps in February fell 3,000 from the previous month. On annual basis, temps were off 3.2%. This followed a weak month in January, when temps declined 2.8% year over year.
This year’s annual revisions to the BLS establishment data revealed that temp employment was not as strong as originally reported. Recall that each year the BLS provides revisions to the establishment data with the release of the January employment report (i.e., the report of January data, released in early February). Typically, these revisions are minor. But this year, the monthly temp figures for 2019 were revised down nearly 3%. For all of 2019, the average change in temps from month to month was a decline of about 3,500.
Long-time readers will also recall that, starting in June, I was pointing out that sluggish temp numbers were weighing on scores for the economic composite – not only from the BLS data series but also from the American Staffing Association’s data. At that time, I first put the prospects for economic growth “under watch.” One month later, the inverted yield curve inversion added to my concerns. As a result of the sluggishness in the monthly BLS data and the quarterly ASA data, the economic composite has been negative since June 2019.
I’ve reined in my estimates for temp employment in the near term. From what I see in my work as an equity analyst, companies are facing considerable top-line pressure in the first quarter, due to supply chain disruptions. And there doesn’t seem to be much clarity as to whether the lost revenue will be made up in the June quarter. As a result, managements are looking to bring costs in line with expected revenue. Temporary labor is typically an easy expense to cut. I look for the declines in the next few months to be worse than in January and February.
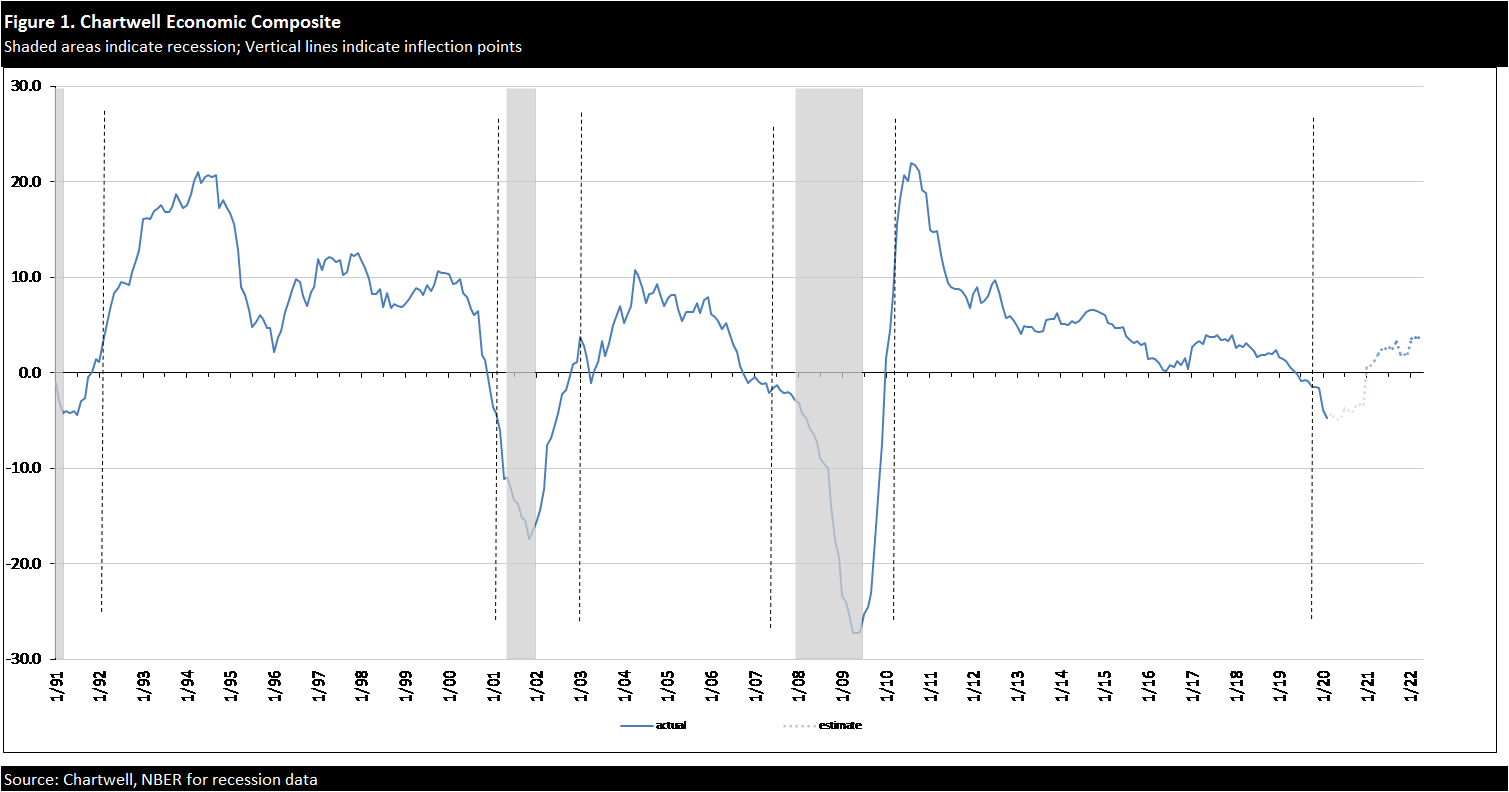
The data now shows that the economic composite solidly and sustainably crossed the x-axis in the final quarter of 2019. For the next six months, the economic composite is likely to range from -4.0 to -5.0. The historical trend has been for the economy to slip into recession within six months of such a cross. I wouldn’t be surprised by a flat read on GDP from the Commerce Department for 2Q20. The question now is, will the slowdown be short and shallow or more pronounced. The answer is likely to come when we see how aggressively companies lay off temps in the months ahead.
The next Employment Situation report is scheduled to be released on Friday, April 3. I expect to provide an update to the economic composite shortly after the report comes out.
Figure 1 below shows the actual monthly values of the economic composite from 1991 through the present and the estimated values through the middle of 2020. In general, the composite remains positive during periods of economic expansion and turns negative during periods of recession. The vertical dashed lines mark the inflection points when the economy is poised to enter recession or has safely exited recession. It typically takes three consecutive months of a change in sign (from positive to negative and vice versa) to confirm a change in outlook.
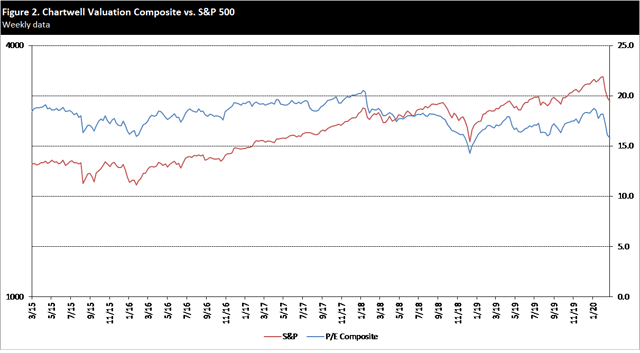
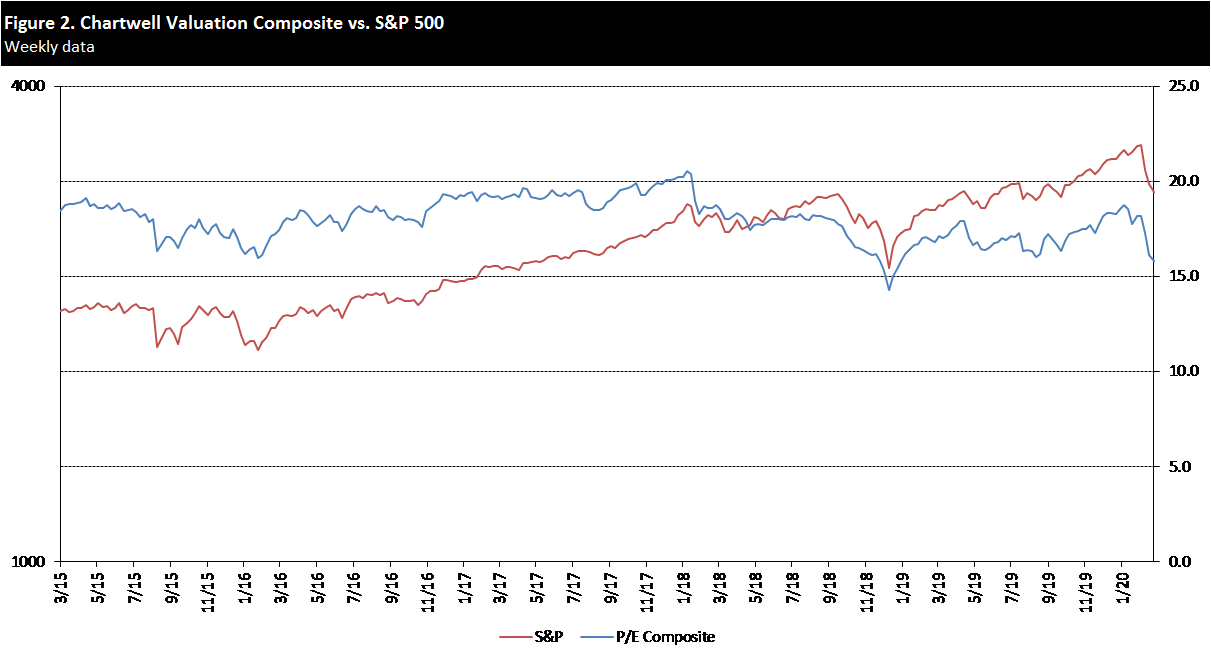
Valuation Composite
My composite of publicly available forward P/E estimates puts the current forward P/E on the S&P of 2,940 (mid-day March 6) at 15.8. With the model signaling a slowdown, I think this is overvalued.
For comparison, during the last major market correction in December 2018, the P/E fell to 14.0. That would suggest the market could reasonably fall another 10%. And during the depths of the last recession, at the market low in March 2009, the S&P was trading at 10.5. If the market were to retrace those lows, that would imply over 30% downside.
In my January report, I cautioned investors about the valuation of the S&P, in light of what was then an uncertain outlook. I suggested a more attractive level was 2,800, but I now caution against that. Instead, investors ought to wait for a sustained pick-up in temp employment, which would indicate that business fundamentals are improving.
A five-year chart of the valuation composite and the S&P 500 is below. Despite the recent steep decline in the S&P, I think stocks are overvalued. The market PE has yet to fall as far as it did during the market correction of late 2018.
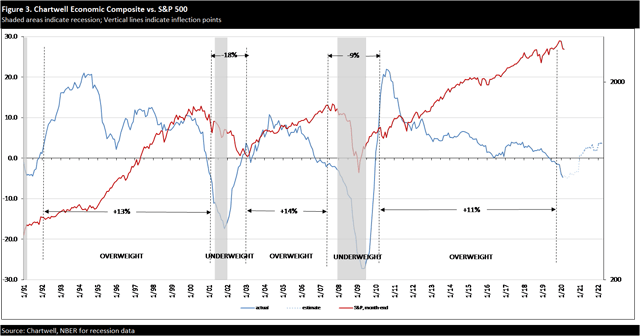
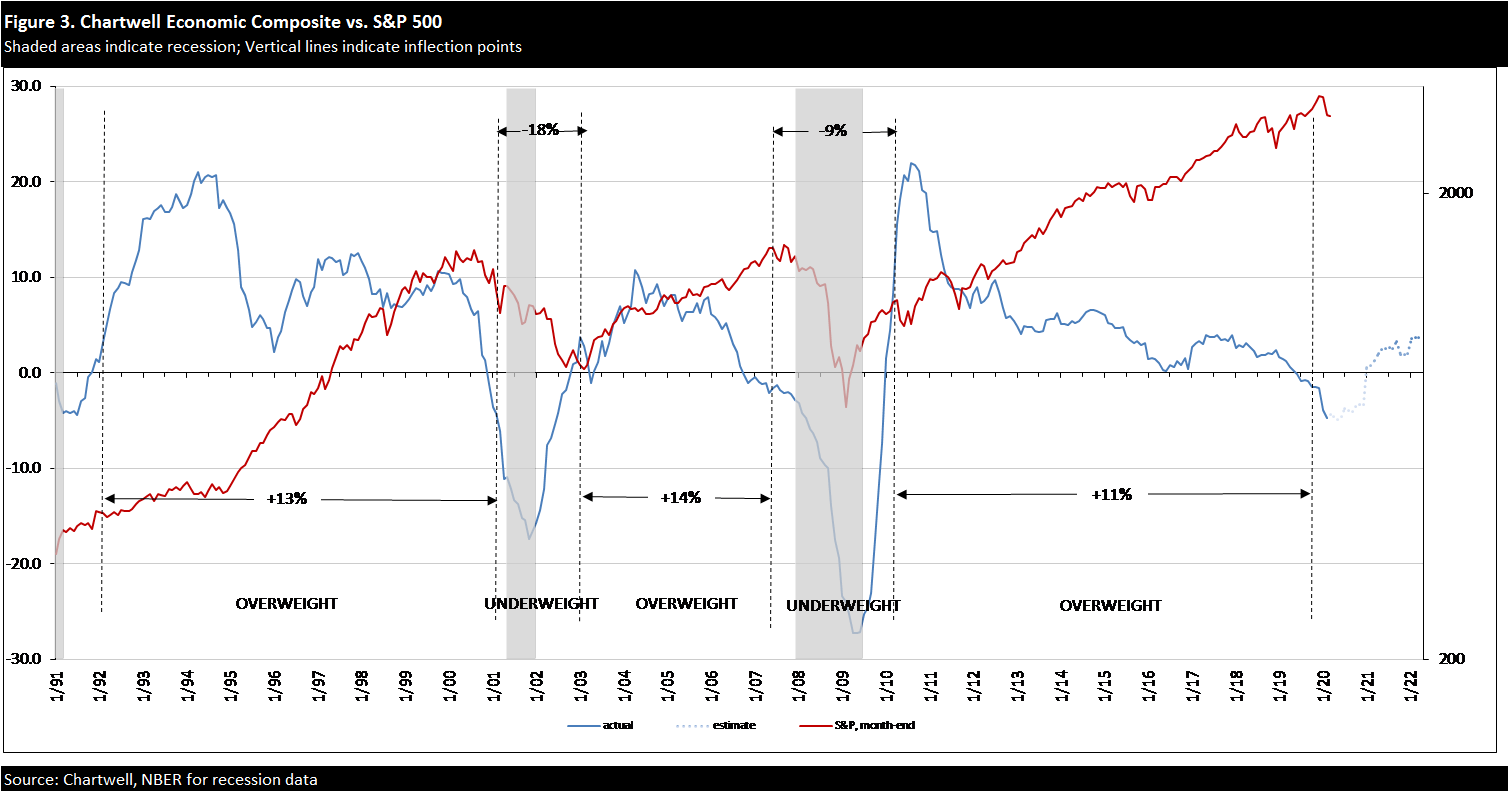
 Track Record
The model’s historical record is depicted in the chart below. The economic composite predicted the beginning and end of the 2000 recession and the 2008 recession. It also predicted the end of the early 1990s’ recession. Some of the data series used in the composite did not exist before 1990; hence, the start of the track record at that time.
In the two historical Overweight periods, the S&P rose 13% and 14% on an annualized basis. In the two historical Underweight periods, the S&P fell 18% and 9% on an annualized basis.
I think it’s time to close out the most recent Overweight period, which ran from the end of March 2010 through the end of October 2019. In that time, the S&P returned nearly 11% annually.
 Methodology
For a full discussion of the Chartwell method, I refer readers to a description of the process in my April, 2017, employment update, under the heading “Methodology.”
Disclosure: I/we have no positions in any stocks mentioned, and no plans to initiate any positions within the next 72 hours. I wrote this article myself, and it expresses my own opinions. I am not receiving compensation for it (other than from Seeking Alpha). I have no business relationship with any company whose stock is mentioned in this article.
Be the first to comment