

Gold price, news and analysis:
- Gold continues to trade in a relatively narrow range, failing to benefit from a weak US Dollar.
- Held back by the yields available on US Treasuries, it is well placed to gain ground if US yields continue to retreat from their recent highs.
Gold outlook bright once range-trading ends
The price of gold (XAU/USD is continuing to trade broadly sideways, as it has since early this month, but both fundamentals and technical analysis suggest that a move to the upside is more likely than a fall once it breaks out from its recent narrow trading range.
Looking at the fundamentals first, gold’s sideways trading is surprising given that the US Dollar basket has been falling since the start of April, reaching its lowest level since March 18. While the risk persists of a panic about inflation as the US economy recovers from the slump caused by the Covid-19 pandemic, yields on US Treasuries have eased from their highs and the Federal Reserve has made clear that it is in no hurry to tighten US monetary policy.
That Dollar weakness might have been expected to lift the gold price, while lower yields have reduced the attraction of US Government notes and bonds compared with zero-yielding gold. A catch-up advance is therefore looking overdue.
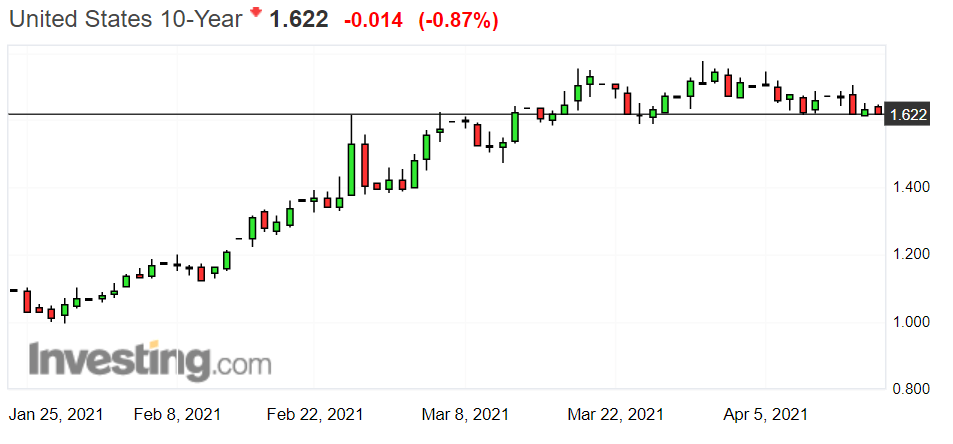
US Ten-Year Treasury Note Yield Chart, Timeframe (January 24 – April 15, 2021)
Source: Investing.com
If Treasury yields continue to edge off their highs, and the Dollar continues to weaken, the gold price can be expected to strengthen. Moreover, the gold price chart is looking positive.
Gold Price Chart, One-Hour Timeframe (March 30 – April 15, 2021)
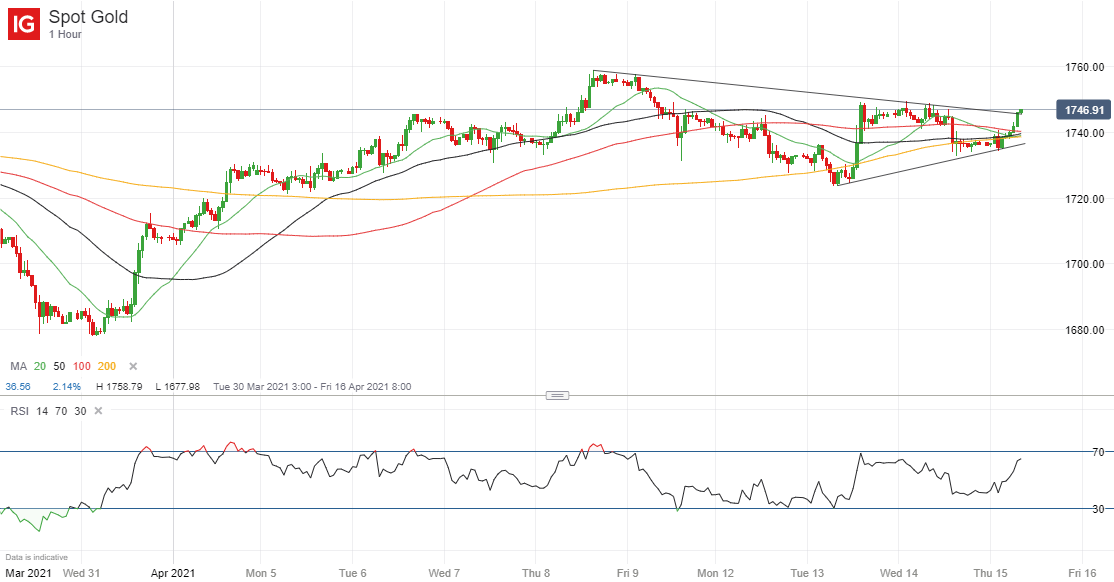
Source: IG (You can click on it for a larger image)

Recommended by Martin Essex, MSTA
Download our fresh Q2 Gold Forecast
Gold technical analysis
As the hourly chart above shows, gold has been trading within the bounds of a symmetrical triangle pattern. Given the metal’s previous advance, that can be seen as a continuation pattern, with gold’s earlier strength likely to resume once trendline resistance is broken. Moreover, it is already testing that resistance and that’s a sign that a break higher could now be close.
Note too that the price is not yet overbought, as shown by the 14-day relative strength index in the lower panel above, which is still below the key 70 level. However, there is one note of caution: IG client sentiment data are sending out a contrarian bearish signal at the time of writing.
| Change in | Longs | Shorts | OI |
| Daily | 4% | -16% | 0% |
| Weekly | 5% | -14% | 1% |
— Written by Martin Essex, Analyst
Feel free to contact me on Twitter @MartinSEssex
Be the first to comment