

Win McNamee/Getty Images News
Remember When Everyone Thought Exxon Would Go Bankrupt?
792 days ago, oil futures hit zero and then went negative. Exxon Mobil (NYSE:XOM) lost about $22 billion in 2020, while pundits gleefully declared the end of the oil business. Exxon, once the world’s most valuable company, briefly traded for a lower market cap than Zoom (ZM), the video chat company.
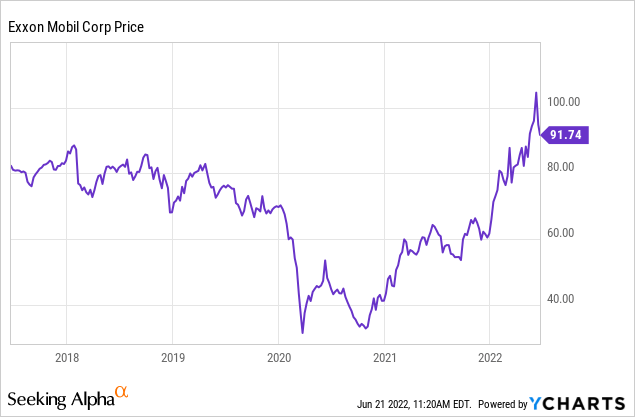
In November, Pfizer’s COVID-19 vaccine was found to be ~94 percent effective, completely shattering the paradigm that Western society would “need” to be locked down for five years or more. I wrote shortly after that that Exxon may have no friends, but they do have plenty of customers. The stock was dirt cheap! It took Exxon a mere 12 months to earn back their pandemic losses – everything they’re earning now is gravy. XOM stock hit an all-time high this month.
Politicians are back to using the company as their campaign trail punching bag. As is characteristic, Exxon never really responds. Exxon fought through the challenges of the pandemic for shareholders, maintaining and raising its dividend and navigating the now-famous proxy challenge by activist hedge fund Engine No 1.
While I expect Exxon to continue to have success, oil has become an increasingly crowded trade, and valuations have risen dramatically across the energy sector. With the stock trading a bit above $90 here, I would take some profits. At some point, the cycle is going to turn. For when to exit fully, I’d look at some classic oil market signals.
How To Trade XOM Stock: Signals Worth Considering
As we all know, oil is a cyclical business. But it’s not entirely unpredictable. The seeds of the current bull market in oil were sown from decreased production during the early days of COVID. Likewise, the seeds of the COVID energy bust were sown during the previous shale boom.
There are two indicators that you can look to for help trading energy stocks.
1. The Term Structure of Oil
There’s an old principle in economics called the theory of storage. It’s not super widely known on Wall Street, but it’s very useful for making money in energy commodities. The basic idea is that energy is something that buyers need, and they’re willing to pay a premium to get them on short notice when it’s in short supply. By contrast, the longer-term market for commodities is less chaotic and more rational. This means the oil market generally (but not always) trades in “backwardation.“
The idea here is that when the oil market is tight, you can buy oil futures 3-6 months out for a discount, hold them, and sell them at market price when they’re one month out. The return you get on this is called a “convenience yield.”
Checking the term structure of WTI and Brent crude confirms that indeed, the oil market is tight and this looks like a good trade.
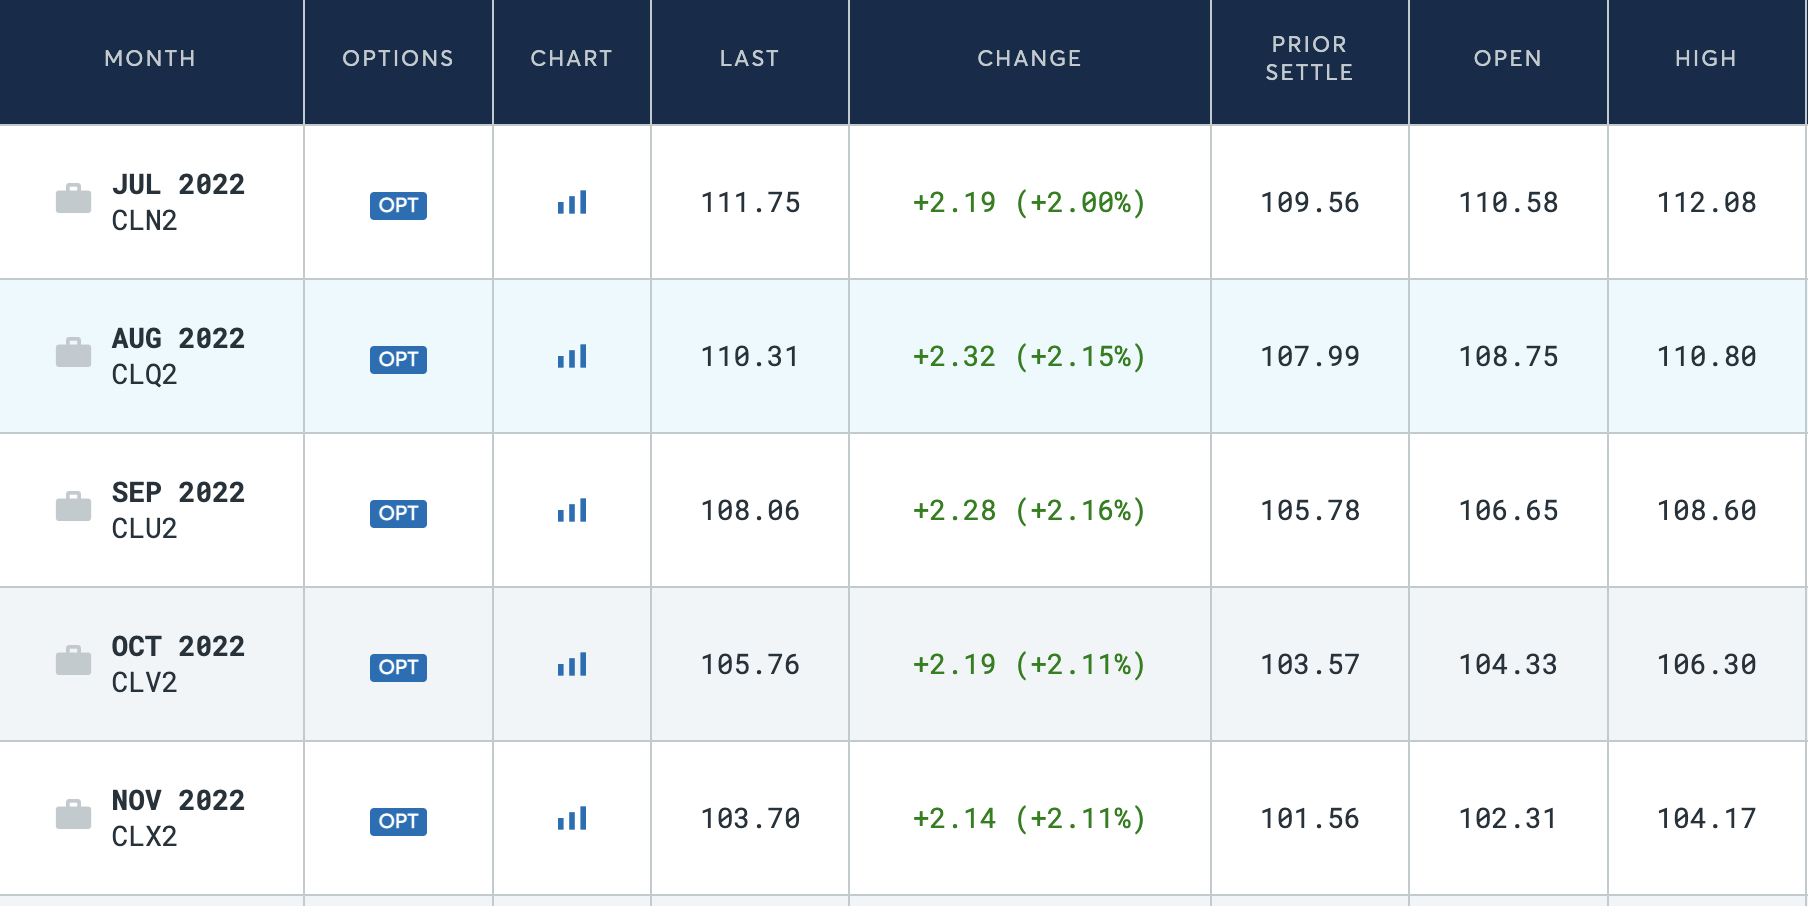
WTI Futures Term Structure, 6/21/2022 (CME)
On the other hand, when the oil market is oversupplied, the market trades in “contango.”
A well-known trading strategy is to buy oil or oil stocks when the market is in backwardation and sell when it flips to contango. For example, this paper from PIMCO shows that crude oil futures return ~+28% annually when in backwardation, and ~-16% annually in contango. The oil market is in backwardation roughly 60% of the long-term and in contango about 40%, so this is a very interesting signal.
The idea here would be to hold XOM stock until the oil market flips into contango. This signal indicates that Exxon is going higher in the short run, but there are reasons to be more cautious for the long run, which we’ll get into soon. I’d still take some profits here but would watch the term structure of oil to figure out when to fully exit the position.
2. Momentum
Momentum is widely studied and certainly applies to energy stocks. However, the PIMCO study showed that backwardation was a much more effective signal. The idea would be that you hold Exxon until the upward momentum stalls out, and then you’d sell. Commonly you would use some kind of moving average like a 200-day moving average to help you assess whether the momentum is with you or against you.
This makes intuitive sense, you have a trade that everyone is piling into, so as long as they pile in, you hold. However, when it starts to reverse to the point where the trend is broken then you’d get out. Momentum also indicates that Exxon could trade higher in the short run.
The relative strength of energy is actually quite impressive this year, as of my writing this, Exxon is up 40%+ for the year while the broad S&P 500 index is down a little more than 20%. But this could turn on a dime with a truce in Ukraine, a global recession reducing demand, or any number of other factors.
Both of these indicators can turn on a dime. Don’t forget that oil hit nearly $150 per barrel in July 2008 before crashing into the $30s by December 2008! Food was also in relatively short supply in the world at this time, in large part blamed on surging fertilizer costs. Sound familiar? 2008 was our last bout with stagflation.
Oil Investors: Be Careful What You Wish For
Dreams have recently come true for XOM shareholders, but past cycles show that the good times don’t last forever. As we speak, the seeds are being sown for the next downturn in oil. The higher Exxon goes during the current bull market, the lower it’s likely to go during the next bear market.
Two issues here.
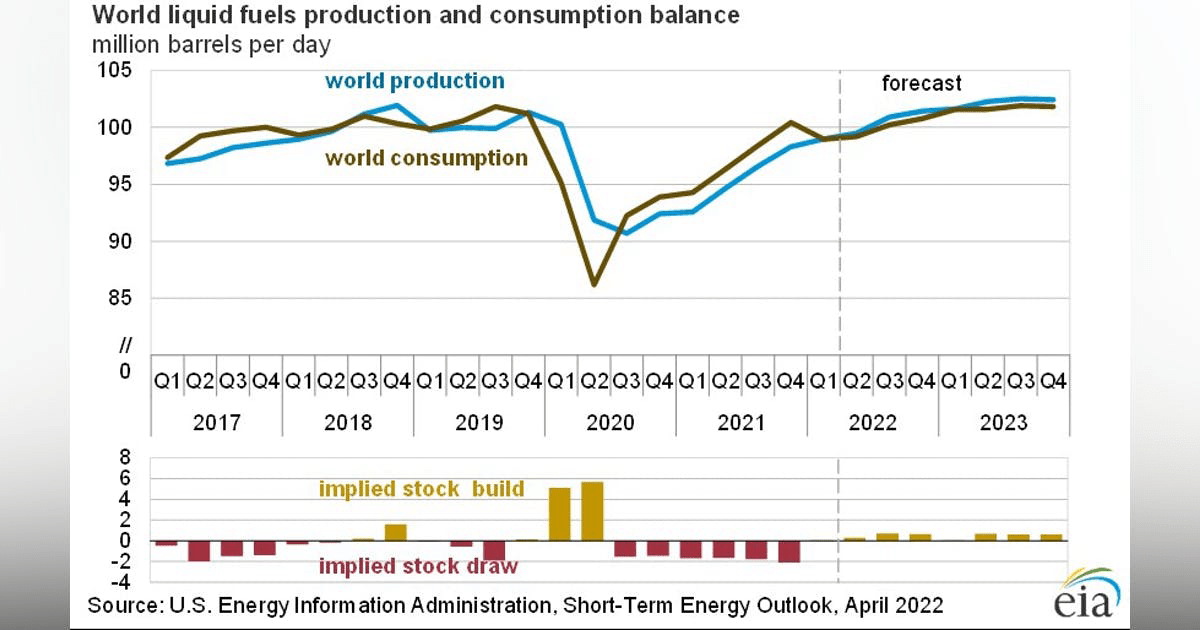
Oil supply vs. Oil Demand (EIA)
First, there is now a tremendous incentive for supply to come out of the woodwork from somewhere in the world, simply because there’s so much money to be made. Banning Russian oil temporarily jacked up the market, but the war could end, or other countries could step into profit. The supply of oil is very inelastic in the short run, but in the fullness of time, new supply is likely to catch up with demand at some point. In other words, oil isn’t likely to continually skyrocket in price. Even if the politicians in power in the West continue to obstruct the supply of energy from reaching the market, eventually people get pissed off and vote them out. And OPEC members have a long history of cheating on their quotas.
The second issue is demand destruction. Oil demand isn’t very elastic in the short run, but in the long run, people change their habits, and technology tends to overcome the scarcity of commodities.
This isn’t as common in wealthy countries, but in developing countries, a rise in the price of energy causes demand to fall a fair amount. If you’re losing money commuting to your job, then you might as well not work. For example, this is my updated commuting and cost of living spreadsheet now that 63 cents per mile is the new estimate for the cost of driving. (Relocation_Spreadsheet.xlsx).
If you’re buying a house 40 miles from your office, you better be able to work from home, or you’ve effectively sold OPEC a free call option on the price of gas! Remote work is an option that was not viable during the last major energy shocks in the 1970s or 2000s, but it is battle-tested now.
Electric vehicles hit nearly 9% market share in 2021, after being less than 1% as recently as 2016. Solar power production is increasing exponentially as well. In 20 years, I expect these to be the dominant forms of transportation and electricity generation, respectively. There’s some talk of a potential congressional deal also that encourages both US production of oil and renewables, which would be a nice down payment on the current energy crisis. All of these make the economy more resilient and less dependent on oil to function.
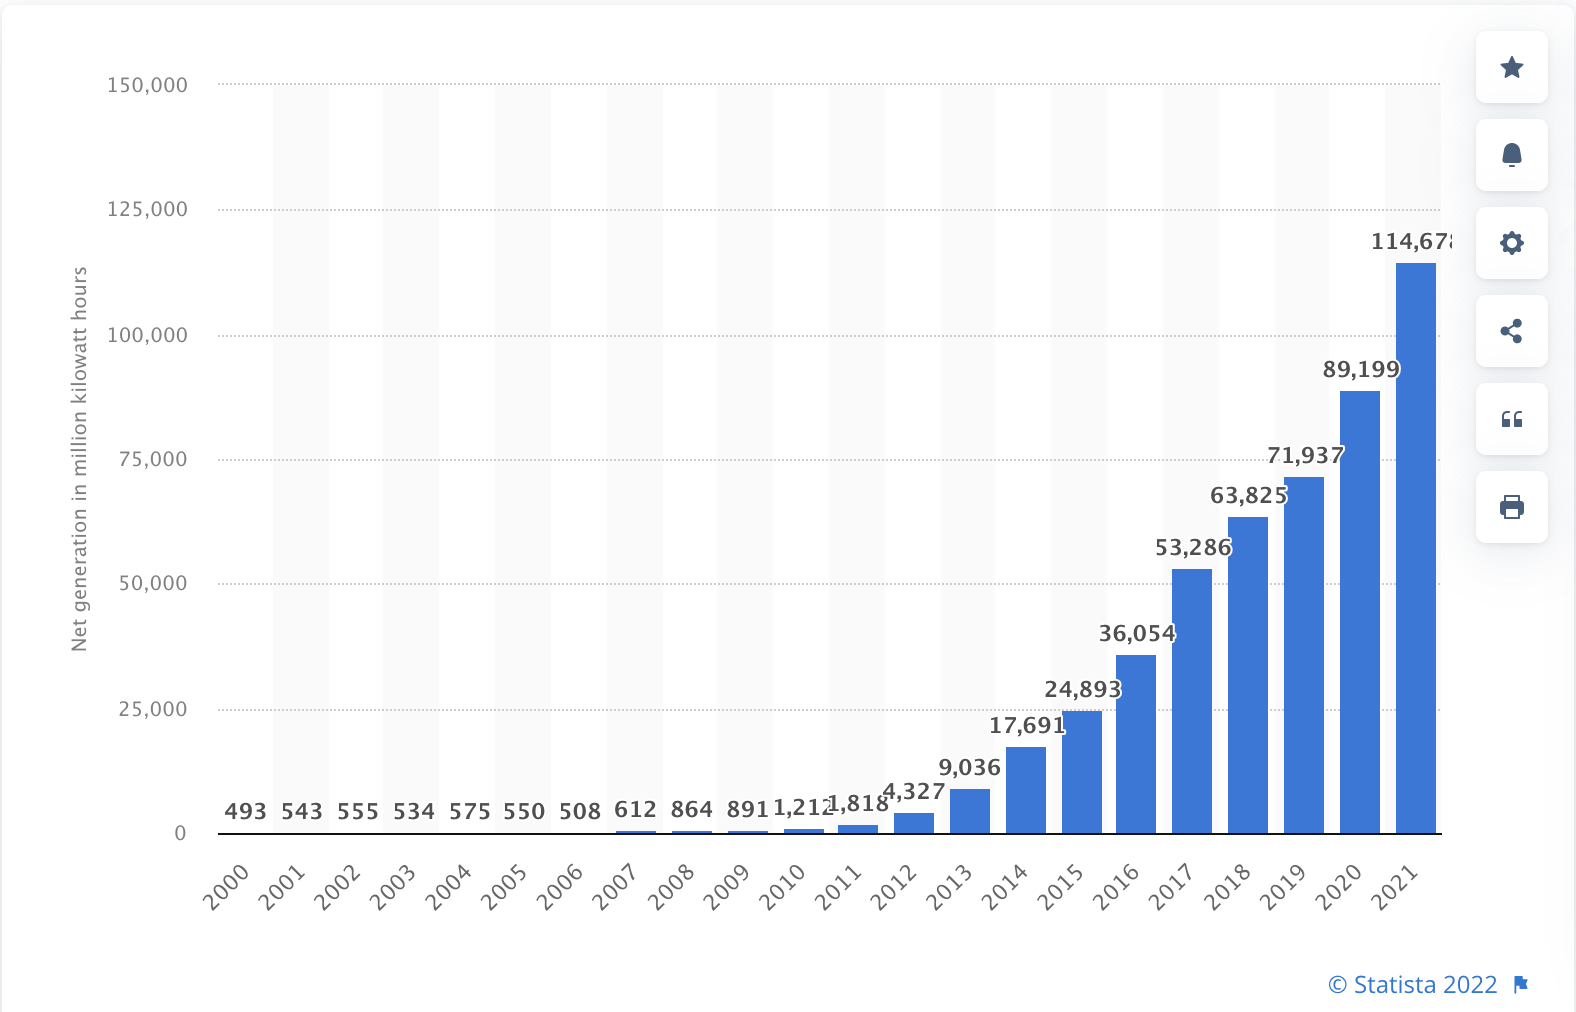
Solar Power Production (Statista)
Renewable technology is advancing exponentially. It might not feel like it because it started from a low base, but the ROI on things like electric vehicles and solar is approaching the point where as a household you can get 20-25% returns on capital in areas where electricity/gas is expensive for making the upfront investment in renewables. Don’t overlook this! Gas costs $6.40 per gallon in California right now and $8.50 in Paris or London. People are adopting electric vehicles not because they give themselves a warm feeling inside, but because they save money. When I visit, 80%+ of the Ubers in London now are EVs.
This shouldn’t scare you off from investing in XOM stock at a reasonable price – as coal is the first fuel out of the mix, not oil & gas. But at the very least, the pendulum of public sentiment is likely to shift again at some point. The trouble with Exxon now is that it’s not that cheap, leaving it as really just a momentum play at this point, and a long-term investment that is okay at these prices, but not great. It’s worth noting that in the 1970s stagflation, oil continually ground higher, but in 2008, a steep drop in demand caused oil to plummet. Whether the next recession is more like the 1970s for Exxon or 2008 is an open debate.
Bottom Line
Exxon is expected to earn about $10 per share in 2022, but to assume these levels of earnings will last forever seems shortsighted (just as the predictions that Exxon Mobil would go out of business in 2020 were). Cyclical stocks look cheap when they’re expensive and look expensive when they’re cheap, and Exxon is no exception here. Exxon likely trades higher in the short run, but as summer turns to autumn, I would expect some combination of higher aggregate energy supply and falling demand (global recession?) to bring the stock lower. Of course, Exxon should have never been as cheap as it was in 2020, but we might look back at the price of XOM in 2022 and wonder why it got so expensive. Take some profits in Exxon here, and look to sell your position fully if and when oil next enters contango.
Be the first to comment