

coffeekai
Stocks, bonds, and commodities all lost value yesterday under the weight of rising interest rates with the 2-year Treasury yield piercing 4.32% and the 10-year at another new high of 3.88%. The dollar continued its ascent to multi-decade highs, fueled by a plunge in the British pound after the new government proposed tax cuts and more spending to revive the economy. That was not welcome news for inflation hawks at the Federal Reserve who seem committed to overtighten through rhetoric to show they remain determined to rein in price increases. A recession is apparently no longer a concern.
Finviz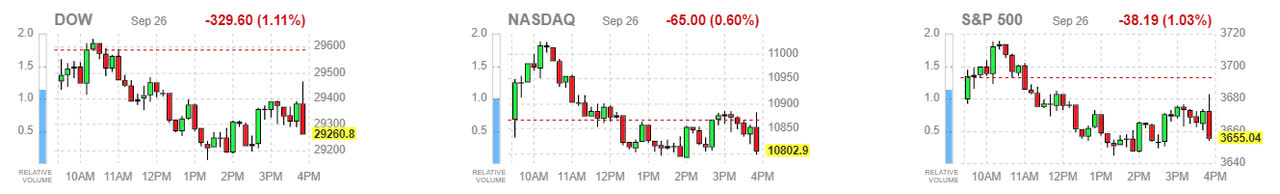
Despite the fact that recent economic data shows the economy continuing to grow modestly, investors are selling now and asking questions later in response to Fed official warnings. In other words, markets are pricing in a recession whether one happens or not. That’s why the S&P 500 fell slightly below its June closing low yesterday. At the same time, the heightened uncertainty and growing fear is creating a series of extremes that typically coincide with a bottoming rather than another large leg lower in market prices.
CNBC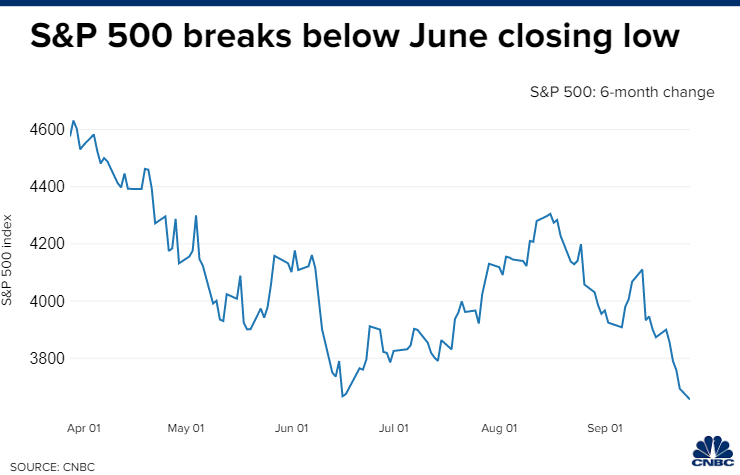
In the following series of charts that I regularly use to measure risk in markets it is becoming increasingly apparent that we are nearing a turning point. This is building my confidence that a year-end rally coinciding with the midterm elections could significantly narrow the year-to-date losses and set the stage for a much better 2023.
The Volatility Index has finally climbed above 30 over the past two trading days, which is more than one standard deviation above its long-term average of 20. We have seen market bottoms over the past three years coincident with levels in the mid- to upper-30s, so we are nearing peak volatility.
Stockcharts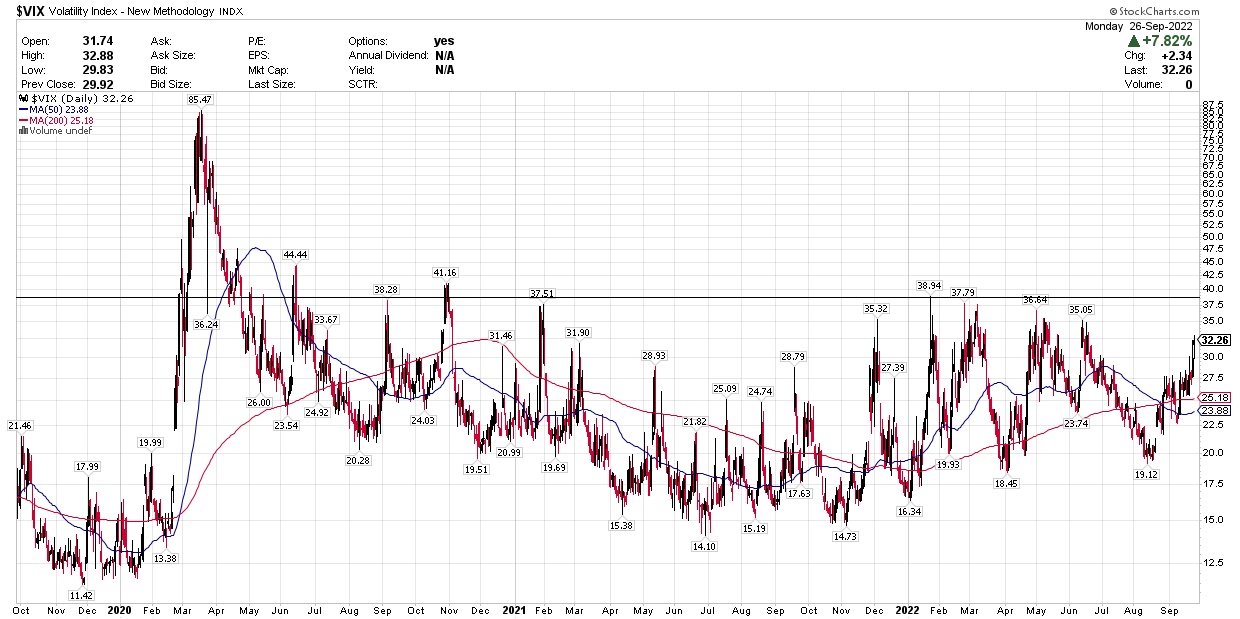
The percentage of stocks in the S&P 500 trading above their 50-day moving average has fallen to just 3%, which means there is only 3% left before we are at ZERO. You can count on one hand how many times over the past 20 years that this indicator has fallen this low. Every prior occasion was an excellent long-term buying opportunity. On that basis, selling stocks here is an extremely bad idea.
Stockcharts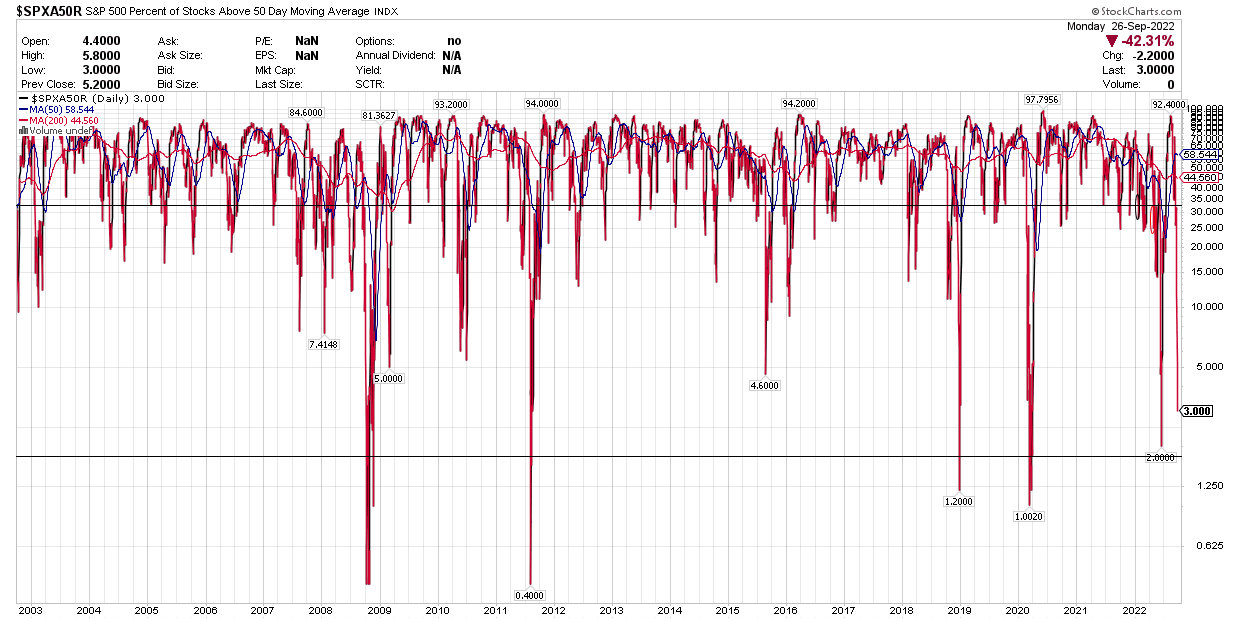
For those who follow point and figure chart analysis, the NYSE bullish percent has fallen below 30%, as it did in June, for only the fifth time in the past decade. This measures the percentage of stocks on the NYSE that are still exhibiting buy signals on their respective charts. We are now deeply oversold at 21%.
Stockcharts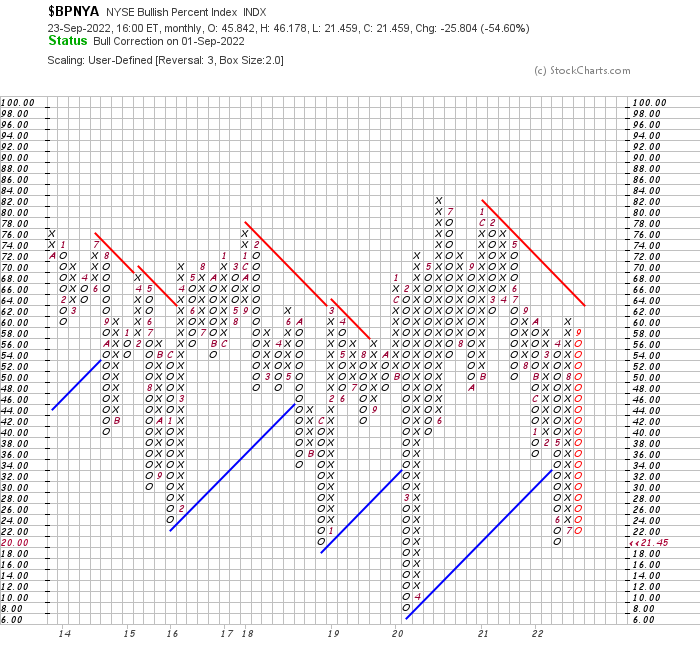
The price of oil is no longer contributing to inflation. In fact, on a year-over-year basis we may see the price decline, which is a deflationary factor in the computation for the annual rate. This is the most important commodity in the world and its price feeds into the prices of most other goods and services in one way or another.
Stockcharts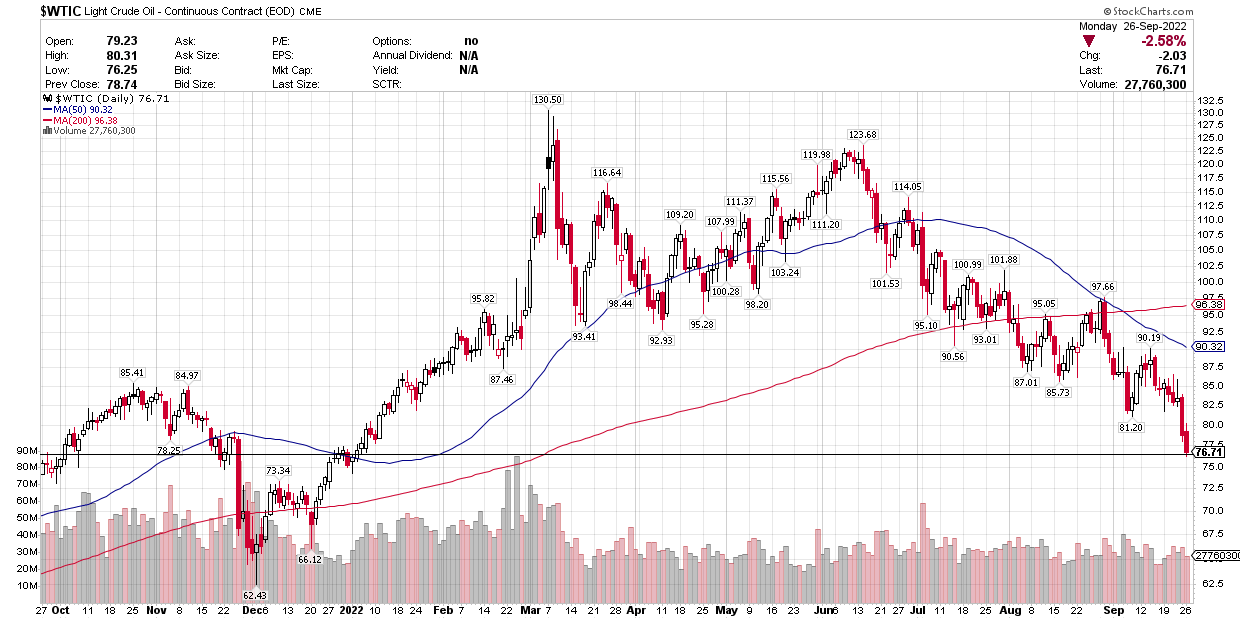
It is not just oil, as the entire commodity complex is experiencing a price decline that should result in year-over-year declines in early 2023. This is one very important reason why I think the Fed will not raise short-term rates as high as it is forecasting today. They are ignoring these leading indicators of tomorrows inflation rate the same way they did in 2021, but in the opposite direction.
Stockcharts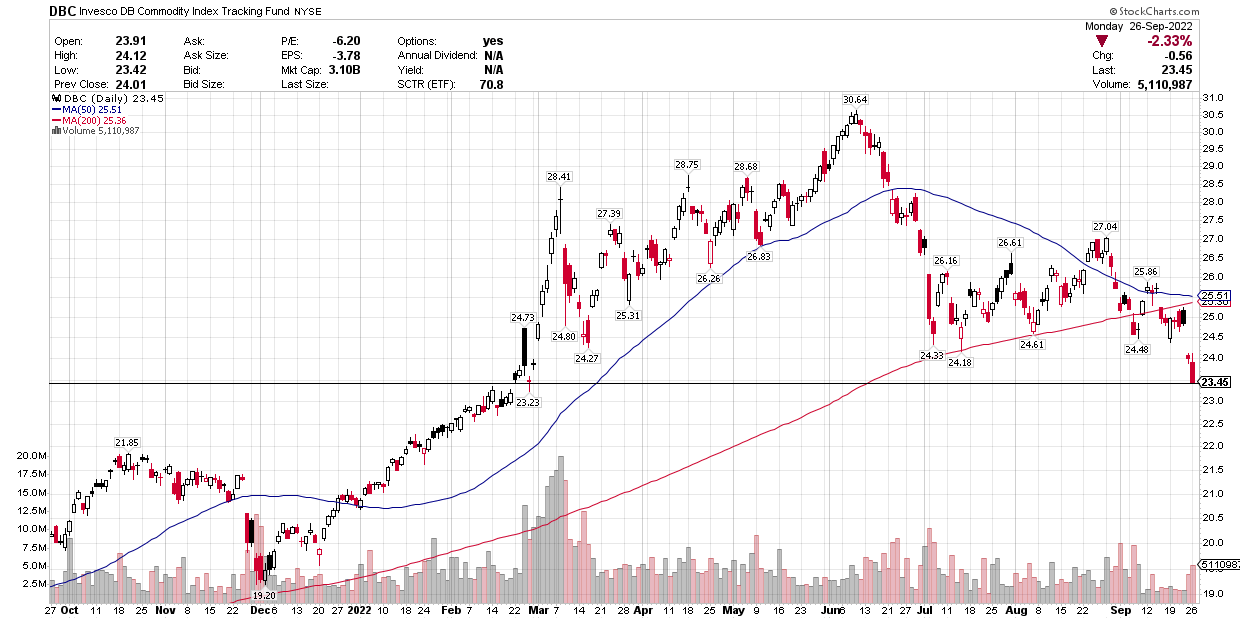
Lastly, my recession indicator is moving away from the danger zone. The yield curve between the 3-month and 10-year Treasury steepened by 4 basis points yesterday to 49. Bear markets that avert recessions are much shorter and shallower than ones that do not. My base case remains no recession and U-shaped recovery from this bear market.
Stockcharts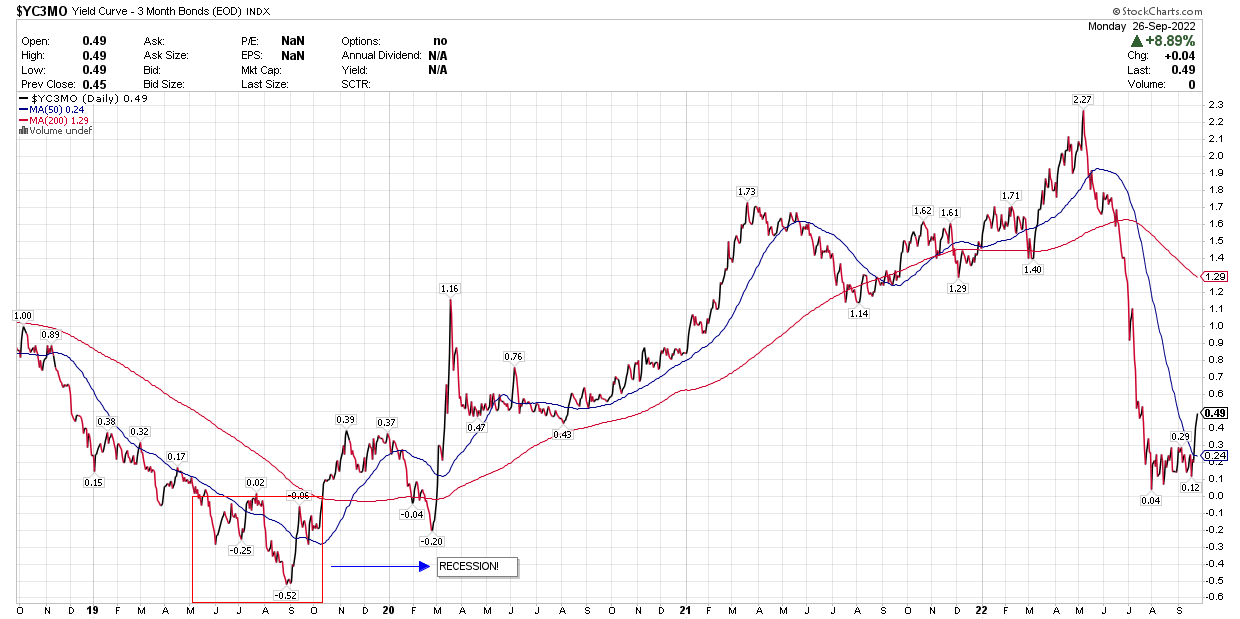
Be the first to comment