

S&P 500, US Dollar, FOMC, ECB and BOE Rate Decisions, Earnings and Growth Talking Points:
- The Market Perspective: S&P 500 Eminis Bearish Below 3,900; USDJPY Bullish Above 132.00
- The S&P 500 and Nasdaq 100 seemed to earn technical breaks in favor of a reversal of 2022’s bearish trend, but conviction was still in short supply
- A docket loaded with events like the FOMC decision and NFPs is likely to drive the Dollar from its narrow range, but will it offer a clear direction for currency and indices?
Recommended by John Kicklighter
Get Your Free Top Trading Opportunities Forecast
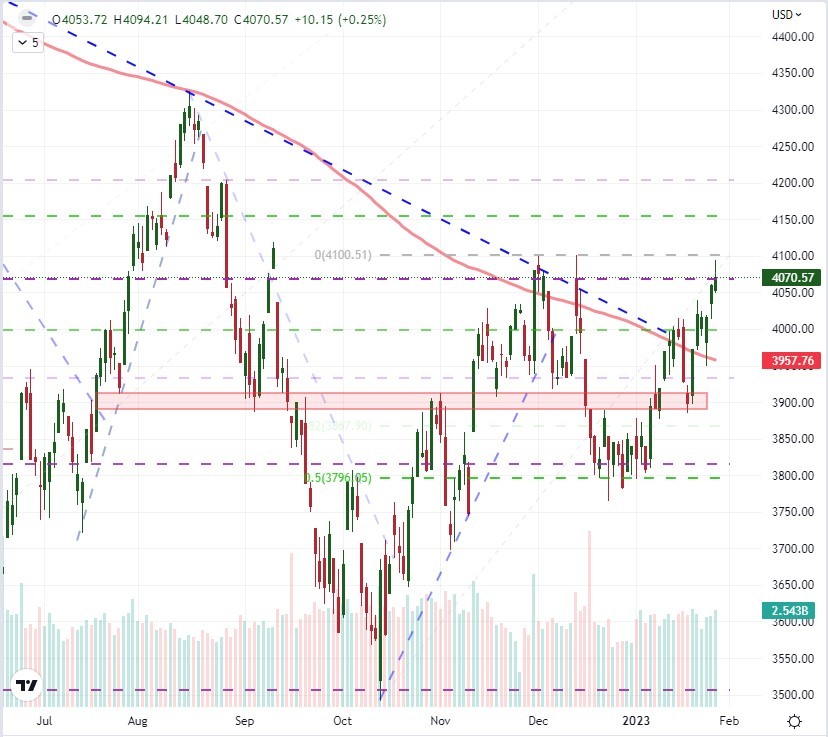
Markets have struggled for a clear bead on direction since the beginning of the year. That may be more straightforward on a technical basis from the likes of the US Dollar – which has carved out its most restrictive trading range in nearly a year – but it is also true of measures like the S&P 500 and Nasdaq 100. These major US indices, which carry a significant weight as speculative guides, climbed 2.5 and 4.7 percent respectively to clear their 200-day simple moving averages (SMA). That registers as progress to any reasonable person, however, conviction is not necessarily inherent in this technical progress. The number of times that the S&P 500 overtook a notable technical resistance only to fall flat on follow through this past week should at least cause bulls pause. From a fundamental perspective, there was capable event risk to help fuel the market’s ascent if there was appetite to commit to the advance. The US 4Q GDP release beat expectations and the Fed’s favorite inflation indicator (the PCE deflator) cooled in-line with the previously released CPI report. Yet, neither of these developments spurred the commensurate shift in related markets that would be expected to reflect such a fundamental shift – such as the US Treasury yields. That reticence may be in part due to the anticipation of the major event risk that is scheduled for this coming week. Then again, an overwhelming run of capable event risk may still swamp the market’s ability to establish a clear trend for the markets.
Chart of S&P 500 with 200-day SMA and Volume (Daily)
Chart Created on Tradingview Platform
A casual look at the Global Macroeconomic calendar for the coming week should trigger an initial sense of anxiety. Filtering the docket to just the top events will cement the scope for serious volatility through the period. There are two dominant themes that most fundamental tributaries eventually lead – rate speculation and recession risk – and there is an overwhelming number of updates that can tap into either or both. Breaking down the most capable events through the coming week by calendar day, traders would do well to watch:
- Monday: Eurozone consumer inflation expectations leading into the ECB rate decision.
- Tuesday: An update to the IMF’s World Economic Outlook as a comprehensive GDP picture; Eurozone 4Q GDP with Goldman Sachs upgrading its growth forecast and the US Consumer Confidence survey given its capacity to shape growth forecasts.
- Wednesday: All eyes will turn to the FOMC rate decision, which will stand as a guiding light for global monetary policy that has played a critical role in a decade of speculative confidence and a rough 2022 dose of reality.
- Thursday: In the wake of the US central bank’s decision, the ECB and BOE will also deliver their own updates which will given relative perspective while also shaping the global perspective. After the US close, earnings from Apple, Amazon and Google will provide the most targeted earnings impact possible in the season.
- Friday: January NFPs will prove a significant cap to an extremely busy week, but how the labor market report is interpreted will depend heavily on what theme the market’s determine is most pressing.
Top Global Macro Economic Event Risk for Next Week
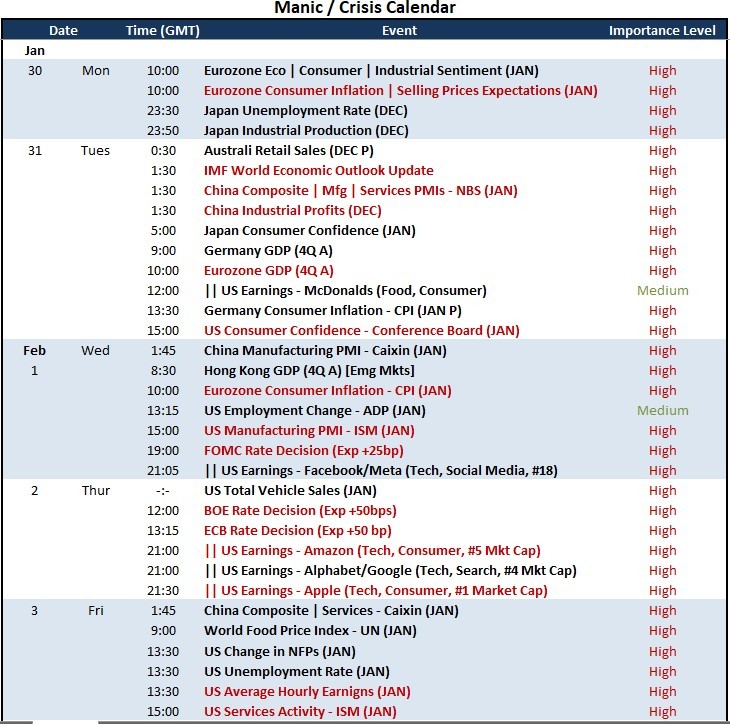
Calendar Created by John Kicklighter
The problem with such a profound docket is that the anticipation for what lies directly ahead can blunt the reaction to what has just recently been released. As such, the potential for volatility in response to these serial updates is very high. However, the capacity of turning that elevated activity into a clear course trend could be made significantly more difficult. As such, those traders in major assets or observing the macro perspective should maintain a healthy sense of skepticism when faced with severe bouts of volatility. For those in the FX space, that could be a difficult stoicism to maintain. The DXY Dollar Index closed out Friday with its narrowest 11-day historical range (as a percentage of spot) since February of last year. That is an extreme restriction on trading activity for a benchmark asset that reversed a nearly two-year bull trend to two-decade highs in the span of little more than three months. Furthermore, we have come into significant waves of support which will be difficult to miss for even the most casual chart watcher. In other words, a breakout is highly probable; but the ability of forging that heat into a viable trend will be exceptionally uneven.
Chart of DXY Dollar Index with 200-Day SMA, 10-Day Historical Range (Daily)
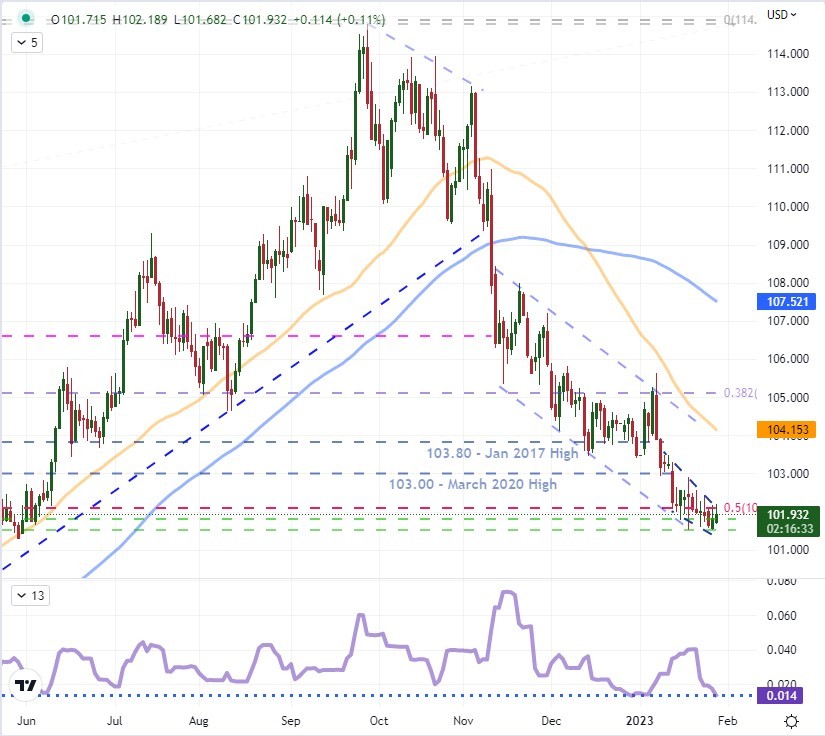
Chart Created on Tradingview Platform
Trend development for both Dollar and risk assets like the US indices will be closely monitored – yet its capacity to establish a clear course will be seriously encumbered. That said, should a distinct focus on monetary policy, growth forecast or other undercurrent come through this week; there are a number of markets that are well positioned to take advantage. Near the top of my list is USDJPY. Like the Dollar Index itself, the second most liquid USD-based pair retraced half of its 22 months of gains in three months. While there will be some carry trade consideration to this cross, how much excess premium is still afforded a yield differential that is approximately 4.5 percent. An outlook for a sudden cut in US rates is very unlikely, and the scenario where it does come to pass would speak to severe risk aversion spurred by a crisis. In the event of a strong ‘risk off’ wind, I wouldn’t expect the Yen to benefit between these two. The Japanese currency has historically risen in a troubled sentiment environment in large part due to the unwinding of established carry trade, which we’ve just discussed has been significantly discounted these past months. In an earnest and severe safety-seeking environment, the ‘last resort’ status of Treasuries and the Dollar will come to back to light. Fundamentals and technicals aside, a last point on statistics. As of Friday, USDJPY closed out its 61st day below its 20-day (1 trading month) moving average. That matches the stretch through July 19th, 1992 – a stretch that resulted in a 3 percent, 4-day rally. To find something longer in the bearish category, we need to roll all the way back to December 20th, 1977.
Chart of USDJPY with the Consecutive Days for Spot Above or Below the 20-Day SMA (Daily)
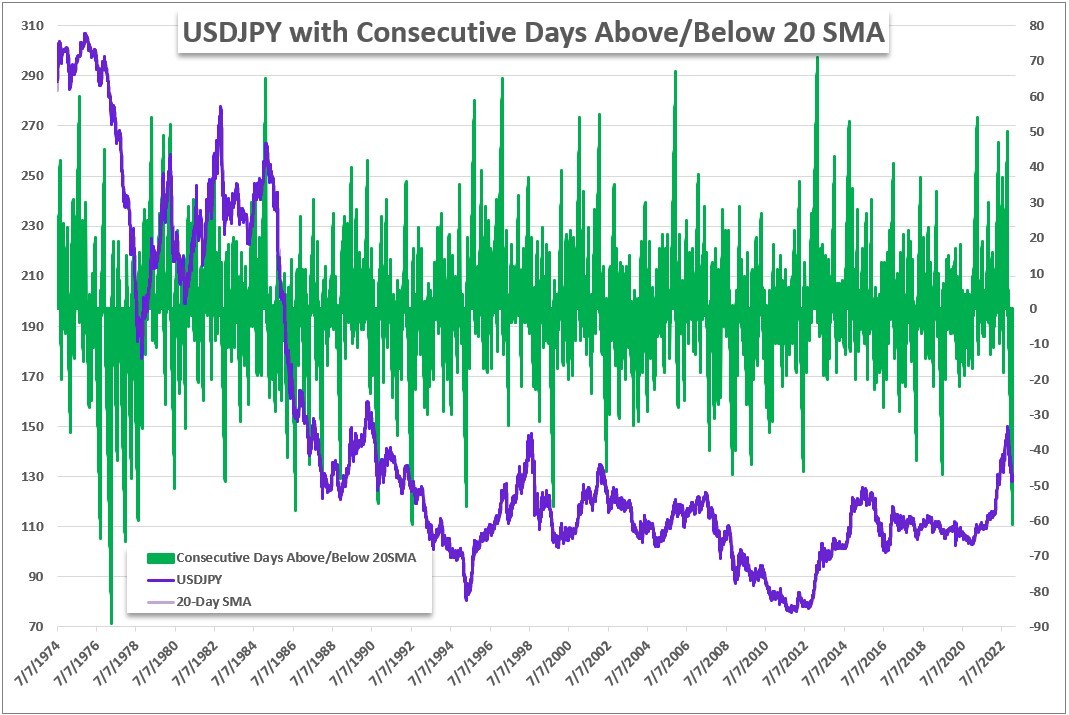
Chart Created by John Kicklighter

Be the first to comment