

Adrian Vidal
Context Of The Article
Given the relatively unexciting forward yield on offer (0.88%), Microsoft (NASDAQ:MSFT) stock’s broad dividend profile is not something that tends to get an awful lot of mileage. Besides, being an archetypal growth stock, the focus invariably tends to gravitate toward the growth-inducing levers that the company possesses. Nonetheless, I believe the dividend angle deserves more attention as it has been an influential catalyst in the sizeable differential (~1.6x) between the stock’s total return and the price return since 2003 (when dividends were first initiated, nearly 30 years after the stock’s initiation).
YCharts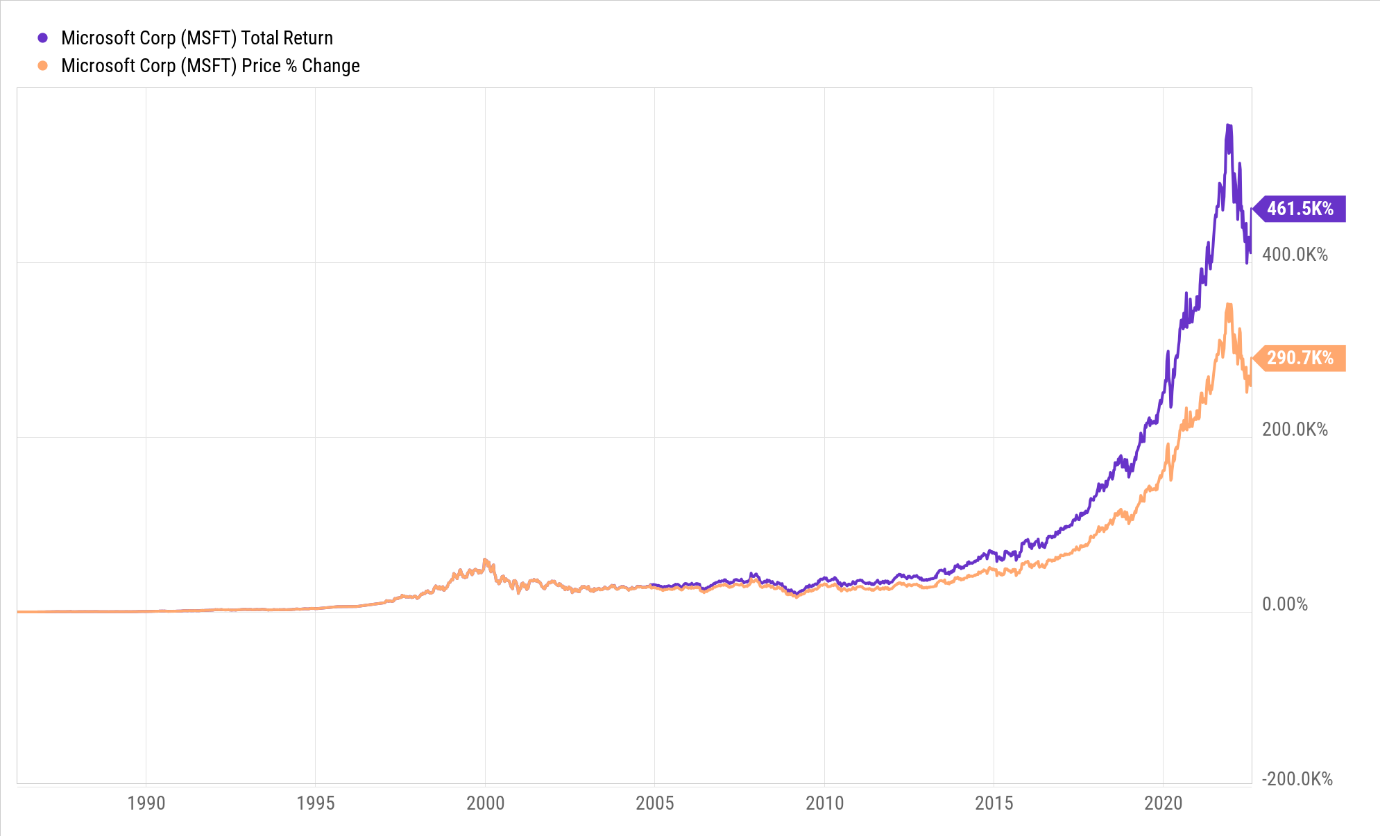
In this article, I will first look to determine if MSFT has the appropriate foundation to support its dividend ambitions. I will then look to examine different aspects of MSFT’s dividend profile, by comparing it to the 10 largest tech peers from the S&P500. Finally, I’ll conclude with some thoughts on the positioning of MFST stock relative to its peers.
How Comfortably Can Microsoft Meet Its Dividend Objectives?
Microsoft does not have an explicit dividend policy per se, but the dividend is something they have been doling out for 18 years at a stretch, whilst growing it over the last 17 years. In recent years, the dividends have grown at a little less than 10% on average. Looking ahead, there’s no reason to believe this practice will be curbed in the foreseeable future, as the financial foundation looks to be in excellent shape and it is something that has only improved over time.
Firstly, one ought to recognize that Microsoft has a very enviable portfolio of assets, whose cash-generating abilities have only grown over time. Just to put things into context, over the last 5 years, the net operating cash flow (OCF) generated has more than doubled from $43bn in June 2018 to nearly $90bn, as of June 2022. In effect, 5 years back, whilst these assets were yielding operating cash flow of only 17%, now it is at record highs while they are yielding levels of over 25%.
YCharts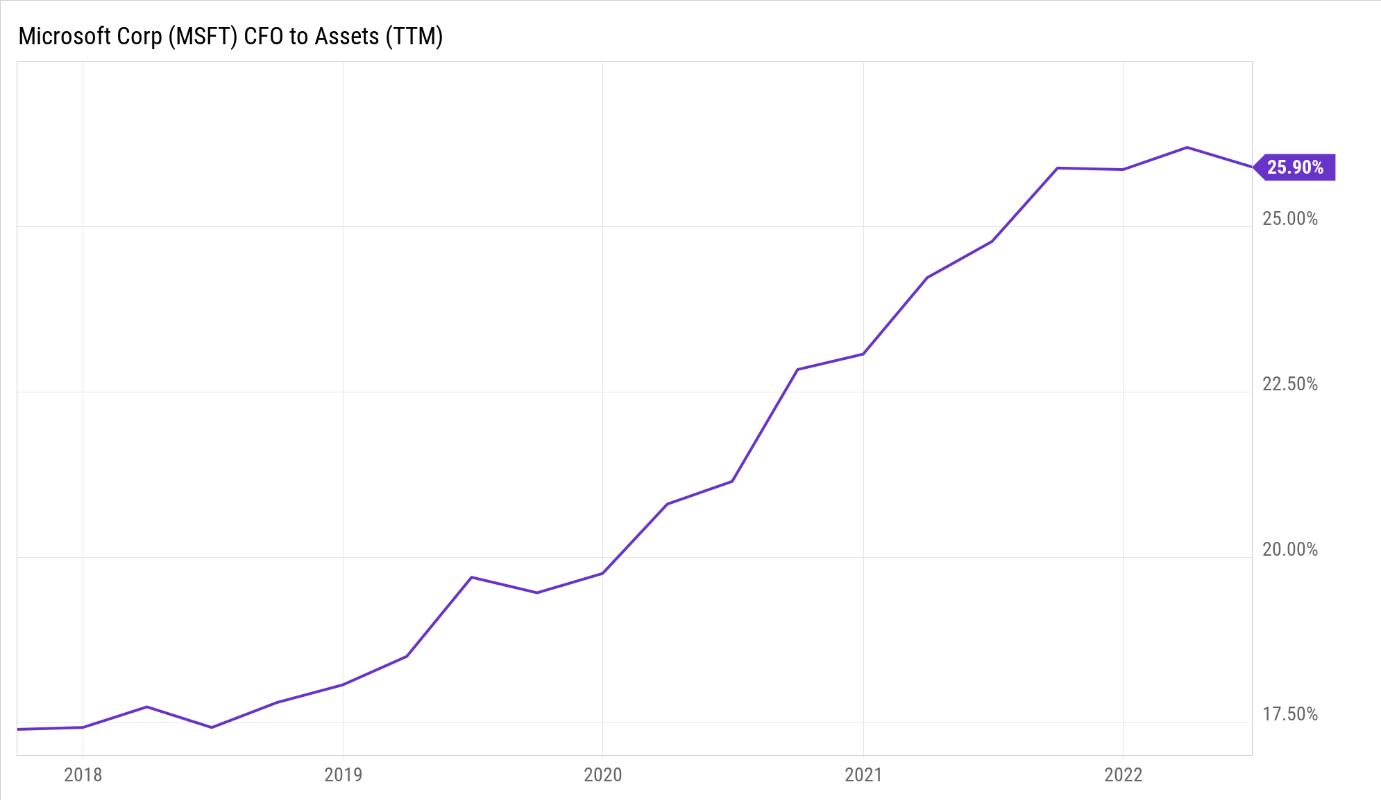
Whilst MSFT has had to meet certain CAPEX requirements which typically take up 25-26% of the OCF generated in any particular year, it is still left with ample FCF, which has been growing at a much superior pace relative to the cash dividend payouts per year. As you can see from the images below, in 4 out of the 5 years, MSFT’s FCF has grown at a far greater pace than the dividends distributed per annum, so much so that the level by which the FCF covers dividends has only continued to expand, and currently stands at around 3.6x.
Seeking Alpha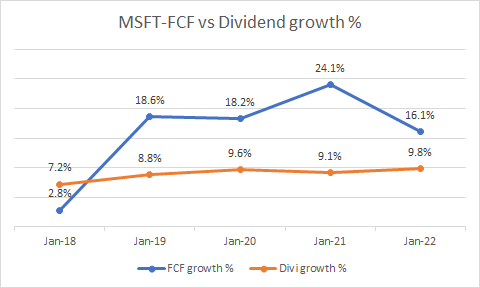
Seeking Alpha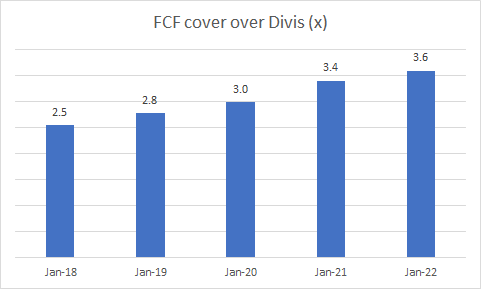
It isn’t just the dividends, the company’s FCF can also comfortably cover the debt on its books, and if anything, this has only strengthened in recent years (currently coming in at 1.23x).
YCharts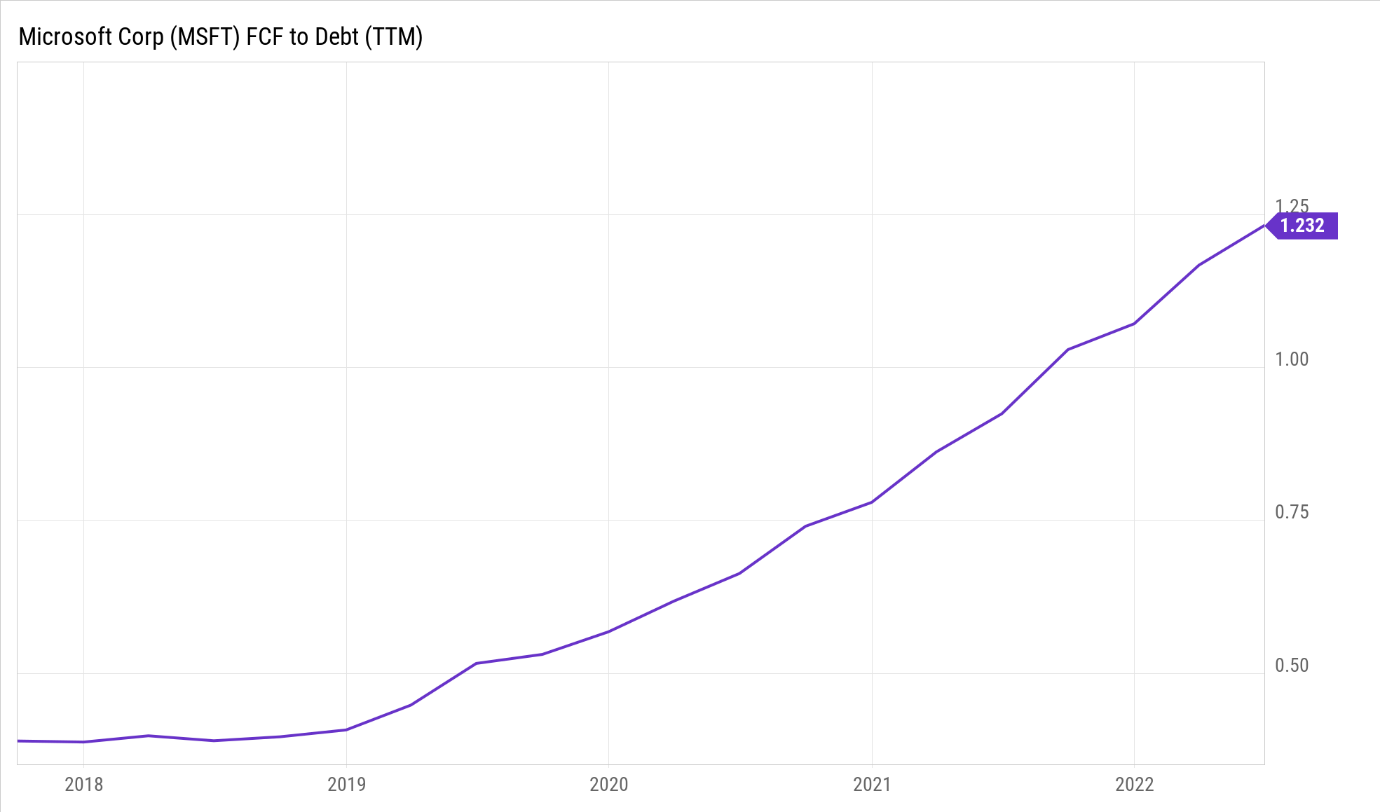
Now, in the coming year (the year ending June 2023), some challenges in the PC market and higher operating costs may dampen the operating profits to operating cash flow conversion for Microsoft. Besides, MSFT could also face some additional tax-related cash flow spikes (estimated to be around $3.2bn) linked to the Tax Cuts and Jobs Act (TCJA) regulations, and the transfer of intangible property. Nonetheless, even if the cash flow generating capabilities of the firm were to soften on account of these prospects, MSFT still has ample elbow room to take on more debt.
Whilst MSFT has enjoyed a long-standing net cash position (where cash on books exceeds the debt), the level of financial leverage on the balance sheet has come down significantly over time; for instance, consider that 5 years back, the total amount of financial debt, stood at over $76bn; but, this has declined every year since, and currently, only stands at less than $50bn.
YCharts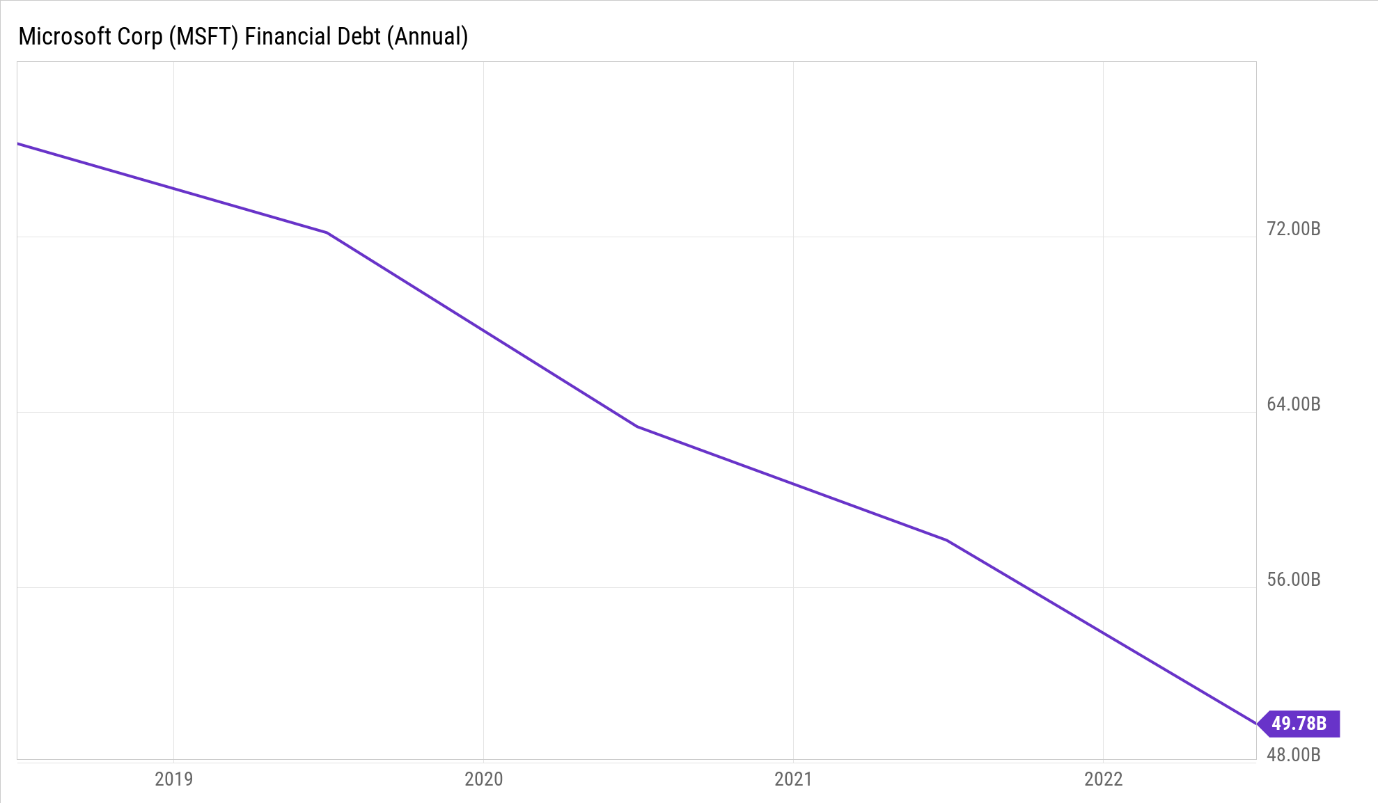
How Does Microsoft’s Dividend Profile Compare To Its Peers?
It would be myopic on my part to rate MSFT’s dividend profile as ‘good’ or ‘bad’ by only looking at it in isolation; the more well-rounded exercise would be to juxtapose it against its closest peers in the tech industry. In that regard, I’ve looked at the top 10 largest tech stocks from the S&P500. Note that Adobe (ADBE) and Salesforce (CRM) would have made the top-10 list, if not for the fact that they don’t pay any dividends currently. These stocks’ dividend scores are gauged by putting them through four broad screens, encompassing nine specific metrics. To be more specific, we have:
- Yields (Higher scores are allotted to stocks with higher absolute yields, and a higher positive variance relative to the historical yield average)
- Payouts (Higher scores are allotted to stocks with higher dividend covers and larger cash payouts)
- Growth (Higher scores are allotted to stocks with a superior track record of dividend growth over the short, medium, and long-term)
- Consistency (Higher scores are allotted to those stocks with a longer track record of paying and growing their dividends)
Considering there are 10 stocks in this study, the stock which tops any particular metric will receive a score of 10, whilst the stock which finishes bottom will receive a score of 1. The points across the nine metrics are added up to arrive at a final score, based on which these stocks are then ranked.
As noted in the initial section of this article, MSFT’s yield position is not wholly compelling; when compared against its peers in this space, the takeaway here is that it’s quite average, as the absolute forward yield puts it close to the middle. Based on the yield alone, it is probably not the most opportune time to consider getting into the MSFT stock, as the current yield is around 22bps lower than its long-term average of 1.1%. Something like a Cisco (CSCO), comes across as an attractive option here as not only does it have the best absolute yield, the difference with its historical average too is quite substantial (almost 50bps).
The next section measures how effectively these stocks fulfill their dividend obligations. The first one looks at how well the EPS covers the dividend, whilst the second one is more pertinent as it looks beyond net earnings which can often be adjusted, and only considers cash flows which are harder to manipulate. Once again, MSFT sort of finishes somewhere close to the middle of the pack with regards to both these metrics.
We then consider how generous MSFT has been with its dividend distributions over the short term (3 years), medium term (5 years), and long term (10 years). Regardless of the duration in question, MSFT has been fairly consistent in growing its dividends at around the 10-12% mark; prima facie that is fairly generous but then you look at some of its other peers and you realize across every period, there are at least 5 stocks that have been more generous than MSFT.
If there’s one area that MSFT fares particularly well, it’s the consistency and longevity with which it has been paying these dividends. As far as longevity is concerned, only Qualcomm (QCOM) and Texas Instruments (TXN) have been paying dividends for a longer period, and only the former has been growing its dividends over a longer period.
All in all, MSFT’s aggregate dividend score works out to 51 and puts it bang in the middle of the pack. So it’s fair to say that MSFT’s dividend profile is neither great, nor bad, but just about fair. If you’re looking for the most well-rounded tech dividend play, that would be Texas Instruments Incorporated, which tops the charts.
Seeking Alpha, YCharts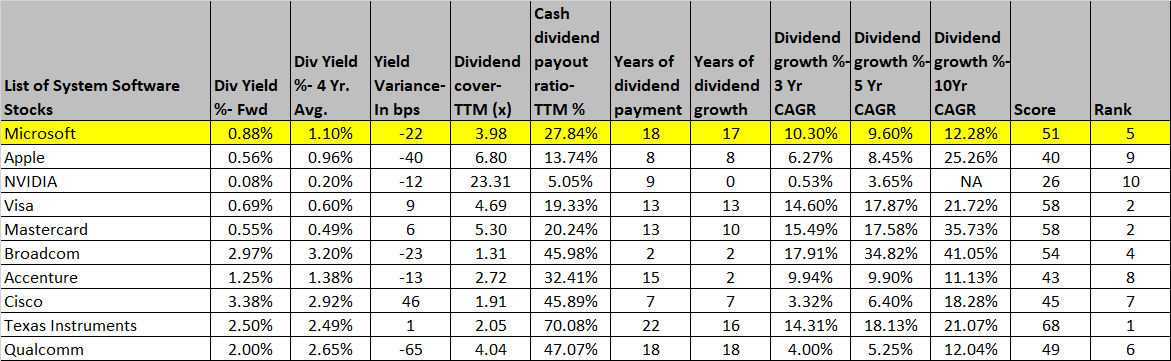
Other Considerations
This year, despite a correction in the mid-teens percentage threshold, the MSFT stock still appears to look rather overextended versus its peers in the broad tech universe, as represented by the Vanguard Information Technology ETF (VGT). As you can see from the image below, that ratio currently trades around 30% away from its mid-point and is not too far from record highs.
Stockcharts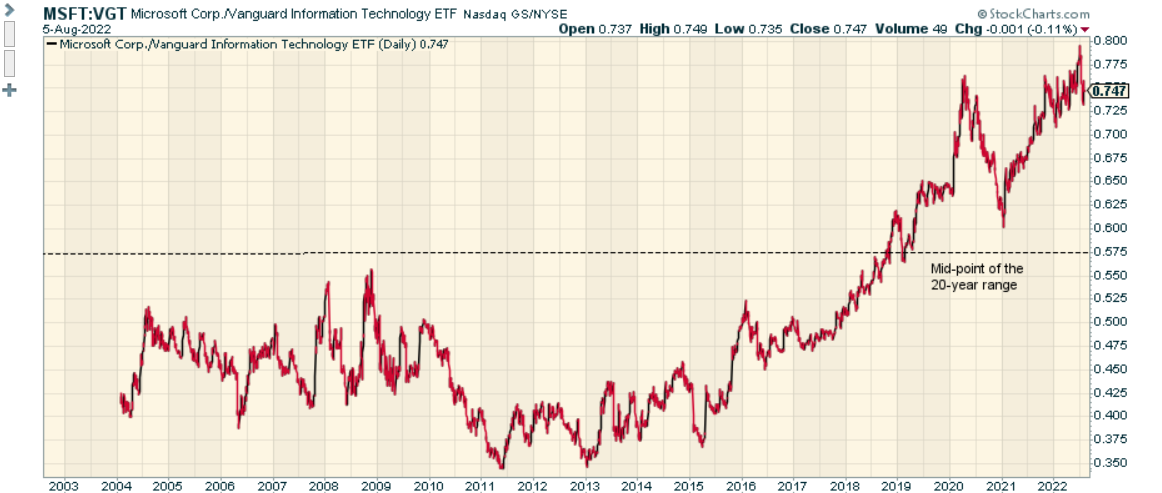
If you want to narrow the focus to only large-cap tech stocks that comprise the S&P500, you may consider looking at the ratio measuring the MSFT stock versus the Technology Select Sector SPDR Fund (XLK); even here, notice how extended the ratio looks relative to its 20-year average mid-point. The broad takeaway here is that at current levels, MFST does not appear to offer attractive risk-reward for those looking to rotate within the tech space.
Stockcharts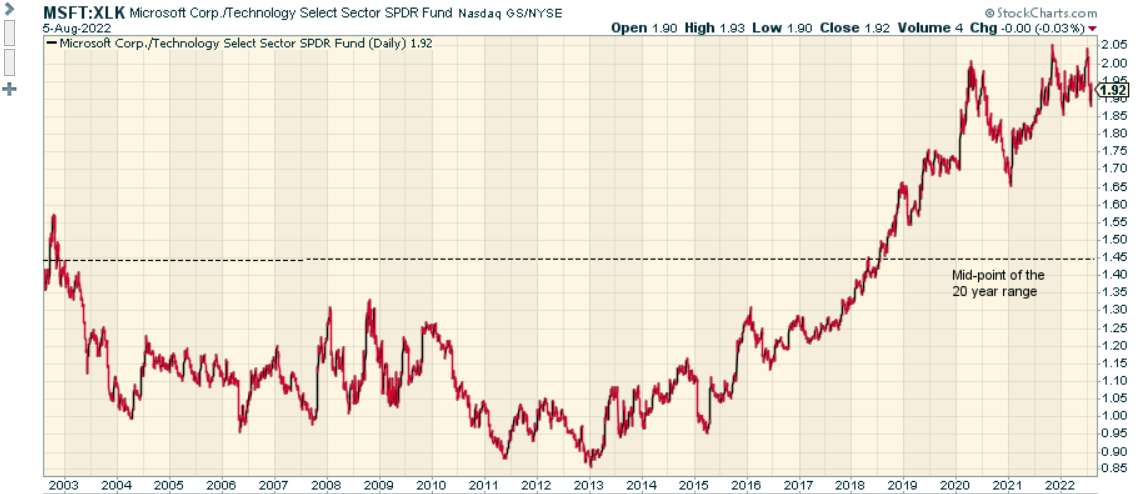
To conclude, whilst Microsoft certainly has the free cash generating potential and the balance sheet to fulfill its dividend objectives, its overall dividend profile is not the most compelling option around when you bring the other top tech peers into consideration. Besides, despite a decent correction this year, at the current price level, the MSFT stock still doesn’t offer useful risk-reward for those looking for rotational opportunities in the tech space.
Be the first to comment