

pinstock
Thesis
Eaton Vance Tax-Advantaged Dividend Income Fund (NYSE:EVT) is an equity focused closed end fund. The vehicle has the Russell 1000 Value Index as its benchmark and has total return as its main objective. The Russell 1000 Value Index seeks to track the investment results of an index composed of large- and mid-capitalization U.S. equities that exhibit value characteristics. The fund has a 20% leverage ratio and does not mirror one-to-one the index holdings, but tries to generate alpha by underwriting only certain names in the index. To that end, there are only 101 names in EVT’s portfolio, with the fund being overweight Financials versus the index.
The CEF has outperformed the index, both on 5- and 10-year lookback periods and has utilized its leverage wisely. We like to see equity CEFs that employ leverage outperform, otherwise there is no need for the CEF structure in order to obtain the respective equity index returns, with an investor being able to just utilize a plain vanilla index tracking ETF. The fund has 3-, 5- and 10-year annualized total returns which exceed 10% achieved with a high 10-year Sharpe ratio of 0.72. The vehicle pays monthly dividends, which are well-supported by the NAV performance. The CEF is currently trading at a very small premium to NAV of 2.48% and has a strong correlation with market risk-on/risk-off sentiment.
EVT is a robust fund with strong analytics that transforms the Russell 1000 Value Index long-term performance into monthly dividends. The fund has also managed to outperform the index, thus generating alpha. A retail investor looking for exposure to the sector would fare better by investing via EVT rather than a passive index tracking ETF such as the iShares Russell 1000 Value ETF (IWD). That being said, from a macro perspective, we at BTA believe we are in the midst of a bear market rally currently. Moreover, with the fund overweight financials, there are several factors to battle on that front as well – inversion of the yield curve which cuts banks’ net income margins and a ballooning of consumer credit which can generate loan loss provisions in a recessionary environment. We are therefore looking for another -10% down leg this year for the name correlated with a discount to NAV in order to consider it an attractive entry point.
Holdings
The fund contains 101 names in its portfolio:
Portfolio Overview (Fund Fact Sheet)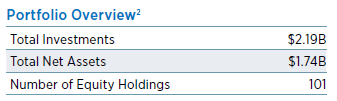
The vehicle is overweight Financials versus the index:
Sectors (Fund Fact Sheet)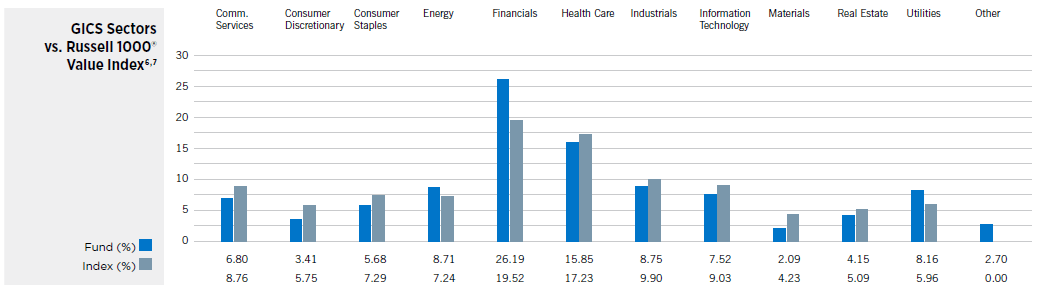
We can see from the sectoral table that EVT has a significant overweight position versus the index in Financials (more than 5% differential), with higher Energy and Utilities allocations as well. This is where the CEF structure can shine, with portfolio managers being able to generate alpha by their individual stock picks and allocations. We like to see this basis in equity CEFs because otherwise they would lose their purpose.
The top 10 holdings in the fund are well-known large capitalization equities:
Top 10 Holdings (Fund Fact Sheet)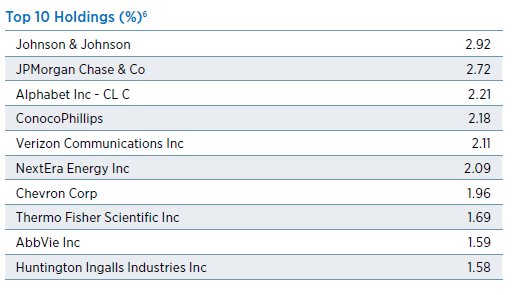
We can see from the table that the fund does not exhibit any single issuer concentration, with a 3% threshold for each individual name as of the current portfolio composition.
EVT Performance
The CEF benchmarks itself against the Russell 1000 Value Index as per the fund annual report:
Fund Performance (Fund Fact Sheet)
The fund is down -8% year to date, underperforming the index:
YTD Performance (Seeking Alpha)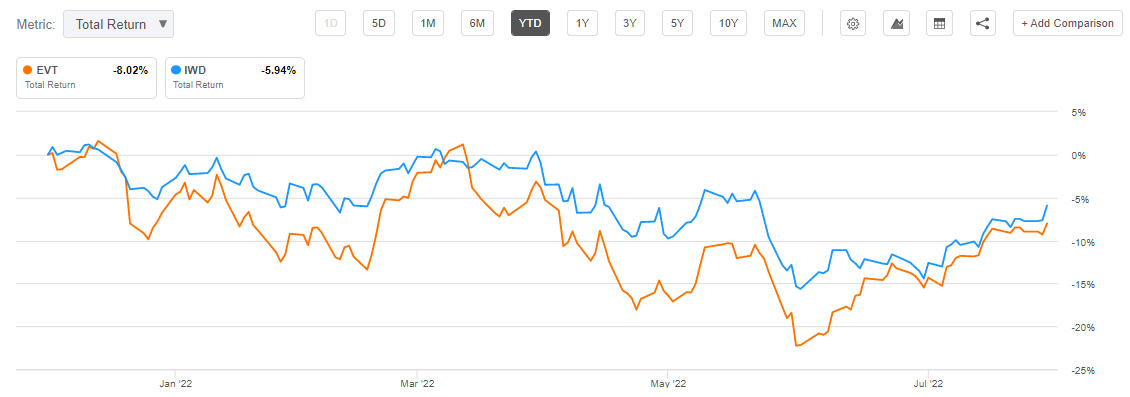
This underperformance is expected to a certain degree since the fund is leveraged. In a down market, leverage serves to amplify the move, in today’s environment a down move.
On a 1-year lookback the total return is equivalent between the CEF and the index:
1-Year Performance (Seeking Alpha)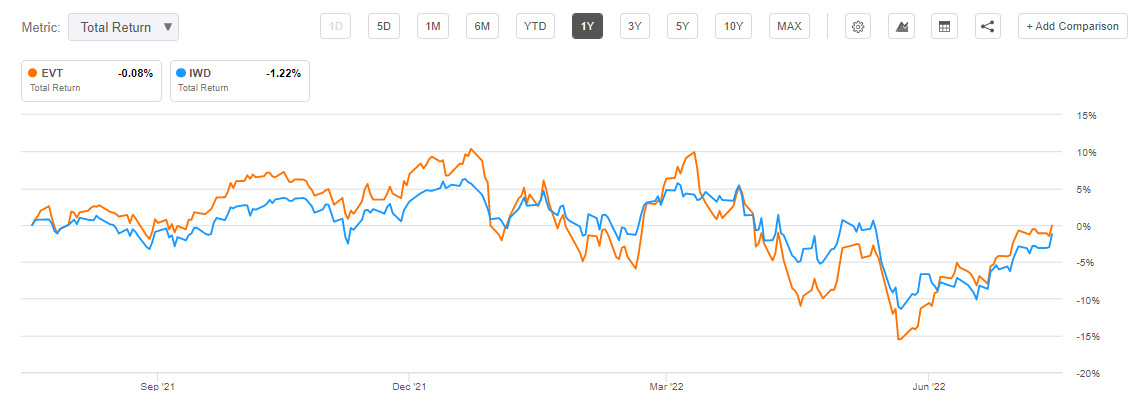
On a 5-year lookback the fund outperforms:
5-Year Performance (Seeking Alpha)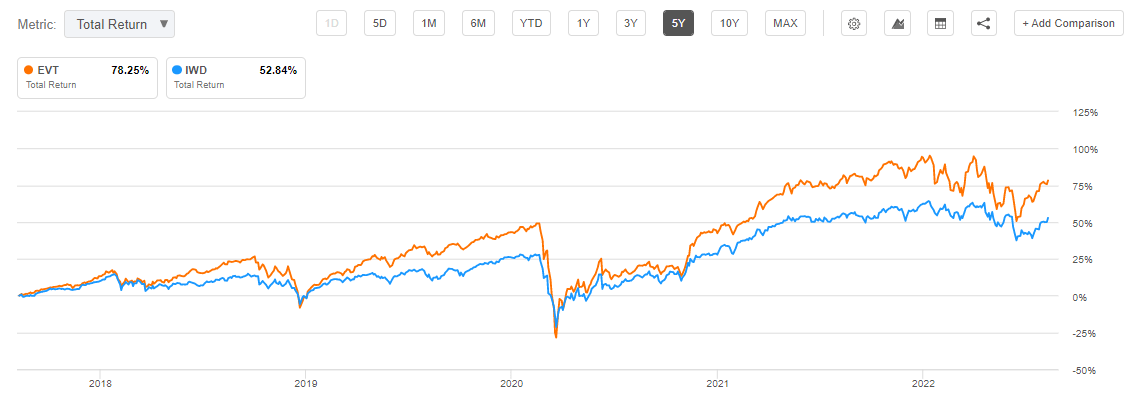
We can see that there is a significant CEF outperformance post the Covid crisis. Employing leverage in an up-market can result in significant gains, which looks like the case here.
A 10-year lookback paints a similar picture, with most of the outperformance coming in after the Covid crisis:
10-Year Total Return (Seeking Alpha)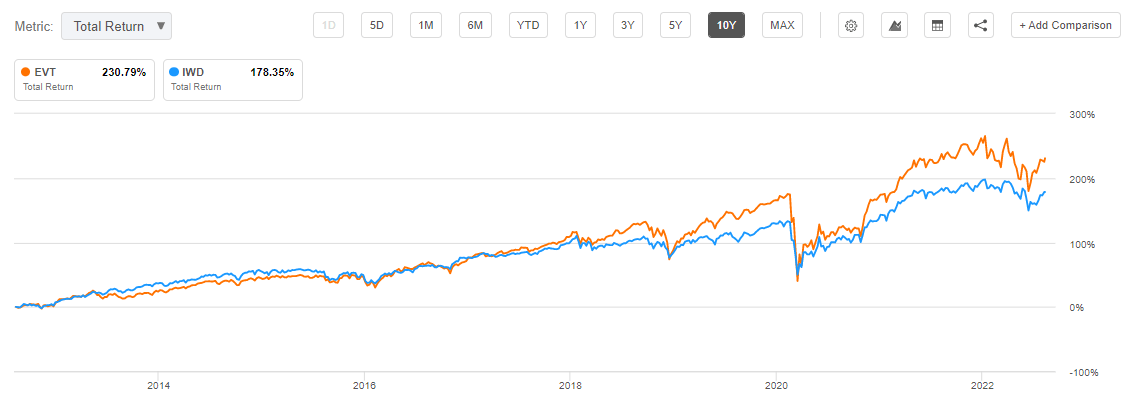
From a NAV perspective, the fund has an accreting value, denoting a healthy investment vehicle:
NAV Performance (CEFConnect)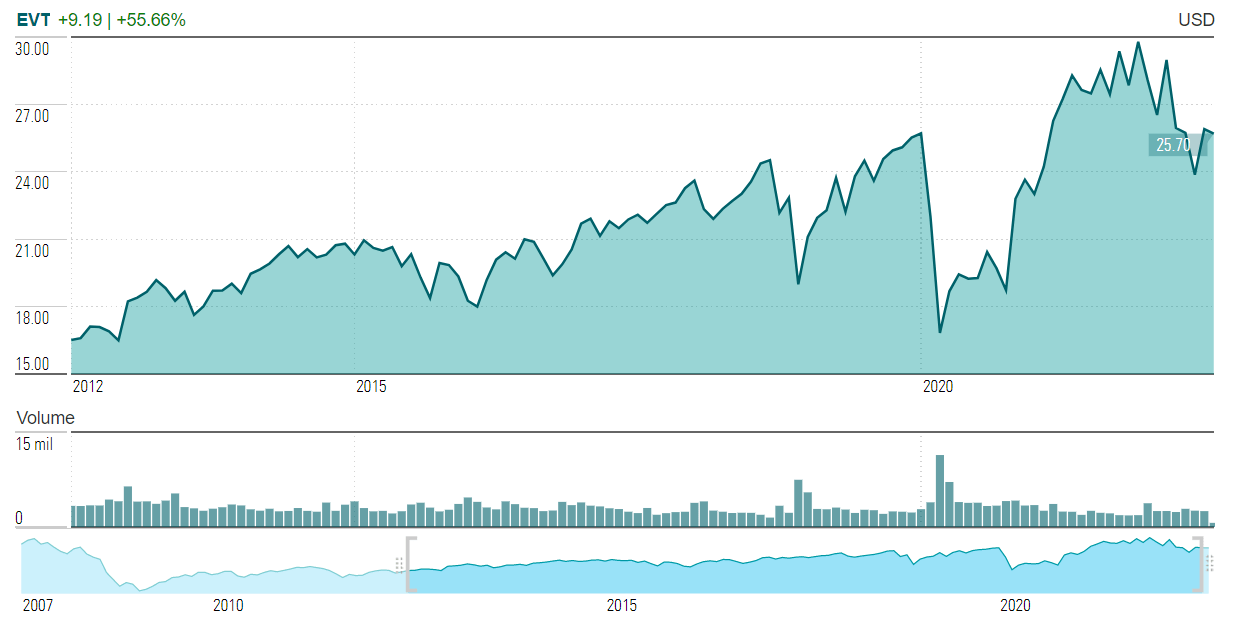
We like to see flat or accreting NAV profiles here. It denotes funds which do what they are supposed to do – create value for shareholders and distributing that via dividends. In the fixed income CEF space especially, there are many vehicles which artificially pump up their dividend yield to attract assets, but ultimately destroy their NAV via return of capital rather than true value creation.
Premium/Discount to NAV
The fund generally traded to a discount to NAV up to its period of outperformance versus the index:
Premium/Discount to NAV (Morningstar)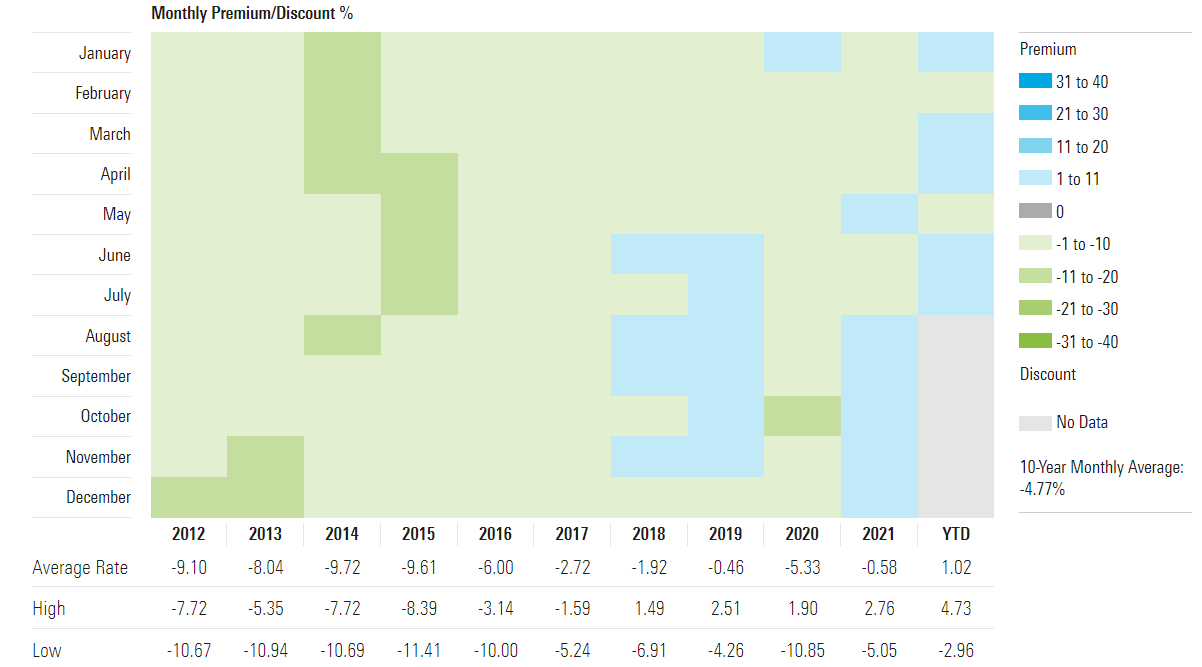
We can see from the above graphs that there is a strong correlation between the fund’s premium to NAV and its performance. The vehicle only started trading at a premium after its performance overshadowed the index. It generally works that way in the CEF space, where fund manager outperformance attracts outsized investor interest. The fund’s current premium is 2.48% and it has a 0.99 z-stat.
We can see a strong correlation between the fund’s premium/discount to NAV and market risk on / risk off sentiment:
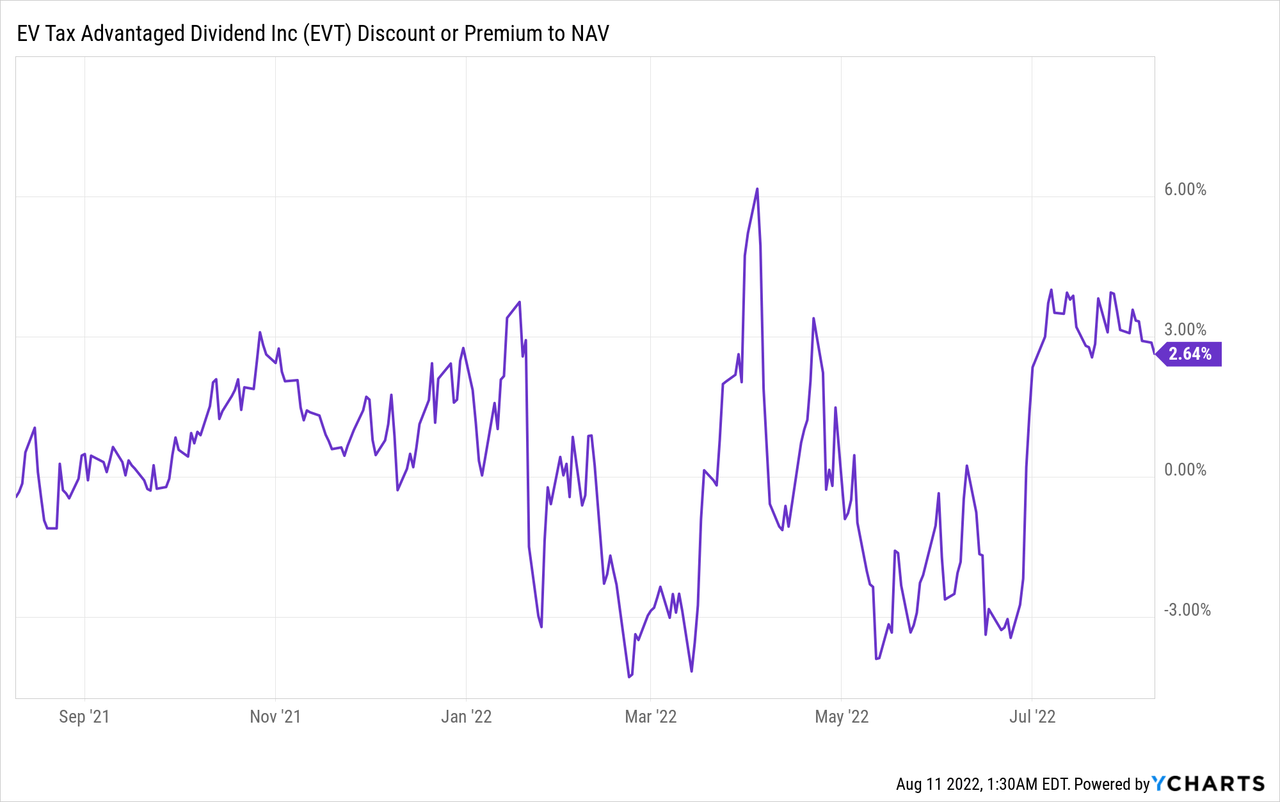
The vehicle traded at discounts during the height of the risk-off periods this year.
Distributions
The fund’s distributions are well covered, with the majority of the cash coming from realized long-term capital gains:
Distributions (Section 19.a.)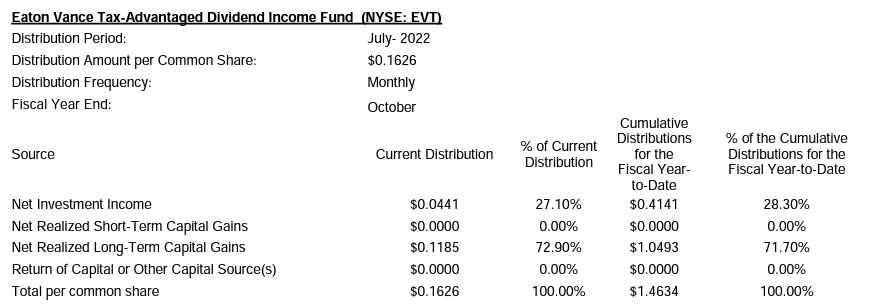
There is no return of capital here, which we like. This is a CEF which transforms equity market capital gains into dividends and it does that successfully and with a moderate amount of leverage.
Conclusion
EVT is a closed end fund with an equities focus. The vehicle has the Russell 1000 Value Index as its benchmark and has total return as its main objective. The fund has outperformed the index, both on 5- and 10-year lookback periods, generating annualized total returns exceeding 10%. The structure pays a 7.4% monthly dividend, supported by the fund’s long-term capital gains. With a 20% leverage ratio, the fund has managed to use it wisely, generating alpha by picking individual names which have outperformed the index. We like EVT and its performance, but feel there are macro headwinds at play. We are of the opinion we are in the midst of a bear market rally, and we are therefore looking for another -10% down leg this year for the name correlated with a discount to NAV in order to consider it an attractive entry point.
Be the first to comment