

Photon-Photos
Just over two months ago, I wrote on Evolution Mining (OTCPK:CAHPF), noting that the stock looked undervalued at barely 0.70x P/NAV after suffering one of the most violent declines among its peer group (75% decline from its highs). Since then, the stock has rocketed higher with a 60% rally in just thirty trading days, making it one of the top-performing gold miners in the period, just behind one of my favorite ideas, i-80 Gold (IAUX). This solid performance for Evolution Mining can be attributed to strong exploration results at Ernest Henry, a solid fiscal Q1 report, and a nice recovery in gold/copper prices.
While this sharp rally in Evolution Mining (“Evolution”) looks to have confirmed that we have seen a major bottom for the stock at A$1.80 [US$1.20], the stock has now found itself trading at a premium to net asset value and closer to what I believe to be its conservative fair value of US$2.00. It’s worth noting that this price target could end up being low if it can monetize Mt. Rawdon (Pumped Hydro Project), and it assumes a very conservative $1,725/oz long-term gold price; I don’t see any way to justify chasing the stock here above US$1.90 after a near parabolic short-term rally.
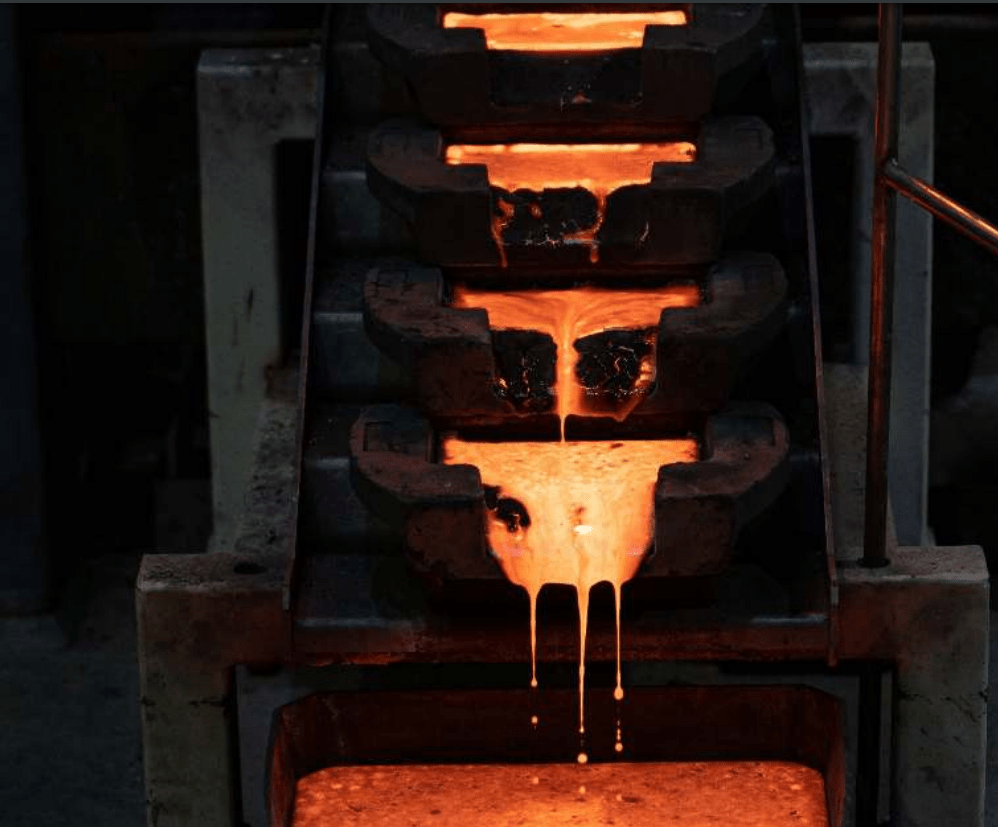
Evolution Mining Gold Pour (Company Presentation)
Unless otherwise noted, all figures are in United States Dollars, with AUD/USD conversions at a 0.70 exchange ratio for operating costs.
Q1 Production
While the North American gold producers just finished reporting their Q3 2022 results, the Australian Miners released their fiscal Q1 2023 (calendar year Q3 2022) results to the market with mixed results across the sector. However, Evolution’s results were solid, with the intermediate producer reporting production of ~161,100 ounces of gold, well on its way to meeting its annual production guidance of ~720,000 ounces (22.4% of guidance), with fiscal Q1 2023 expected to be the weakest quarter of the year with planned maintenance and the impact of heavy rain at Mt. Rawdon which led to a ~6,500-ounce shortfall in quarterly output.
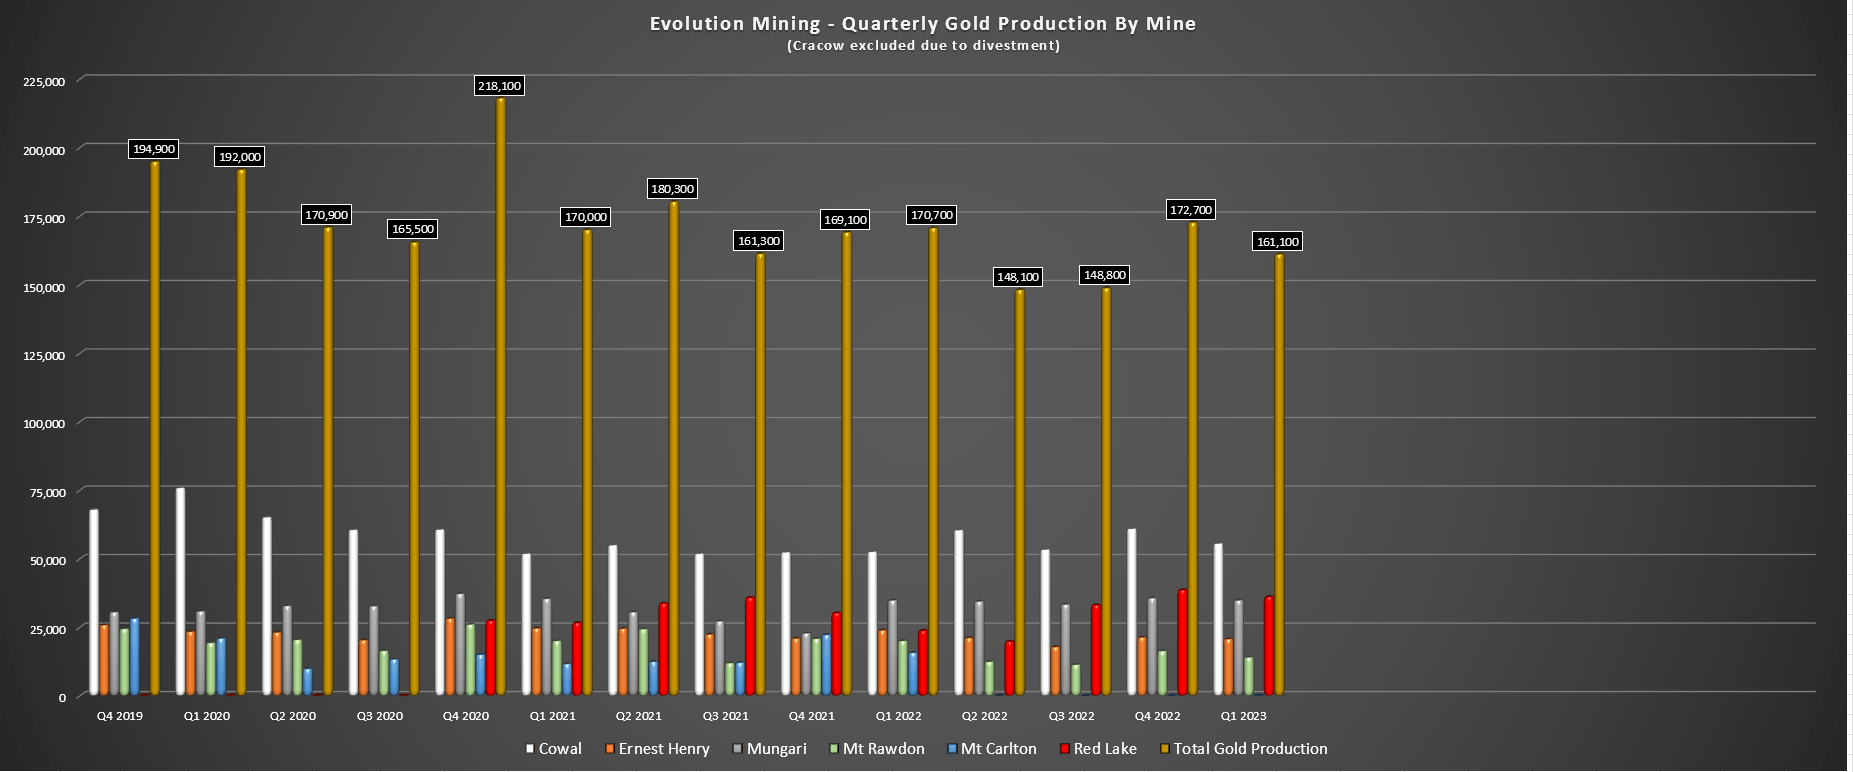
Evolution Mining – Quarterly Production by Mine (Company Filings, Author’s Chart)
Digging into the operations a little closer, Cowal had a solid quarter with production of ~55,500 ounces, a ~6% increase year-over-year due to better feed grades. These improved grades benefited from ~68,000 tonnes of development ore processed from Cowal Underground at an average grade of 1.96 grams per tonne of gold (~73,000 tonnes mined), pushing feed grades to 1.03 grams per tonne of gold, offsetting slightly lower throughput in the period. Notably, Cowal Underground mine development remains on budget and schedule, and the company also secured a competitive new long-term power supply agreement for Cowal, which is fixed for an eight-year contract.
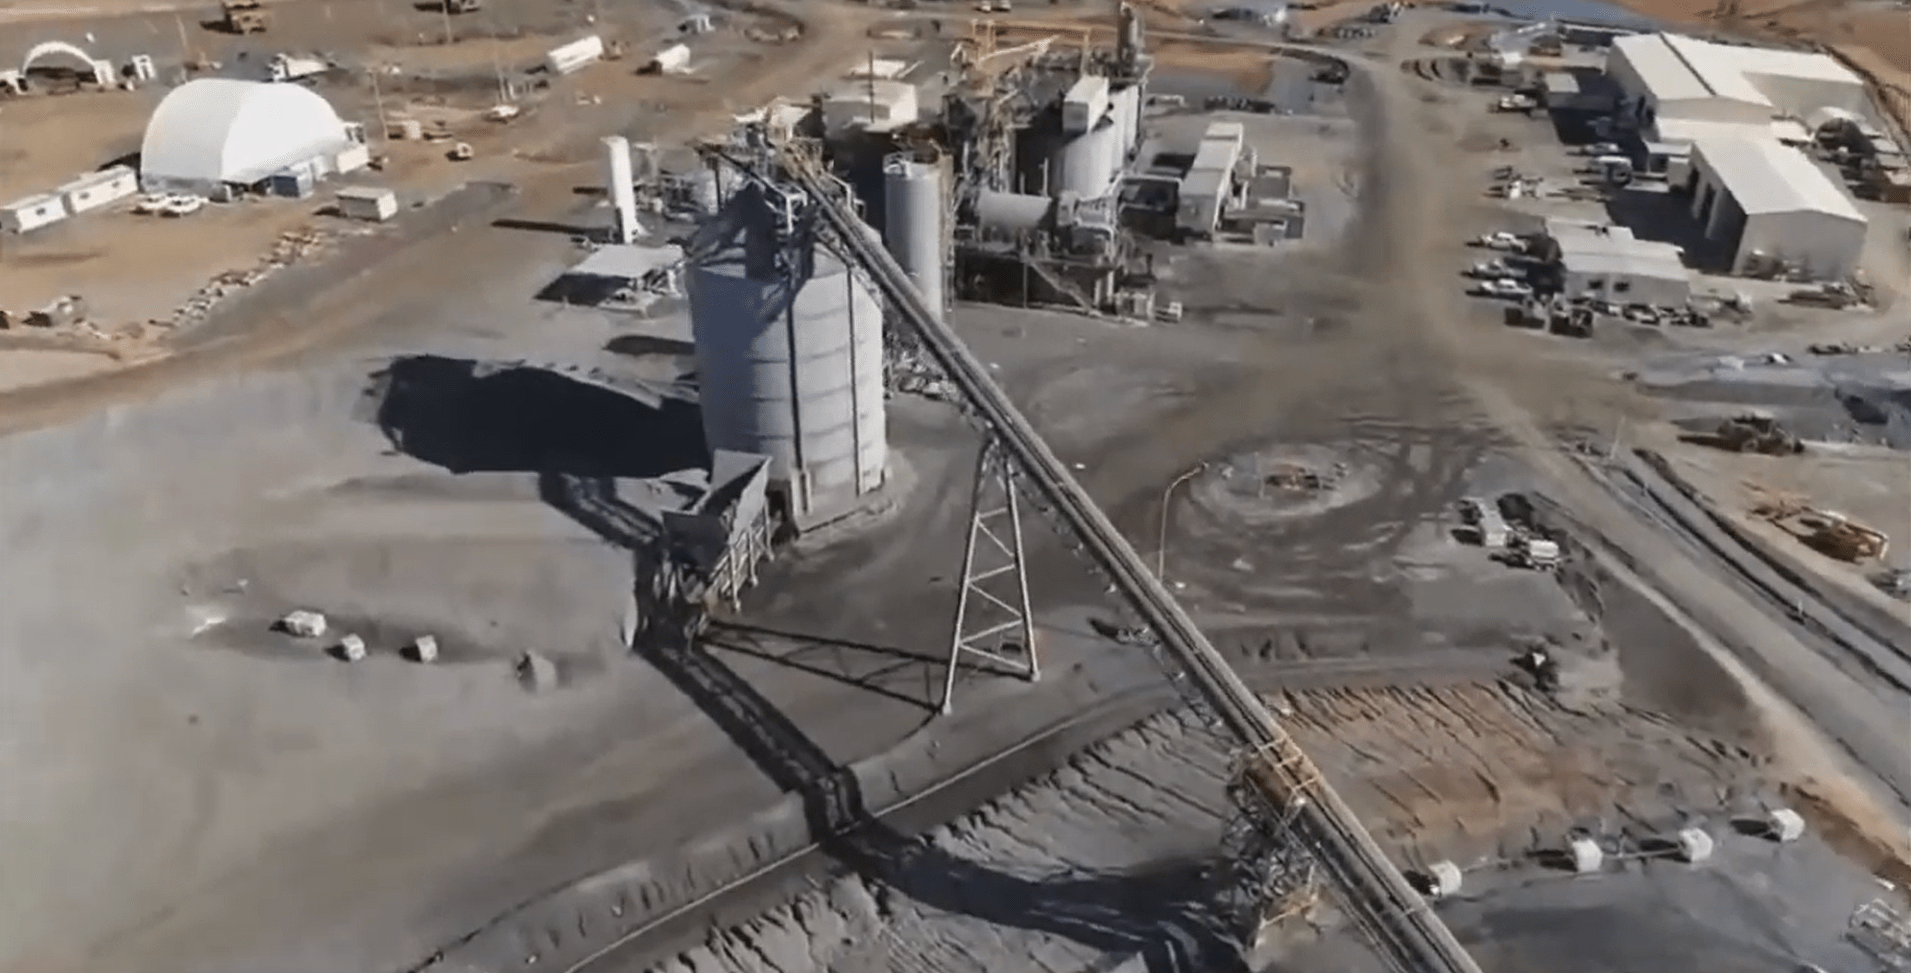
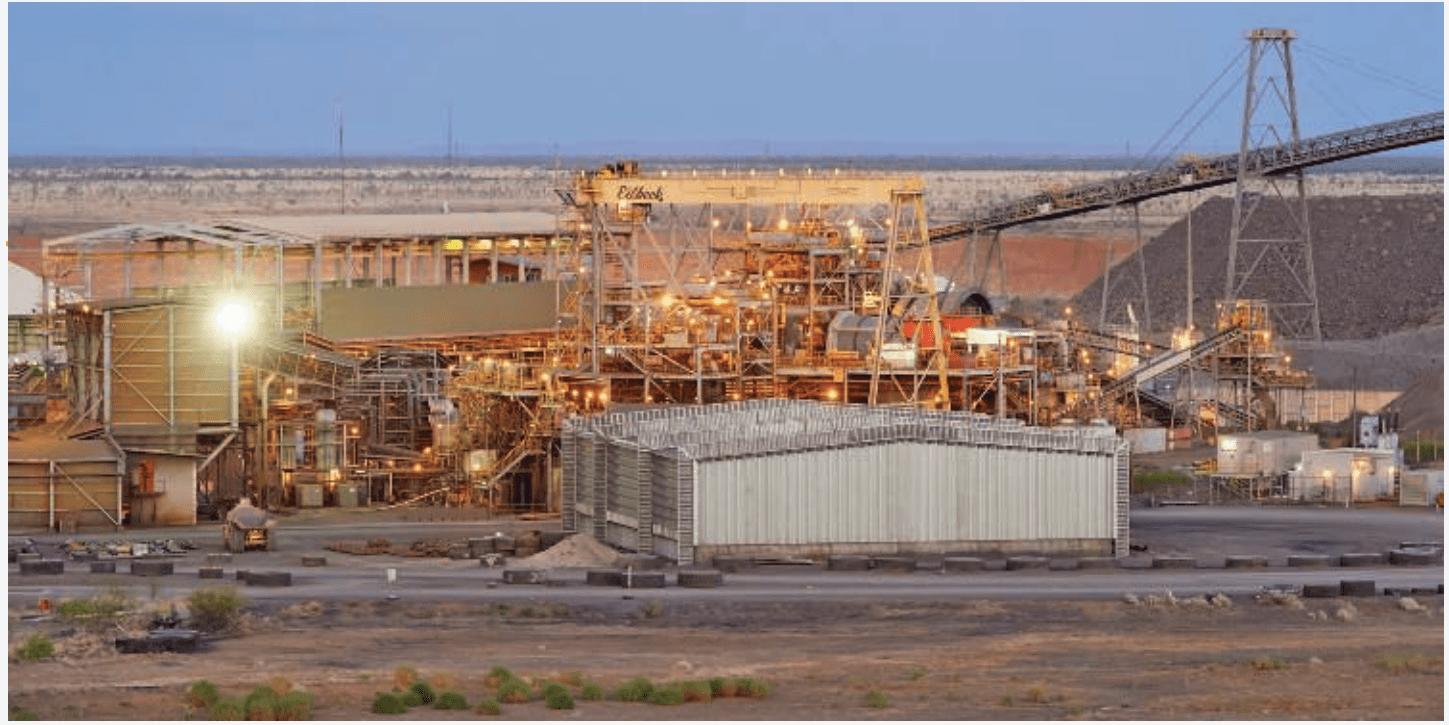
Mungari Operations (Company Video)
At Mungari, production was roughly flat year-over-year at ~34,800 ounces, which was in line with plans, but costs increased to A$2,128/oz, up from A$2,018/oz in the year-ago period. Evolution noted that this was due to a tighter labor market that led to an increased reliance on contractor labor and higher sustaining capital in the period (A$10.0 million vs. A$5.1 million). The elevated sustaining capital vs. the prior-year period was related to increased underground mine development, a TSF lift, and a new underground loader. While the labor situation isn’t ideal, the company noted that its seen net gains in employees in the past few months vs. lost employees from the March to June period, and it’s been able to run on a ~5% lower workforce due to efficiencies.
Ernest Henry Operations (Company Website)
Moving to Ernest Henry which is now entirely owned by Evolution Mining, the world’s lowest operation had another solid quarter despite production being lower year-over-year, with ~20,700 ounces produced at all-in-sustaining costs [AISC] of negative A$1,701/oz, or the equivalent of negative US$1190/oz. While gold production was down year-over-year (~20,700 vs. ~23,900), costs remained exceptionally low, with an AISC margin of more than A$4,000/oz. On a sequential basis, costs were slightly higher, albeit still deep in negative territory, due to by-product credits, impacted by fewer copper tonnes produced (~14,500 vs. ~15,300). That said, fiscal Q2 should be better, with the copper price up ~10% since fiscal Q1 2023 levels.
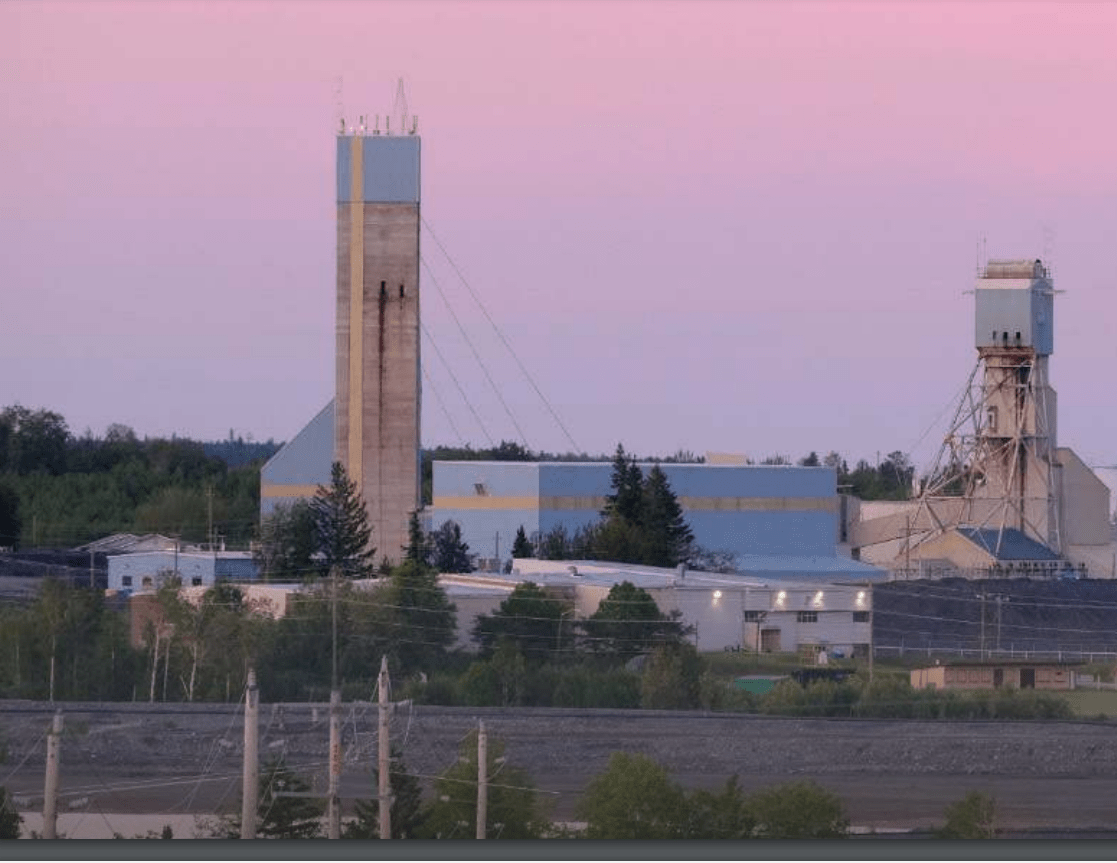
Red Lake Operations (Company Presentation)
Finally, at Red Lake, the company had an outstanding quarter, with ~36,100 ounces of gold produced at all-in-sustaining costs of A$2,266/oz [US$1,586/oz]. While these costs may not seem that impressive, this was a significant improvement from ~23,800 ounces at AISC of A$2,697/oz [US$1,888/oz] in fiscal Q1 2022. The operation benefited from much higher feed grades of 5.82 grams per tonne of gold in fiscal Q1 2023 vs. 4.70 grams per tonne last year, and mined grades soared to 6.56 grams per tonne of gold for September.
The grade improvement was related to the CYD Decline advancing into Upper Campbell, with the first stope ore from Upper Campbell mined and processed, delivering ~5,400 tonnes at an average grade of 7.91 grams per tonne of gold. Evolution noted that contribution from Upper Campbell would increase as the year progresses, with ~20% of ore contribution for the full year. This is a positive development, with higher grades at Upper Campbell vs. Red Lake. Notably, the Campbell Mill tertiary crusher was replaced and upgraded in fiscal Q1 2023, and a lift in throughput to 2,200 tonnes per day was approved (2,000 tonnes per day previously), giving the company a total capacity of ~1.6 million tonnes per annum (Bateman, Red Lake, Campbell mills).
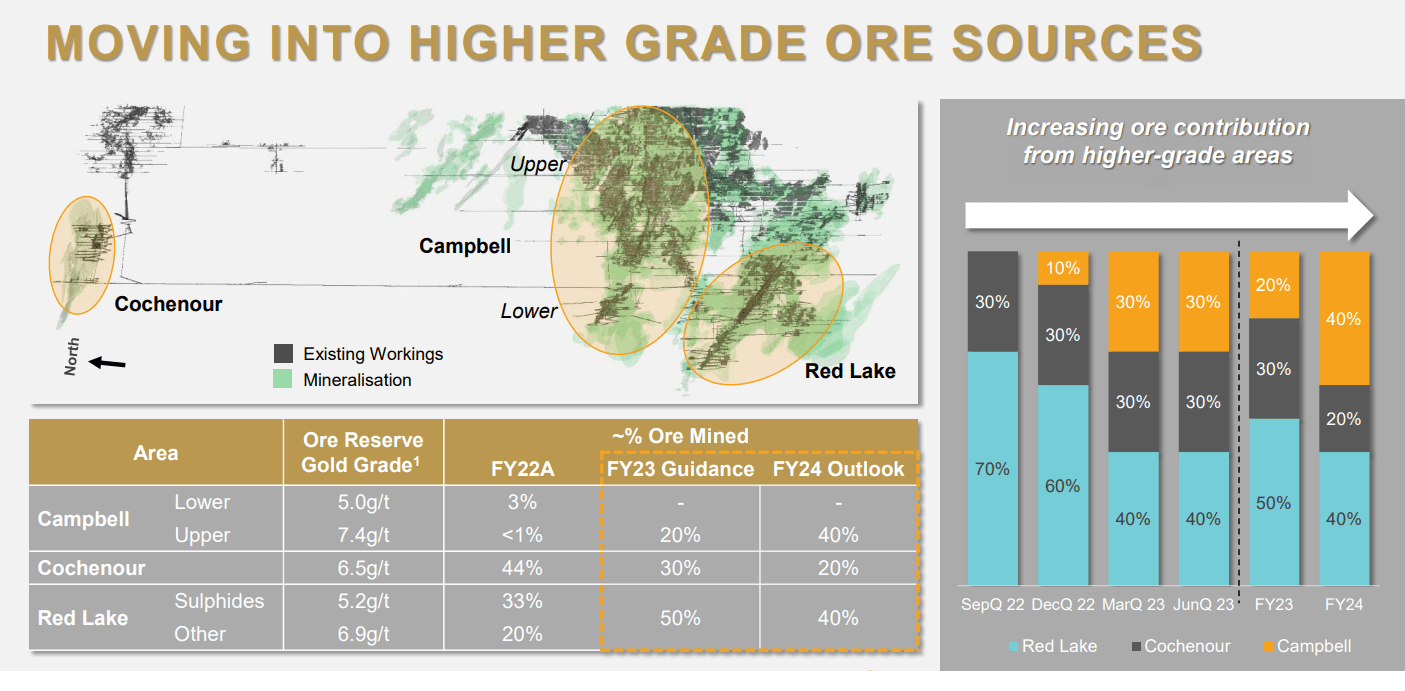
Red Lake Operations – Increased Contribution From Campbell, Cochenour (Company Presentation)
From a bigger picture standpoint, this operation is finally beginning to hit its stride, and the ultimate goal is to produce ~300,000 ounces per annum at what should be sub-A$1,725/oz [US$1,210/oz costs], up from an expected ~200,000 ounces at A$1,900/oz costs in FY2024. This might seem like a stretch vs. the current annualized run rate of ~145,000 ounces, but Evolution’s Red Lake operations benefit from considerable infrastructure (three shafts, a high-speed tram, and a decline that provides access to Upper Campbell and HG Young), and also a nearby workforce with the town of Red Lake. So, while the results may look mediocre today compared to assets like Cowal and Ernest Henry, I am optimistic that this asset has a bright future.
Costs & Margins
Moving over to costs and margins, the headline results certainly weren’t pretty, with Evolution’s AISC hitting a new high of A$1,513/oz [US$1,059/oz], which was well above its FY2023 guidance of ~720,000 ounces at A$1,240/oz. However, it’s worth noting that these costs are still among the lowest sector-wide vs. an industry average of US$1,300/oz in the calendar year Q3 2022, and while costs were up, margins didn’t compress much given the slightly higher average realized gold price in the period [A$2,414/oz vs. A$2,364/oz]. The result was that AISC margins fell to A$901/oz, down from A$951/oz in the period.
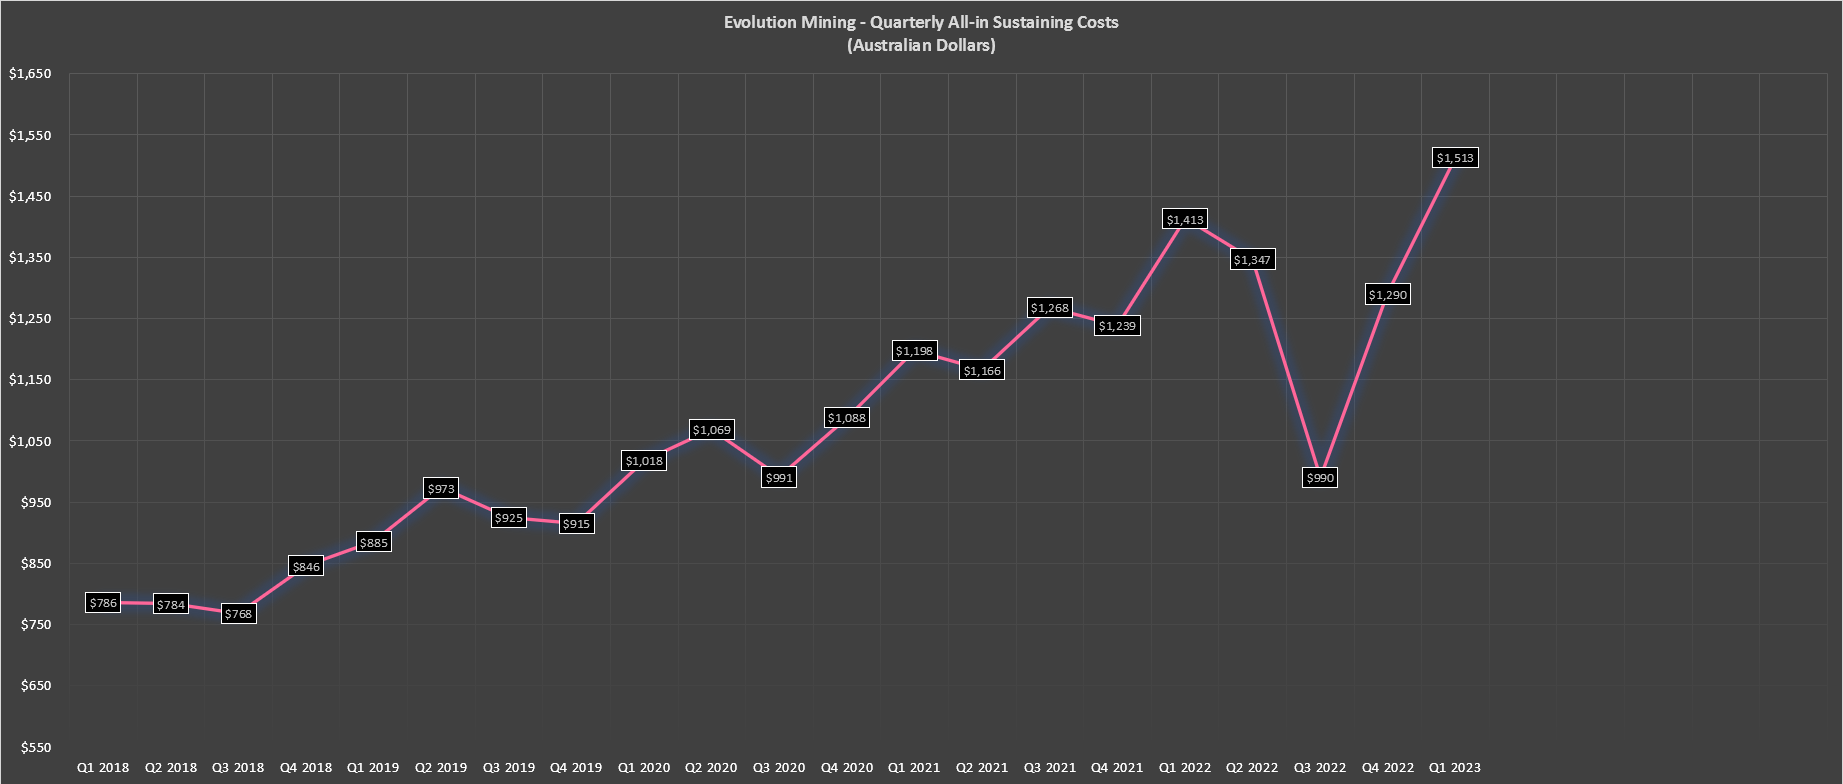
Evolution – Quarterly AISC (Company Filings, Author’s Chart)
While this cost increase might disappoint some investors, it’s worth noting that much of this was related to inflationary pressures, a tighter labor market, and a softer copper price than budgeted, all out of Evolution’s control. Besides, the company’s Red Lake operations significantly drag on its consolidated costs due to the elevated cost profile here. However, this should be a completely different operation at a ~300,000-ounce production profile if the company can continue to optimize the asset. So, with the combination of a tailwind on copper prices that will help Ernest Henry’s costs due to a favorable supply/demand outlook and improving costs at Red Lake, I see the future as bright in terms of Evolution maintaining its top decile margins.
Gold Futures Price – Australian Dollar (TradingView.com)
Finally, it’s worth noting that the gold price has improved considerably over the past month, as has the copper price, which should boost the company’s AISC margins in the upcoming quarter. Meanwhile, the company should see a lift in production as the year progresses, with maintenance out of the way, helping to lower unit costs as the company enjoys a larger denominator. Even if we assume an average realized price of A$2,550/oz in fiscal Q2 2023 and all-in-sustaining costs of A$1,10/oz, we would see margins jump by over 25% to A$1,140/oz vs. $901/oz in fiscal Q1 2023.
Valuation & Technical Picture
Based on ~1,835 million shares and a share price of US$1.90, Evolution Mining trades at a market cap of $3.49 billion and an enterprise value of ~$4.4 billion. This places the stock at a slight premium to its estimated net asset value of ~$3.20 billion, with Evolution now trading at 1.09x P/NAV after a strong 60% rally off its lows in the past 30 trading days. The result is that Evolution is now trading at closer to fair value based on what I believe to be a fair multiple of 1.15x P/NAV to reflect its Tier-1 jurisdictional profile and industry-leading margins offset by a weaker balance sheet than many of its peers. Using a 1.15x multiple, I see a fair value for the stock of US$2.00.
Red Lake Mine Mineralization (Company Presentation)
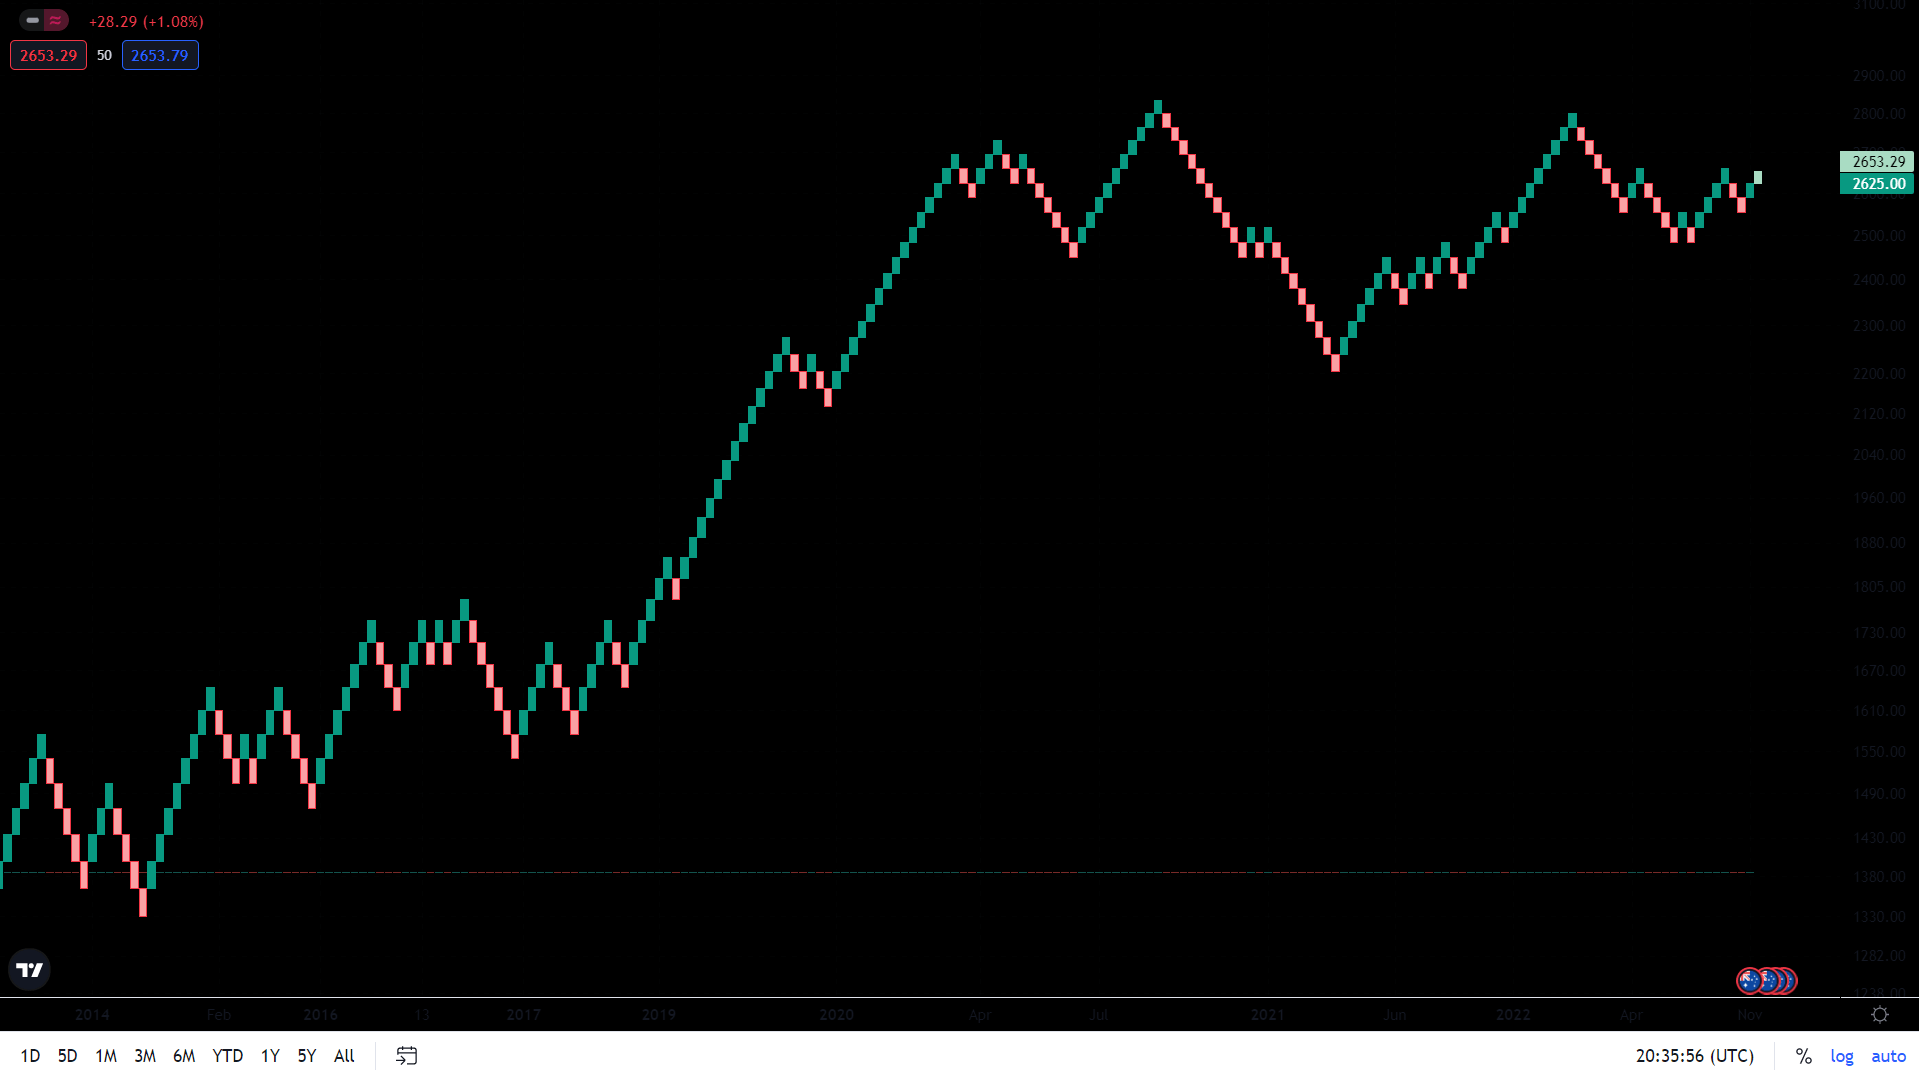
Given that I generally prefer a minimum 30% discount to fair value to justify starting new positions in mid-cap names, I do not see Evolution near a low-risk buy point. This is corroborated by the technical picture, with the stock now trading in the upper portion of its support/resistance range (US$1.20 – US$2.39) after a violent rally off the lows. Generally, the best time to buy producers is when they’re hated and being ridiculed, and long-term investors are selling positions out of disgust – which isn’t the case after this 60% rally.
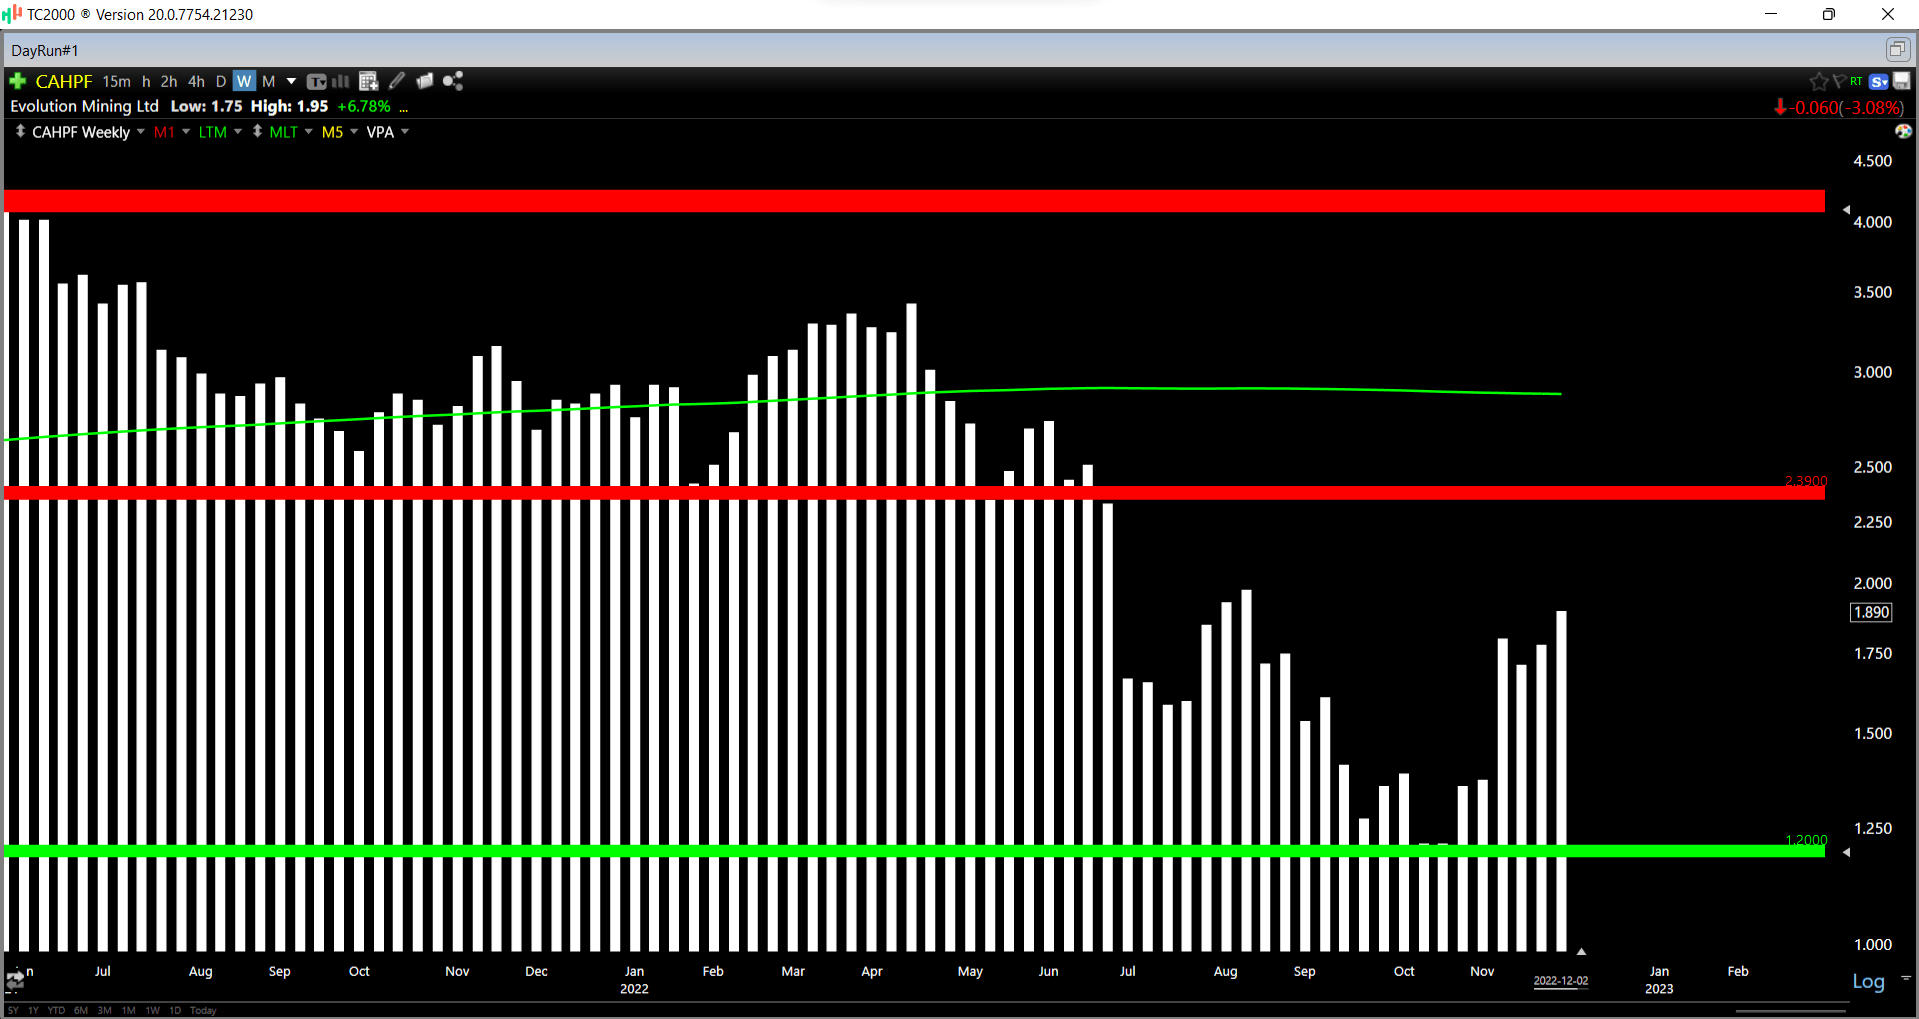
Evolution Weekly Chart (OTCPK:CAHPF) (TC2000.com)
That doesn’t mean that Evolution can’t head higher in what’s often a strong seasonal period for gold, but I prefer to get the correct price or pass entirely, and Evolution is now a little overbought short-term. Hence, if this rally continues into the new year, I would view any rallies above US$2.16 before February as profit-taking opportunities. This is because the stock would find itself within ~10% of significant resistance, a level where the stock broke down in June of this year.
Summary
Evolution has seen a solid start to FY2023 after a tough year that saw it exit FY2022 with a weaker balance sheet than its peers and underperformance vs. plans. Meanwhile, the company has a very bright future as it looks to grow production at an industry-leading growth rate (among intermediate producers) on a path to ~900,000 ounces per annum, and it benefits from very low jurisdictional risk in a time some jurisdictions are becoming harder to rely on long-term. That said, the share price looks to have priced in some of this recovery at ~1.10x P/NAV, suggesting that this isn’t the time to chase, and rallies above US$2.16 before February should present selling opportunities.
Be the first to comment