

cemagraphics
Written by Nick Ackerman, co-produced by Stanford Chemist. This article was originally published to members of the CEF/ETF Income Laboratory on September 25th, 2022.
Eaton Vance Short Duration Diversified Income Fund (NYSE:EVG) provides investors exposure to a short-duration portfolio. This is a multi-sector bond fund with the flexibility to invest where they see fit. The largest exposure of the fund is allocated to senior loans and mortgage-backed securities. Unfortunately, this strategy hasn’t provided any meaningful downside exposure despite the short duration.
This fund has an attractively high distribution yield. This is based on a 10% managed distribution plan that resets monthly. While they haven’t been able to cover this distribution previously, higher interest rates actually mean that coverage can improve going forward.
At the same time, while the distribution is eroding assets, it will be harder to take advantage of those higher rates. Due to the flexible nature of their portfolio, the net investment income will gyrate naturally anyway. That makes it harder to measure what coverage could look like going forward.
Since our previous update, the fund’s discount has narrowed a bit. That has helped to push the total return of the fund just into positive territory since we last covered the fund. With how erratic and volatile this market is, it could easily be pushed into negative territory in a day.
EVG Performance Since Previous Update (Seeking Alpha)
Additionally, since the last update, they’ve added more borrowings. That’s quite interesting, considering it would now drop the asset coverage materially combined with the NAV decline this year. On the other hand, those added assets could generate more income for the fund.
Considering these changes, I would be more cautious about EVG once again until the discount opens up. If you’re holding this fund already, it doesn’t seem that there would be a strong reason to sell, either.
The Basics
- 1-Year Z-score: -0.12
- Discount: 2.89%
- Distribution Yield: 10.65%
- Expense Ratio: 1.51%
- Leverage: 33.71%
- Managed Assets: $217 million
- Structure: Perpetual
EVG is a relatively simple fund; they “seek to provide a high level of current income.” The secondary objective is to “also seek capital appreciation to the extent consistent with its primary goal of high income.”
To do this, their investment policy is rather flexible as well. The fund “will invest at least 25% of its net assets in each of the following three investment categories: [i] senior, secured floating rate loans made to corporate and other business entities, which are typically rated below investment grade; [ii] bank deposits denominated in foreign currencies, debt obligations of foreign governmental and corporate issuers, including emerging market issuers, which are denominated in foreign currencies or U.S. dollars, and positions in foreign currencies; and [iii] mortgage-backed securities that are issued, backed or otherwise guaranteed by the U.S. Government or its agencies or instrumentalities or that are issued by private issuers.”
A Closer Look At The Leverage And Expenses
The leverage they carry is split between structural and portfolio leverage. Borrowings make up the most of this, with derivatives such as future contracts.
EVG Leverage (Eaton Vance)
Besides future contracts, they also have various credit default swaps and forward foreign currency exchange contracts to provide hedges in their portfolio. Interestingly, in their semi-annual report, I don’t see any interest rate swaps at the end of April 30th, 2022. In the previous annual report, they had quite a few of these swaps.
Those are often utilized to protect against the rising expenses of borrowings in the portfolio. As rates rise, the expenses for borrowing will also increase. Interest rate swaps are a way to essentially change a variable rate into a fixed rate for all or a portion of the borrowings.
That being said, the futures contracts are short on various Treasury Notes and Euro debt. That means that bond prices will decline when rates rise, and these contracts will experience gains. That was good for nearly $1.5 in gains in the last report.
The fund also increased its borrowings earlier this year. A move that perhaps they might be regretting now as interest rate projections have only become more aggressive due to sticky inflation. Their credit agreement is based on SOFR plus a spread. At the end of April 30th, 2022, the interest rate was 1.57%. That was quite the increase from the average borrowings for the six months of 1.11%.
The increased borrowings pushed the total expense ratio (including leverage) to 2%. The move from $43 million in borrowings to $61 million was pushing that expense higher, besides the interest rate. The borrowings have fluctuated quite a bit over the years too. So this could have been changed already. We can also see from the above that in 2019, the total expense ratio topped at 2.55%. This rate hiking cycle is more aggressive, so we should see this go meaningfully higher.
EVG Semi-Annual Report (Eaton Vance)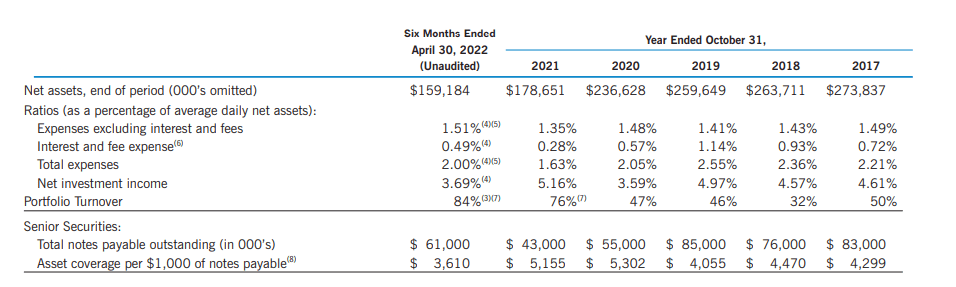
In summary, they’ve borrowed more, and we’ve headed lower. That has pushed up their borrowing expenses and expense ratio at this point. The borrowing expenses were already being pushed up a bit from interest rate increases. This, too, will be even higher when they post their next report. At the same time, the increased borrowings could lead to more income generation on the fund.
EVG Performance – No Benefit From “Short Duration”
One reason to consider EVG was for the “short duration.” However, that doesn’t appear to be working out tremendously well. The portfolio’s effective duration came to 2.1 years at the end of Q2 2022. The leverage in the portfolio would have also contributed to the downside push.
Here’s a look at a comparison between several ETFs. I’ve included the Vanguard Total Bond Market (BND) with its hefty 6.7 average duration. Then I’ve also included iShares iBoxx High Yield Corp (HYG), which carries a duration of 4.19 years. Then I’ve also included the Invesco Senior Loan (BKLN), which doesn’t share its duration but, suffice it to say, would be low.
Ycharts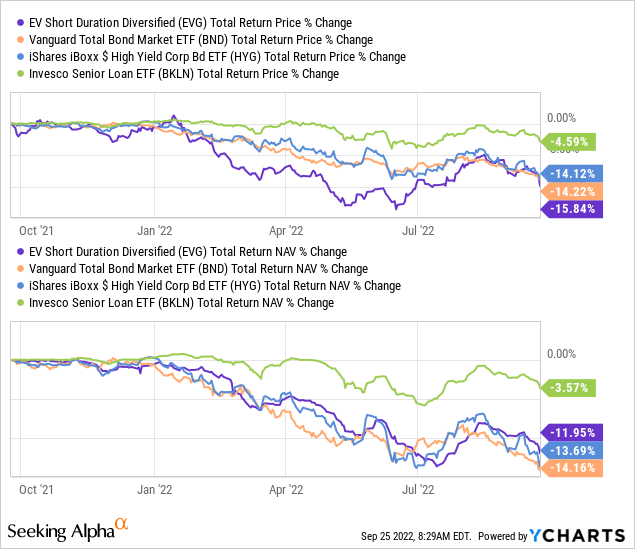
In this case, EVG’s total NAV return has come out on top compared to BND and HYG. However, it was only doing marginally better, in my opinion.
That is despite nearly a third of the portfolio having floating rate exposure. Due to the outperformance relative to the share price, the discount has opened up this year. However, that’s because it was at an unusual premium heading into this year. Over the longer-term, this fund generally trades at a discount.
Ycharts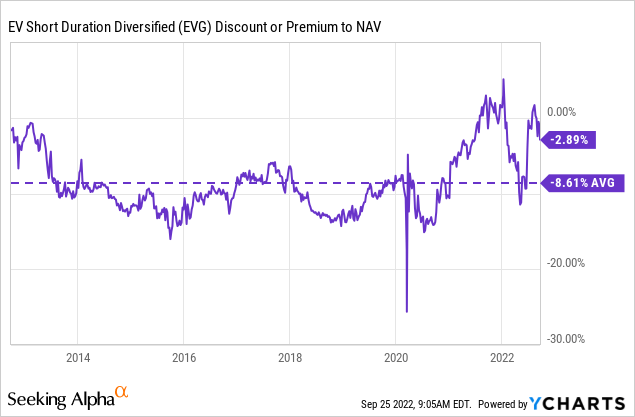
Some interesting comparisons between other CEFs show that there could be some better alternatives if one wanted to make a swap. In this case, PGIM Short Duration High Yield Opportunities (SDHY) has performed almost identically to EVG on a total NAV return YTD basis. In fact, the fund outperformed just a touch. The duration for SDHY came to 2.7 years, too. They invest in mostly below-investment-grade bonds, whereas EVG is more split between junk and investment grade.
There is also the First Trust High Yield Opportunities 2027 Term (FTHY). This fund carries a higher effective duration of 4.04 years. The fund is split between high-yield and senior loans.
Ycharts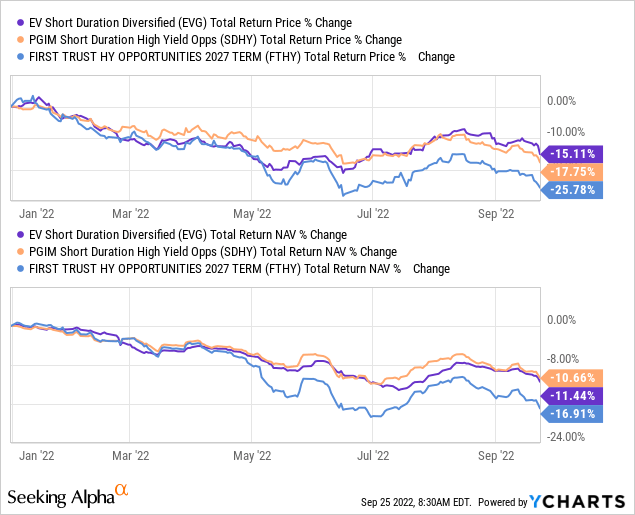
While FTHY hasn’t performed as well on a YTD basis, I consider it able to compete going forward. This would be primarily based on the discounts we see in FTHY and SDHY relative to EVG. FTHY also can go higher into the senior loan space.
Ycharts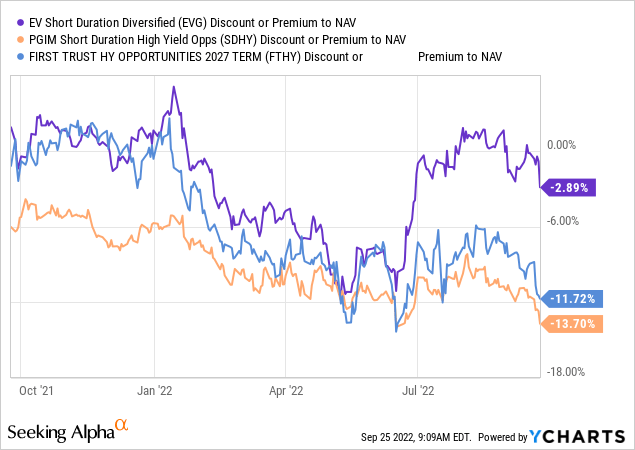
Distribution – 10% Managed Plan
EVG pays a managed distribution plan based on 10% of the fund’s NAV. This is a relatively newer development in the last couple of years. It gets reset monthly, and with the NAV declining this year, it has been mostly downward, as expected.
EVG Distribution History (CEFConnect)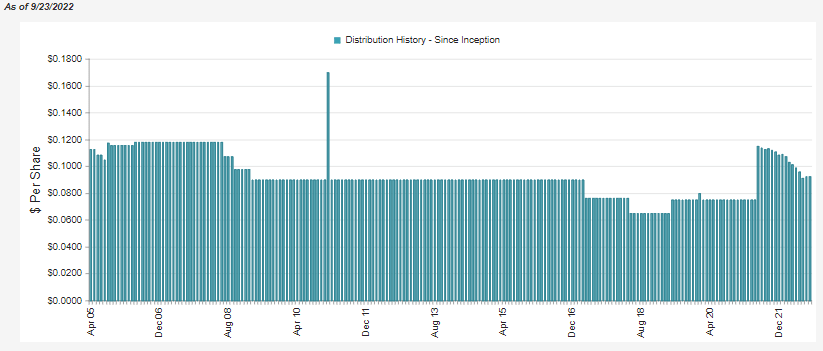
That being said, it has inched up in the last two months as the market began to recover. Of course, September has now reversed that recovery, and we are heading lower. We should expect the distribution to be lower going forward once again.
Another interesting change since we last covered the fund is the decline in NII we have seen relative to the prior fiscal year. If we annualized the $0.232, we would see a nearly 35% drop from the previous year. That is, despite the higher leverage and the floating rate exposure, that should be beneficial going forward.
EVG Semi-Annual Report (Eaton Vance)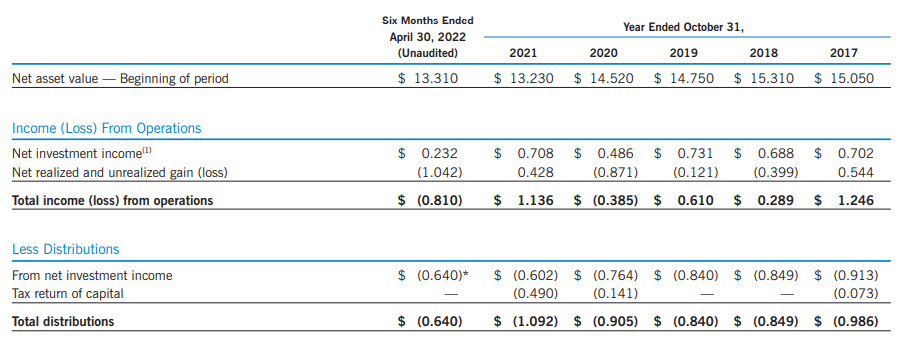
At the end of April, interest rates were beginning their climb higher. Therefore, the full impact of higher rates hasn’t been felt. However, given the significant drop in NII, I find it hard to believe that coverage would be sufficient in the next report. That would be given the 36.25% NII distribution coverage we see here.
It isn’t impossible, as more portfolio shifts, combined with higher leverage and higher rates, could push it there. It is just a large cap to cover. Every time the fund doesn’t cover the distribution through NII or capital gains, that would mean more erosion for the fund. That puts it in a situation where it becomes harder and harder to keep the distributions flattish. There will always be variations in the distribution, but it would be relatively more stable if it were being covered.
EVG’s Portfolio
EVG’s significant exposure to investment grade is one thing that stands out. They are a mixed portfolio, where most CEFs are primarily high-yield focused, even on multi-sector bond funds.
EVG Credit Quality (Eaton Vance)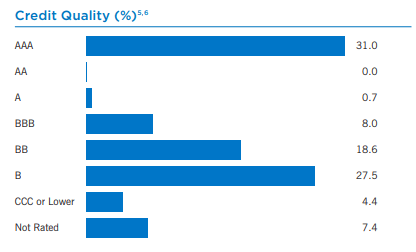
Despite this significant weighting of 31% in AAA, the fund duration is still minimal. As mentioned above, it was last reported at just 2.1 years. Typically, the higher the bond’s credit quality, the more interest rate sensitive they are.
The fund is primarily invested in U.S. debt, at an over 89% weighting. Most of the portfolio is invested in senior loans, then mortgage-backed securities and collateralized loan obligations. CLOs are pooled senior loans that are then broken up into different tranches with their own ratings. That means another ~12% of the portfolio is invested in floating rate exposure. That puts this fund’s floating rate exposure at least around 42%.
EVG Asset Mix (Eaton Vance)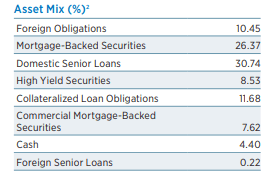
That’s what helps contribute to a rather low duration. What is interesting, though, is that it hasn’t seemed to benefit the fund substantially in terms of total return performance for the year. Case in point, SDHY had a higher duration and performed better on a total NAV return basis.
Additionally, SDHY is invested largely in junk bonds. They carry only 9.8% between AAA and BBB; the remainder is all BB and lower. Meaning that reduced credit risk isn’t seemingly helping out EVG either.
Conclusion
EVG has several risks, as does everything in this market. However, they also have a short-duration portfolio that isn’t seeming to help them out. A fund such as SDHY might be a better opportunity at this time. Even FTHY is a worthwhile candidate due to its valuation. Though you are getting a bit of a different exposure with either of these funds, they aren’t flexible like EVG is.
EVG’s distribution is quite attractive, but as the NAV continues to decline, that should also continue to slide. Based on the 10% managed distribution, it will always be higher, though. If the fund returned to a discount more in line with its historical level, I would once again be more interested. I don’t see the risks worth the valuation at this time.
Be the first to comment