

Euro, EUR/USD, EUR/CHF – Talking points
- EUR/USD appears likely to test the lower end of a 6-week range
- EUR/CHFhas inched below recent support but follow through is lacking
- Bearish momentum might be unfolding for Euro, will prior lows hold?
EUR/USD TECHNICAL OUTLOOK
Since the end of February, EUR/USD has been caught in a 1.0806 – 1.1185 range. The lower bound of the range is the lowest since May 2020.
While the sell-off has paused over the last month, bearish momentum might be re-emerging.
A bearish triple moving average (TMA) formation requires the price to be below the short term simple moving average (SMA), the latter to be below the medium term SMA and the medium term SMA to be below the long term SMA. All SMAs also need to have a negative gradient.
When looking at the 10-, 21-, 34-, 55-, 100- and 200-day SMAs, the criteria for a TMA have been met using any combination of these SMAs.
Support could be at the recent low of 1.0837 and a breach of that level could see the March low of 1.0806 tested. Below there, the March 2020 low of 1.0636 may provide support.
On the topside, potential resistance might be at the previous highs and pivot points of 1.0945, 1.1138, 1,1185. Further up, resistance could be at 1.1274, 1.1280, 1.1396, 1.1483 and 1.1495.
Resistance may also be at the descending trend line, currently dissecting at 1.1100. The SMAs themselves are also possible resistance levels.
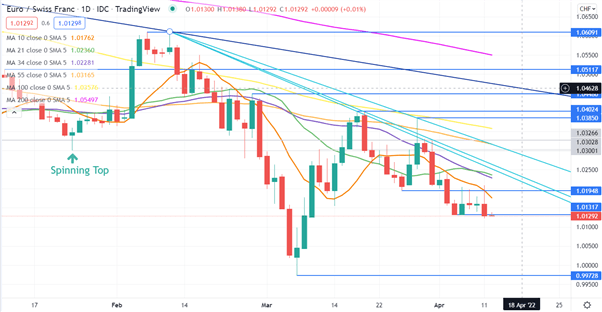
EUR/CHF TECHNICAL ANALYSIS
EUR/CHF has a similar set-up to EUR/USD. The intra-European cross rate rallied from a low of 0.9973 in early March and is now looking to potentially re-affirm a descending trend.
That low in March was the lowset EUR/CHF has traded at since the Swiss National Bank (SNB) abandoned protecting the so-called “Swissy” from what it perceived to be overvaluation in 2015.
Looking at the 10-, 21-, 55-, 100-, 200-day SMAs, the TMA criteria has been met.
The price is currently looking for a possible break below 1.0132, a support that has held for the last week. The next level of support might be at 0.9973.
On the topside, resistance could be at the prior highs of 1.0385, 1.0402 and 1.0448.
Closer by, the descending trend lines may also offer resistance, currently dissecting at 1.0250, 1.0260 and 1.0310. The latter coinciding with the 55-day SMA.
— Written by Daniel McCarthy, Strategist for DailyFX.com
To contact Daniel, use the comments section below or @DanMcCathyFX on Twitter
Be the first to comment