

EUR/USD Rate Talking Points
EUR/USD trades to a fresh yearly low (1.0354) as a bear flag formation unfolds, and the oversold reading in the Relative Strength Index (RSI) is likely to accompany a further decline in the exchange rate as the bearish momentum appears to be gathering pace.
EUR/USD Rate Eyes 2017 Low as Bear Flag Formation Unfolds
EUR/USD is on the cusp of testing the 2017 low (1.0340) as it depreciates for the fifth consecutive week, and failure to hold above the 2003 low (1.0334) may push the exchange rate towards parity as the Federal Reserve normalizes monetary policy ahead of its European counterpart.
As a result, EUR/USD may continue to depreciate ahead of the next Federal Open Market Committee (FOMC) interest rate decision on June 15 as the central bank appears to be on track to deliver another 50bp rate hike, and it seems as though the shift in the European Central Bank’s (ECB) forward guidance will do little to influence the exchange rate even as President Christine Lagarde insists that “it is appropriate for policy to return to more normal settings.”
The ECB appears to be on a preset course as it plans to conclude its asset purchases in the third quarter of 2022, and the Governing Council may merely attempt to buy time at its next meetings on June 9 as President Lagarde reiterates that “the first rate hike, informed by the ECB’s forward guidance on the interest rates, will take place some time after the end of net asset purchases.”
Nevertheless, President Lagarde acknowledged that “this could mean a period of only a few weeks” as the Governing Council comes under pressure to tame inflation, but current market conditions may continue to drag on EUR/USD especially as the US Dollar benefits from the deterioration in risk appetite.
In turn, the oversold reading in the RSI is likely to accompany a further decline in EUR/USDlike the price action seen earlier this year, while the tilt in retail sentiment looks poised to persist as traders have been net-long the pair since mid-February.
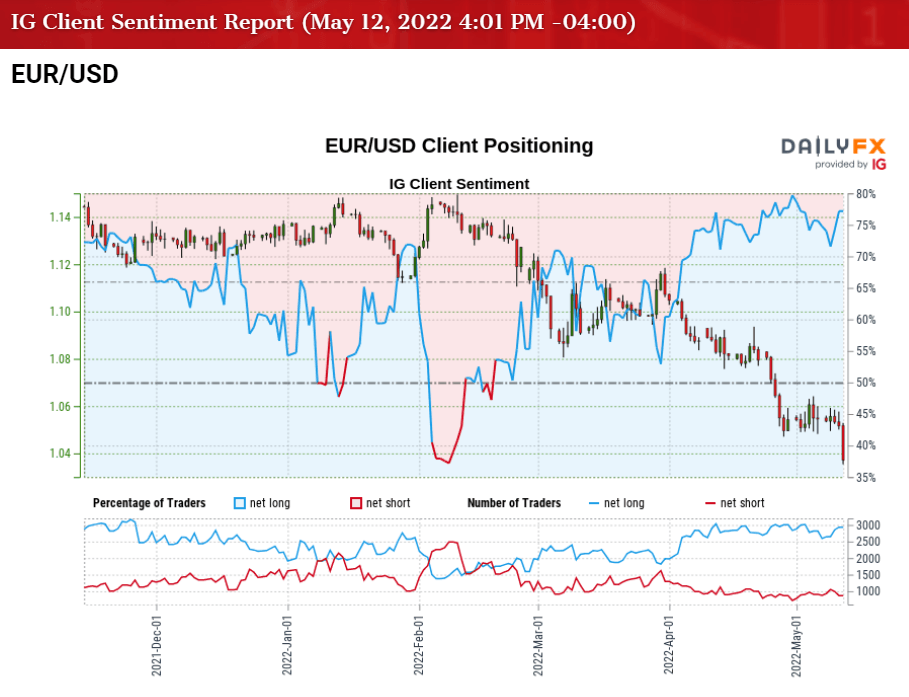
The IG Client Sentiment report shows 78.30% of traders are currently net-long EUR/USD, with the ratio of traders long to short standing at 3.61 to 1.
The number of traders net-long is 2.32% higher than yesterday and 1.00% lower from last week, while the number of traders net-short is 18.38% lower than yesterday and 8.73% lower from last week. The marginal decline in net-long interest has done little to alleviate the crowding behavior as 72.27% of traders were net-long EUR/USD earlier this week, while the decline in net-short position comes as the exchange rate trades to a fresh yearly low (1.0354).
With that said, EUR/USD the 2017 low (1.0340) as the RSI sits in oversold territory, but failure to test the 2003 low (1.0334) may pull the oscillator back above 30 if the key price region acts as support.
EUR/USD Rate Daily Chart
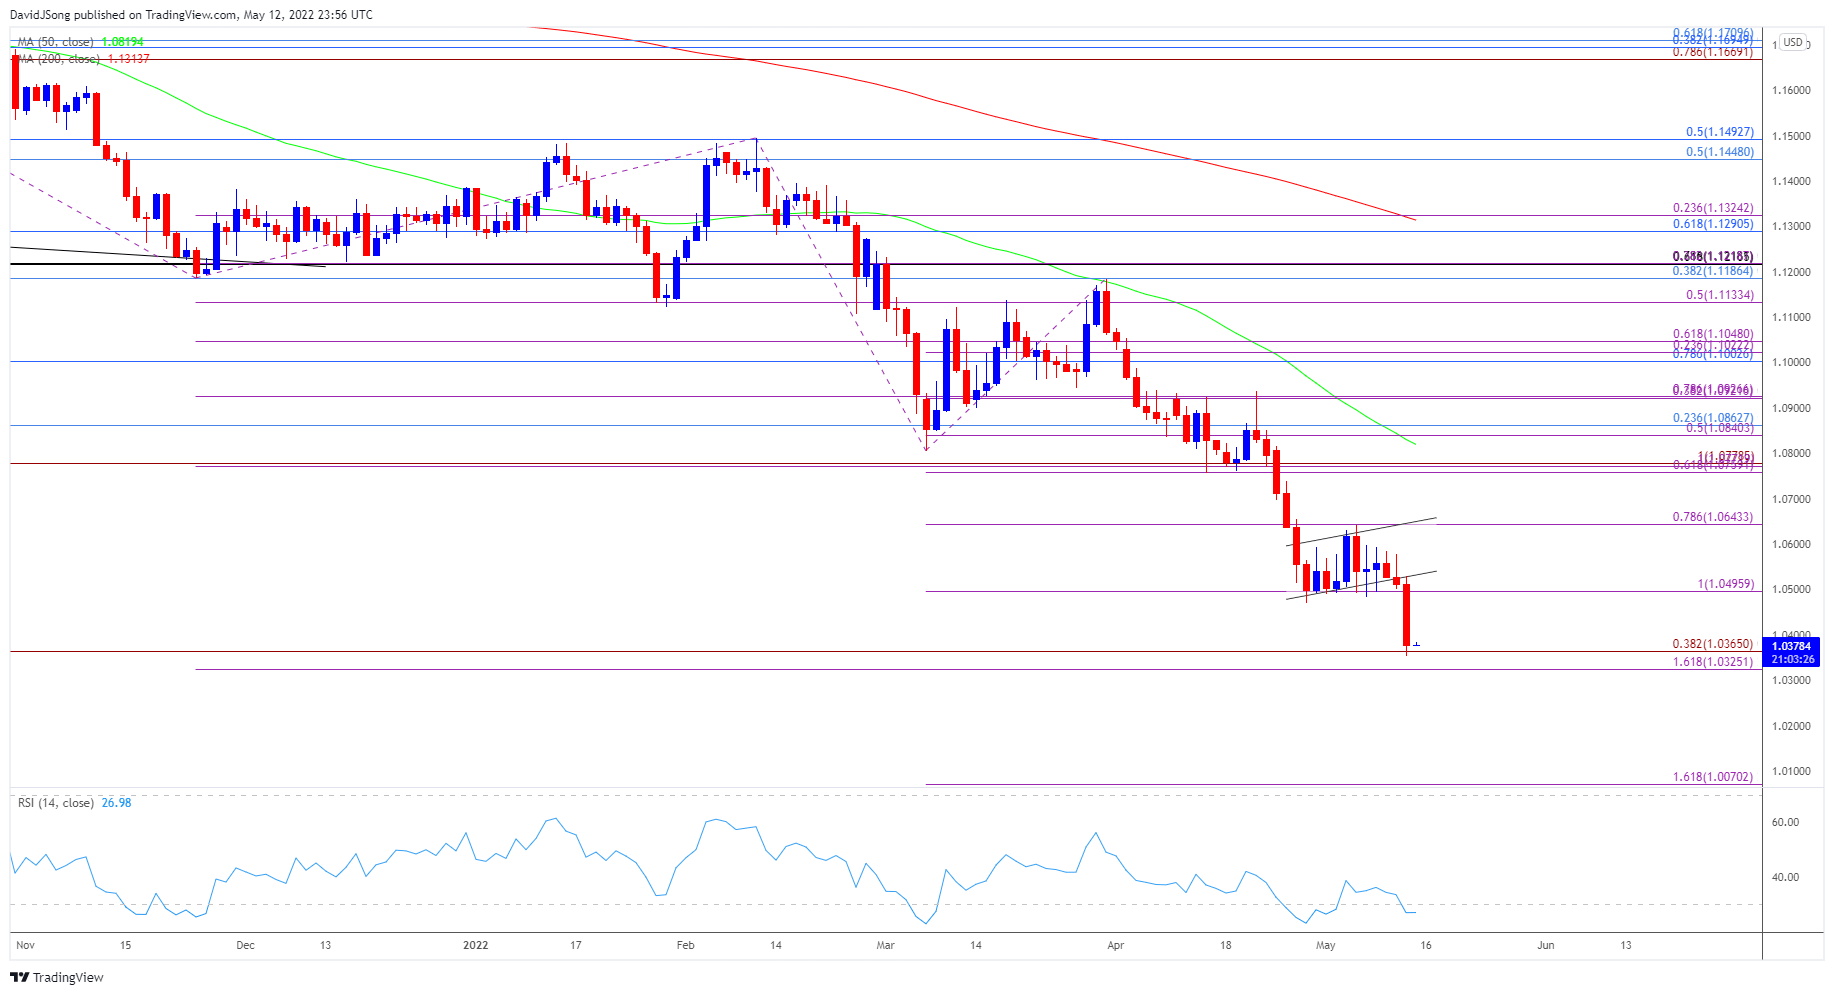
Source: Trading View
- A bear flag formation appears to be unfolding as EUR/USD clears the April low (1.0471), with the exchange rate on the cusp of testing the 2017 low (1.0340) as the Relative Strength Index (RSI) pushes into oversold territory for the second time this month.
- A break/close below the Fibonacci overlap around 1.0330 (161.8% expansion) to 1.0370 (38.2% expansion) opens up the 1.0070 (161.8% expansion) region, with a move below parity bringing the December 2002 low (0.9859) on the radar.
- However, lack of momentum to test the 2003 low (1.0334) may pull the RSI out of oversold territory, and failure to break/close below the overlap around 1.0330 (161.8% expansion) to 1.0370 (38.2% expansion) may push EUR/USD back towards the 1.0500 (100% expansion) handle, with the next area of interest coming in around 1.0630 (78.6% expansion).
— Written by David Song, Currency Strategist
Follow me on Twitter at @DavidJSong
Be the first to comment