

EUR/USD extended its decline and traded close to 1.1665. USD/JPY is rising and it might continue to rise above the 111.70 level.
Important Takeaways for EUR/USD and USD/JPY
· The Euro started a major decline below the 1.1750 and 1.1720 support levels.
· There is a key bearish trend line forming with resistance near 1.1690 on the hourly chart of EUR/USD.
· USD/JPY started a fresh increase and it cleared the 111.00 resistance zone.
· There is a crucial bullish trend line forming with support near 111.40 on the hourly chart.
EUR/USD Technical Analysis
This week, the Euro started another decline below the 1.1750 support against the US Dollar. The EUR/USD pair traded below the 1.1720 support to move into a bearish zone.
The pair even broke the 1.1700 level and settled below the 50 hourly simple moving average. A low is formed near 1.1667 on FXOpen and the pair is now consolidating losses. An immediate resistance is near the 1.1688 level.
The 23.6% Fib retracement level of the recent decline from the 1.1749 swing high to 1.1667 low is also near the 1.1688 level. The first key resistance is near the 1.1690 level and the 50 hourly simple moving average.
There is also a key bearish trend line forming with resistance near 1.1690 on the hourly chart of EUR/USD. The next major resistance could be 1.1710. It is near the 50% Fib retracement level of the recent decline from the 1.1749 swing high to 1.1667 low.
A close above 1.1720 could open the doors for a steady increase towards 1.1750. Any more gains may possibly lead the pair towards the 1.1800 level.
If there is no break above 1.1690, the pair might continue to move down. An immediate support is near the 1.1665. The next major support is near 1.1650, below which the pair could drop towards the 1.1600 support in the near term.
USD/JPY Technical Analysis
The US Dollar started a fresh increase from the 109.10 zone against the Japanese Yen. The USD/JPY pair broke the 110.00 and 110.50 resistance levels to move into a positive zone.
The upward move gained pace above the 111.00 level and the pair settled above the 50 hourly simple moving average. The pair traded as high as 111.68 before it started a downside correction.
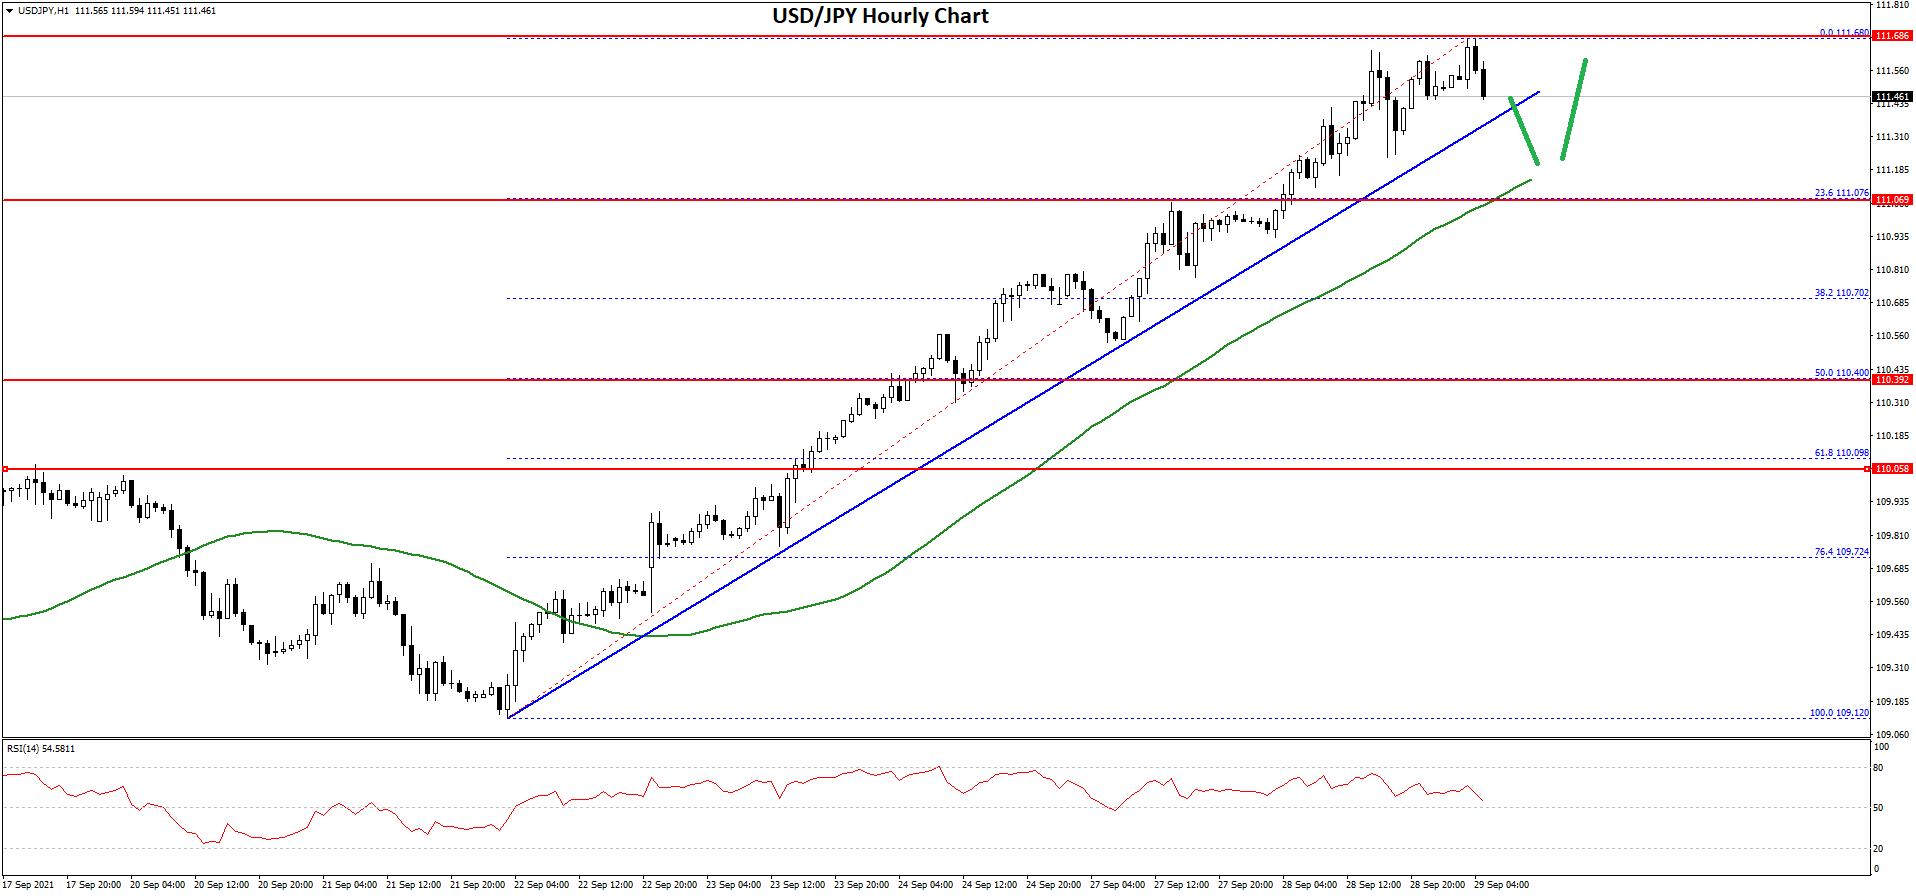
It is now trading near the 111.45 level. An initial support on the downside is near the 111.40 level. There is also a crucial bullish trend line forming with support near 111.40 on the hourly chart. The next major support is now forming near the 111.15 level and the 50 hourly simple moving average.
The 23.6% Fib retracement level of the upward move from the 109.12 swing low to 111.68 high is also near the 111.15 zone. If there is a downside break below the 111.15 support, the pair could decline towards the 110.75.
Any more losses could open the doors for a move towards the 110.40 support zone. It is near the 50% Fib retracement level of the upward move from the 109.12 swing low to 111.68 high.
On the upside, an initial resistance is near the 111.70 level. The next major resistance is near the 112.00 level, above which the pair is likely to rise steadily in the coming sessions.
This forecast represents FXOpen Markets Limited opinion only, it should not be construed as an offer, invitation or recommendation in respect to FXOpen Markets Limited products and services or as financial advice.

Be the first to comment