

EUR/GBP Price, Chart, and Analysis
- UK inflation and employment figures will be closely watched.
- Big shift in weekly EUR/GBP retail positioning.
Keep up to date with all market-moving data releases and events by using the DailyFX Calendar
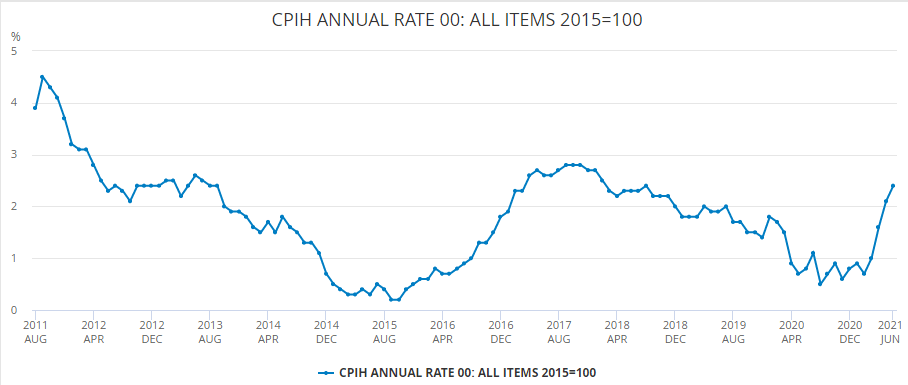
The latest Look at UK price pressures on Wednesday is expected to show inflation easing back from the levels seen in June but still above the BoE’s target of 2%. The consumer prices index including owner occupiers’ housing costs (CPIH) rose by 2.4% in June, hitting its highest level since August 2018 as price pressures continue to increase as the UK economy expands further.
Chart via the ONS.
One day before the inflation report is released, the Office for National Statistics will release the latest employment/unemployment data – although these are backward looking – while at the end of the week the latest look at the health of the high street and consumer spending, will be seen in the July retail sales report. All of these releases will have the ability to move Sterling if they differ markedly from market expectations.
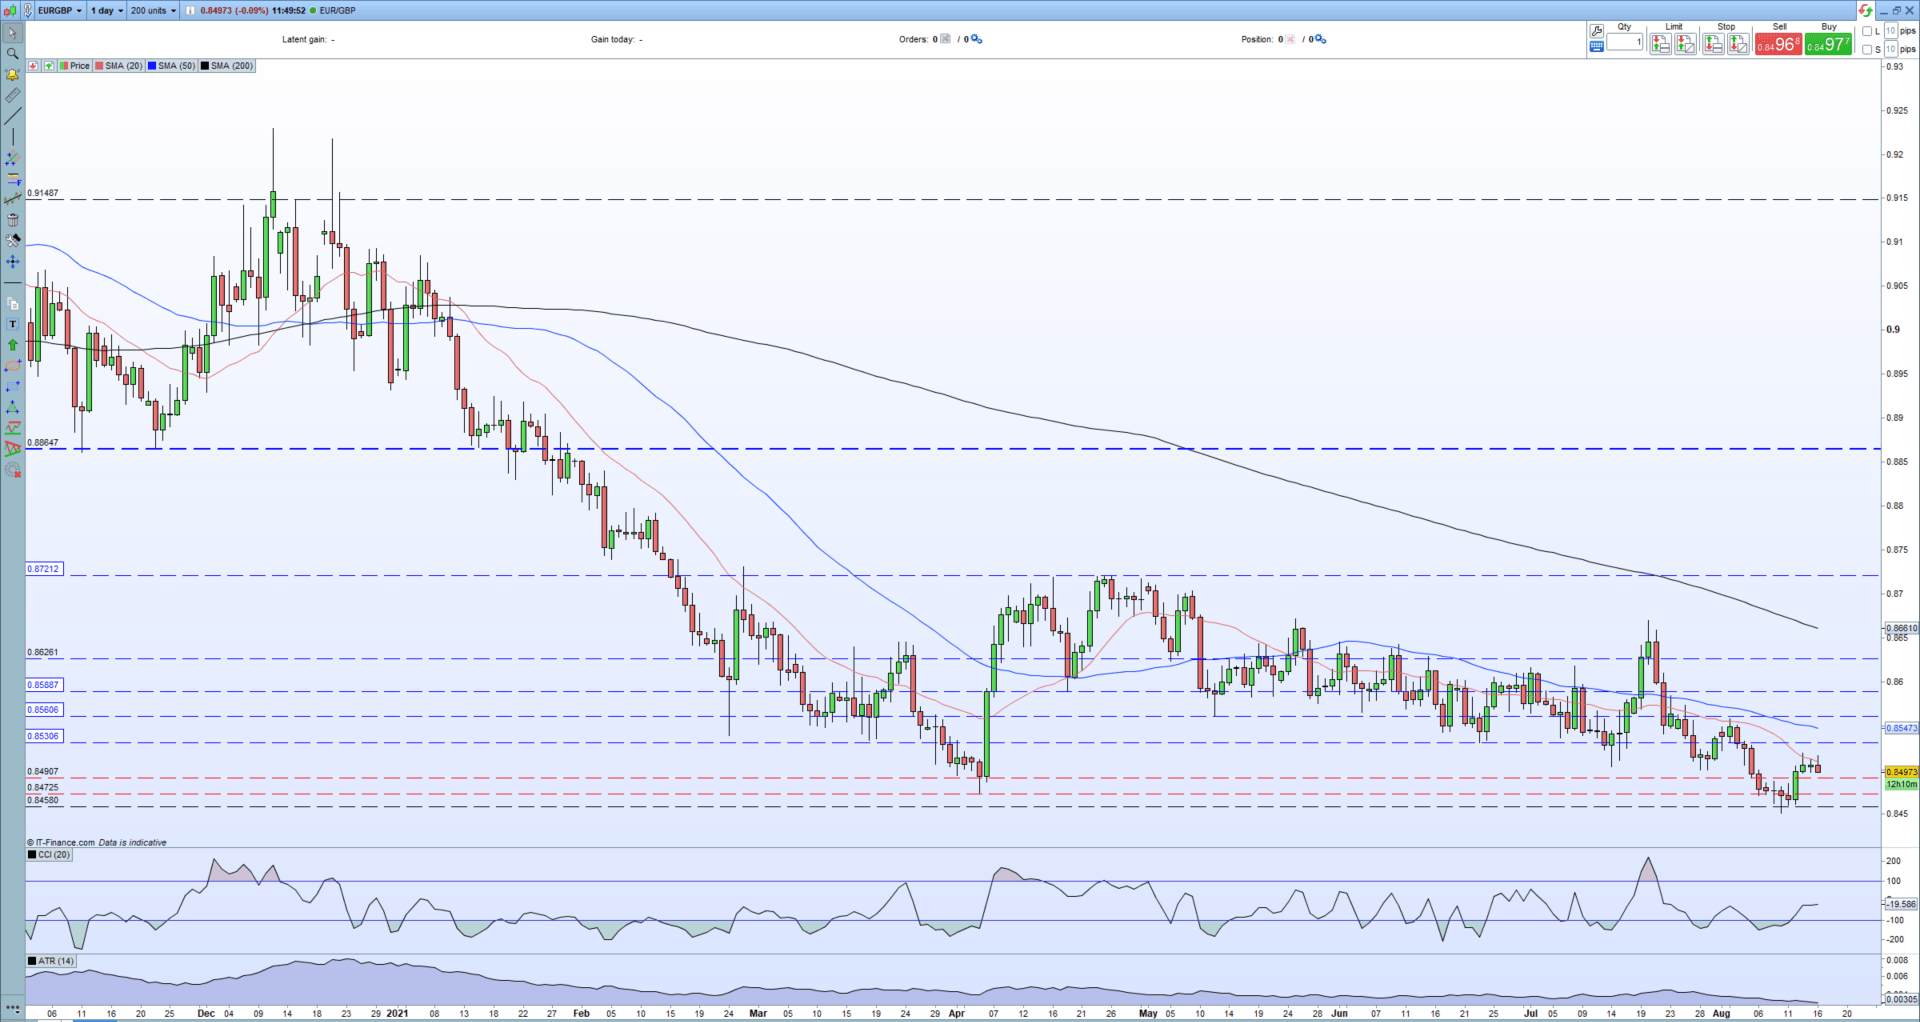
EUR/GBP remains pointing lower but has been unable to make a strong, confirmed break below 0.8500 despite the chart set-up looking increasingly negative for the pair. All three simple moving averages highlight the weakness of the pair, while the 20-day sma is now starting to act as the first line of resistance for the first time in nearly a month. The CCI indicator also shows the pair are in neutral territory. Retail data (see report below) show that customers have pared back net-long positions and increased net-short positions sharply over the last week, although they remain heavily long EUR/GBP. A break below the August low at 0.8450 may well see the pair slide further lower with the December 2019/February 2020 double-low at 0.8277 the next target for bearish traders.
EUR/GBP Daily Price Chart (November 2020 – August 16, 2021)
Retail trader data 69.61% of traders are net-long with the ratio of traders long to short at 2.29 to 1.The number of traders net-long is 2.78% higher than yesterday and 21.69% lower from last week, while the number of traders net-short is 7.31% higher than yesterday and 49.54% higher from last week.
We typically take a contrarian view to crowd sentiment, and the fact traders are net-long suggests EUR/GBP prices may continue to fall.Yet traders are less net-long than yesterday and compared with last week. Recent changes in sentiment warn that the current EUR/GBP price trend may soon reverse higher despite the fact traders remain net-long.
What is your view on EUR/GBP – bullish or bearish?? You can let us know via the form at the end of this piece or you can contact the author via Twitter @nickcawley1.
Be the first to comment