

ETHUSD: Bullish Engulfing Pattern Above $4,400
Ethereum had a major bearish correction last week when it declined towards the $4,000 handle after touching a high of $4,551.
ETHUSD started this week in a consolidation phase after which it had a bullish reversal towards $4,700 and touched an intraday high of $4,776 in today’s Asian trading session.
We can clearly see a bullish engulfing pattern above $4,400 which signifies a trend reversal, and ETHUSD crossing $4,700.
Ethereum price has retracted from its highs due to some profit-taking, but the bullish channel continues, and this week, we are aiming for the upsides of $4,700 and $4,900.
ETH is now trading above its pivot level of $4,524 and moving in a mild bullish momentum. The price of ETHUSD has already broken its classic resistance level of $4,545, its Fibonacci resistance level of $4,555, and is now aiming towards the $4,600 handle in the US trading session.
Moving averages are giving a NEUTRAL signal.
ETH is now trading above both its 100 hourly and 200 hourly simple moving averages.
- Ethereum is in a mild bullish channel
- Short-term trend reversal seen above $4,400
- All the major technical Indicators are giving NEUTRAL to SELL signals
- Average true range is indicating LESS market volatility
Ether: Bullish Channel Towards $4,900 Confirmed
ETHUSD is consolidating its gains above $4,500 in the European trading session and we can clearly see that the bullish channel is back.
We are now aiming for the upsides of $4,600 to $4,700 in today’s US trading session. The retracement from $4,000 was very strong, which suggests that there is more room for upsides in Ethereum this month, and $5,500 is the next target.
At present, technical indicators are giving a SELL signal which means that in the immediate short-term we will see a decline before the continuation of a bullish channel.
ETH has declined by -4.26% with a price change of -202.85$ in the past 24hrs and has a trading volume of 26.670 billion USD.
We can see a decrease of 11% in the trading volume as compared to yesterday, which means that new buyers are not entering the markets and waiting for further correction in the levels of Ethereum.
Ethereum Gains in 2021
We have seen the prices of Ethereum increasing continuously throughout 2021. Starting from $730 on 1st Jan 2021, Ether is currently trading at $4,568, yielding a gain of 625% to its investors — more than Bitcoin during the same period of time.
Ethereum’s performance in 2021 is commendable. The current market valuation of this second-largest cryptocurrency stands at 540.52 billon USD.
A number of leading crypto analysts have also predicted that in the next 5 years, Ethereum could outperform bitcoin and become the topmost cryptocurrency in the world.
The Week Ahead
Ether is printing above $4,500 today, and this week, we could $4,700 to $4,900.
The medium to long-term outlook for Ether in December remains bullish with targets of above $5,000.
Ether has already broken its major resistance level of $4,580 and is now facing the next resistance level of $4,800.
Technical Indicators:
Commodity channel index (14-day): indicating a NEUTRAL market
Moving averages convergence divergence (14-day): at -27.11 indicating a SELL
Average directional change (14-day): indicating a NEUTRAL market
Rate of price change: at -2.386 indicating a SELL
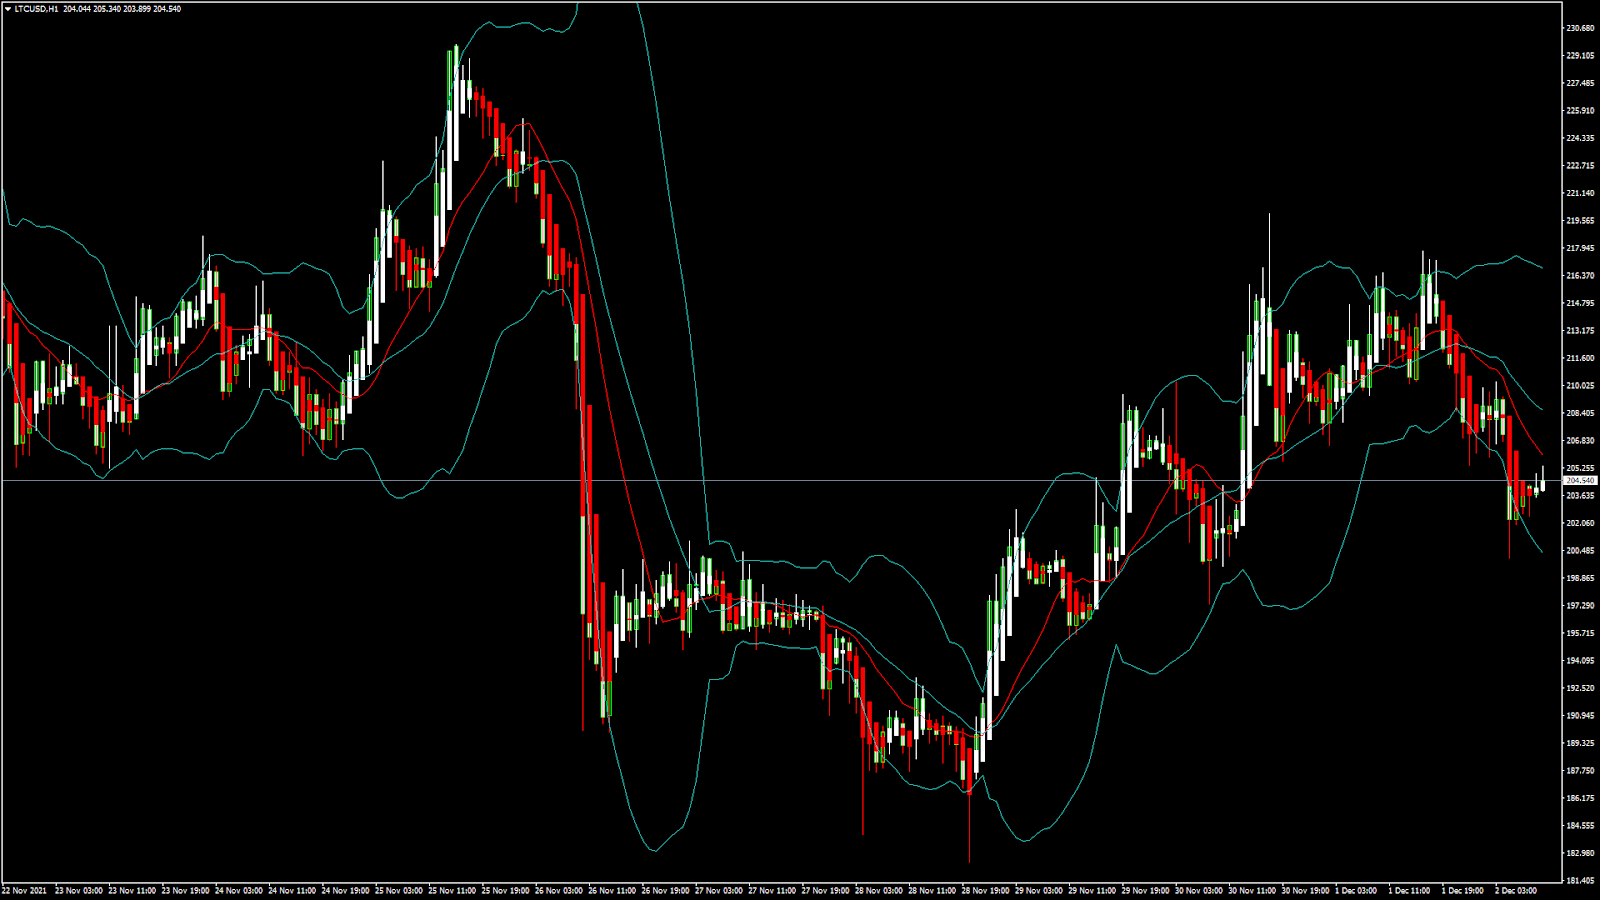
LTCUSD: Bullish Engulfing Pattern Above $200
Litecoin had a major bearish correction last week and touched a low of $185, after which we can see a mild bullish momentum towards the $220 handle.
We can see a bullish engulfing pattern today above the $200 which signifies a bullish trend reversal, and in today’s US trading session, we are aiming for the upside of $210.
This is in continuation of the bullish channel that we saw last week, and now we are looking for immediate targets of $220 to $225.
We can see an increase in the bullish momentum seen last week which is a positive signal for fresh buyers.
Litecoin is now trading just above its 100 hourly simple moving average and just below its 200 hourly exponential moving average. The price of LTCUSD has already broken its pivot levels of 204.06
The immediate short-term outlook for Litecoin has turned bearish.
- Medium to long-term outlook for Litecoin remains bullish
- All the MOVING AVERAGES are giving a SELL signal
- Confirmed uptrend is seen in the medium-term range above $200
- Average true range is indicating LESS market volatility
Litecoin: Bullish Momentum Above $200 Confirmed
The price of Litecoin has come out of the consolidation phase today and is moving in a mild bullish channel above the $200 handle in the European trading session.
The short-term bearish phase for Litecoin may continue pushing its prices even below the $200 handle.
The price of LTCUSD is now facing its classic resistance level of 205.93 and Fibonacci resistance level of 205.36, after which the path towards $210 will get cleared.
We have seen a 5-day SMA crossover which also signifies the shift in the trend towards a bullish channel.
Litecoin’s trading volume has decreased by 23.48% as compared to yesterday which means that fresh buyers are still waiting for a trend confirmation.
In the last 24hrs, LTCUSD has declined by -4.42% with a price change of 9.50$ and has a 24hr trading volume of 1.636 billion USD.
The Week Ahead
Litecoin is witnessing decreased trading volumes today. As compared to yesterday, we can see the price of LTCUSD entering into a consolidation phase above the $200 handle.
At the present market level, we can see a mild bearish channel which can push the price below $200.
We will need to wait and see if LTCUSD prices continue to remain above the $200 mark; then, fresh buying could be expected.
It is also possible for the price to continue moving in a narrow range between $210 and $200.
Technical Indicators:
Ultimate oscillator: at 46.34 with a SELL
Stoch (9, 6): at 33.64 with a SELL
Moving averages convergence divergence (12, 26): at -1.702 indicating a SELL
Average directional index (14-day): at 34.915 indicating a SELL
Be the first to comment