

Editor’s note: Seeking Alpha is proud to welcome DesertShield Capital as a new contributor. It’s easy to become a Seeking Alpha contributor and earn money for your best investment ideas. Active contributors also get free access to SA Premium. Click here to find out more »
Trygve Finkelsen/iStock Editorial via Getty Images
Highlight
I assign a Buy rating for ESAB Corporation (NYSE:NYSE:ESAB) with a price target of $58 in FY24, representing 35% potential upside from the current share price ($43.16, as of 12 September 2022). ESAB has, I believe, a broad set of exposures to various end-markets that are likely to enjoy tailwinds in the near to mid terms. The management team here is exceptionally experienced and well-versed in what they are doing, as evident by their track record of expanding margins through cost rationalization, M&A, and innovations. Assuming ESAB executes and meets management guidance, it should generate $491 million in adjusted EBITDA in FY25e, and attaching 10x NTM EV/EBITDA in FY24e would lead to my price target of $58.
Business overview
ESAB is a recent spin-off. It was a Colfax Corporation subsidiary prior to its separation from Colfax Corporation in April 2022 and subsequent public offering.
ESAB develops, manufactures, and distributes consumable materials and equipment for cutting, joining, and automated welding, as well as gas control systems. It also provides software and technological solutions that boost productivity, allow remote welding operation monitoring, and digitize paper records. The company offers its items directly to customers as well as through distributors for a number of applications, including general industrial, oil and gas, construction, automotive, etc. In FY21, around three-fourths of ESAB’s revenues came from outside the United States, with welding consumables accounting for ~70% of those sales.
Product portfolio
ESAB markets its products under its own brand along with 3P brands. Collectively, it provides a wide variety of welding and cutting equipment, including arc welding tools, plasma cutters, filler metals, gas equipment, arc gouging machines, exothermic cutting systems, robotic welding equipment, and digital solutions. In FY21, 69% of ESAB’s income came from consumables, and the rest came from equipment.
ESAB March’22 Investor Presentation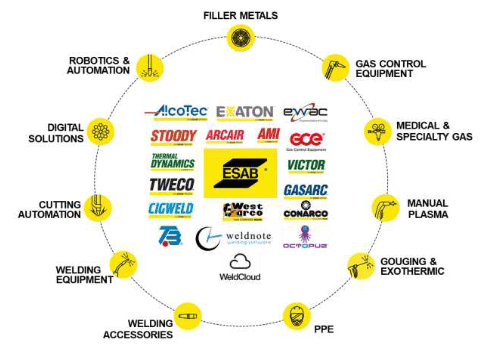
Industry overview
The worldwide fabrication industry is about $25 billion, with growth rates ranging from 2% to 3% annually across a wide range of end-sectors. General fabrication is the largest, which accounts for ~30% of ESAB’s TAM, followed by the Oil & Gas (O&G), Infrastructure, and Automotive industries.
ESAB March’22 Investor Presentation
The fabrication industry is diverse and highly competitive on a global scale, with many different companies operating within it. The management believes that ESAB is the clear leader in every industry it is in, except for China and North America, where it ranks below Illinois Tool Works (ITW) and Lincoln Electric Holdings (LECO).
The basis of competition in this industry ranges across several factors such as quality, reliability, cost, application knowledge, technical experience, speed of delivery, and aftersales support. Brands that are able to consistently deliver as promised often receive high customer loyalty.
ESAB market position
In FY21, ESAB had sales of $2.4 billion and an operating profit of 13.4%. Unlike LECO and ITW (its two largest competitors), ESAB’s sales and presence are spread more thinly over the globe, with the exception of North America (where it is weaker than both of its competitors) and China (where it is smaller in scale than local operators).
- LECO has $3.2 billion in sales and an operating margin of 14.1% in FY21
- ITW’s welding business has $1.7 billion in revenue, and an operating margin of 29.7% in FY21
Looking across the globe, ESAB has been around for a long time in a number of developing countries, such as South America (where it started in 1955 and is now four times the size of its closest competitor), India (where it started in 1955 and is now four times the size of its closest competitor), Westarco, and Soldexa.
ESAB March’22 Investor Presentation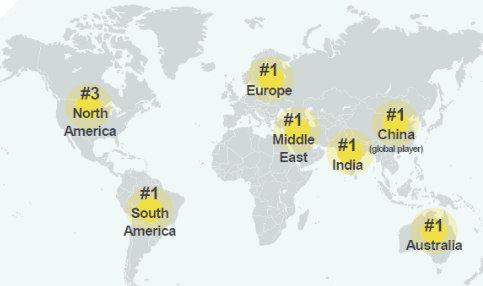
Tailwinds from several end-markets support growth in the near to mid terms
ESAB should benefit greatly from the significant drilling activity going forward, which is expected to increase in the near term (CY22 and 23), especially given that it is increasingly unlikely that the Russia/Ukraine war would be resolved anytime soon. What this means is that, as completions activity steadily increases, the O&G end markets will provide a tailwind for welding equipment demand (16% of ESAB’s TAM).
The current O&G demand and supply environment is very positive for fabrication demand as it has pushed up the cost of materials, resulting in higher profit margins for suppliers, thereby boosting the demand for O&G fabrications. We can see this happening almost in real time, using data from Baker Hughes. Global rig counts have risen sharply from their mid-2020 low since Russia’s invasion of Ukraine and have continued to rise as oil and gas prices have risen.
Aside from the developments in the O&G industry, ESAB will also benefit from the inventory build-up of autos, which will accelerate as the supply chain situation recovers. The implication here is that auto production will increase throughout the world as supply constraints are eased. While I am confident that the supply issue will eventually ease, there are several near- to mid-term issues that ESAB needs to tide through before it can enjoy the recovery – for instance, Russia’s invasion of Ukraine and China’s lockdowns related to its “zero-COVID” policy.
To quantify the recovery, I looked at the current projections from IHS Market that indicate that global vehicle output will increase by 8% in CY23 from CY22, with increases of 10% in North America, 1% in Europe, and 4% in China. As automobiles are a relatively significant part of ESAB’s TAM (12%), the industry outlook is favorable.
IHS Markit
Renewable energy could be the next leg of growth
Renewable energy now accounts for just 5% (or $1.25 billion) of ESAB’s TAM. As renewable energy spending grows over the next decades, it will expand ESAB’s TAM while at the same time representing a bigger share of the pie. There are several reasons to believe that this spending will climb rapidly over the next ten years, far outpacing more established end industries with growth rates closer to the global GDP. One of the key reasons is that renewables are the backbone of any energy transition to achieve net zero.
One of the many data points that I track to understand the growth of renewables is solar capacity. According to the IEA, since 2010, solar capacity has grown at a CAGR of 33% from 32TWh to 821TWh as of 2020 and is expected to reach 6,970Twh in the 2030 Net Zero Scenario. Even though it’s almost impossible to translate this into a real TAM number, it’s not crazy to think that the sheer amount of additional capacity represents a huge dollar TAM.
IEA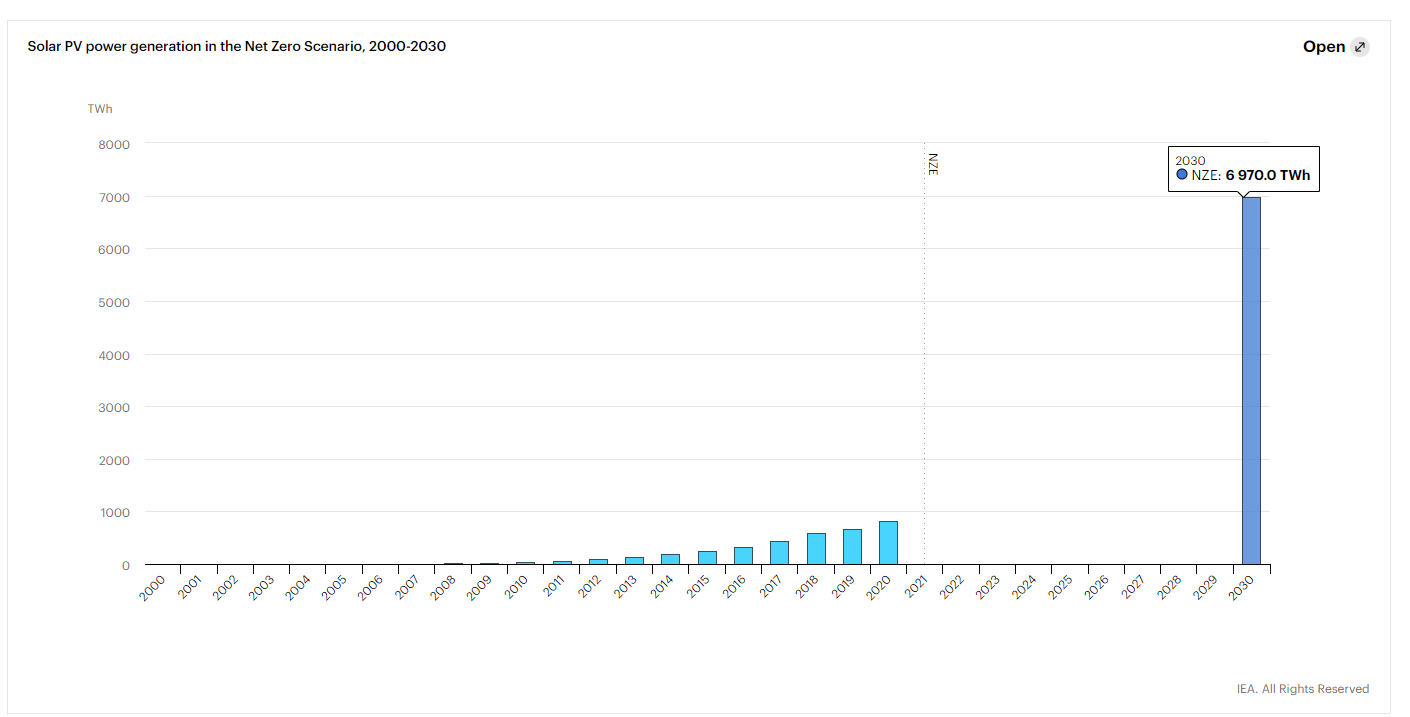
EBITDA margin to expand via cost rationalization and M&A
Cost rationalization
ESAB’s adjusted EBITDA margin has increased by 300 basis points since 2018, thanks to cost-cutting initiatives, the introduction of new products, M&As, and end-market expansion. To drive margin expansion, ESAB targets to further reduce the current 28 facilities in 6 different geographies (reduced from 45 facilities since 2016), which is perfect as greater footprint rationalizations are expected in the coming periods, leading to more annual savings.
In order to get a numerical sense of how impactful the upcoming cost savings could be, I looked at ESAB’s historical cost savings from footprint savings since 2018. Since then, ESAB has delivered ~$20 million in footprint savings, which implies closing ~4 facilities per year, generating $1.8 million in savings per facility. If the company continues to rationalize its footprint at the same rate over the next three years, it will be on track to reduce operating costs by an additional $20 million. ESAB is also moving forward with plans to merge and reorganize its plants, which should lead to big cost savings in the first half of 2023.
M&A
Management has been shown to be exceptional acquirers based on its track record of purchasing businesses with EBITDA margins that were, on average, 450bps higher than ESAB. Over the next two years, management plans to lower net leverage to between 2x and 3x, and I expect net savings from deleveraging exercises to be re-channeled into M&A activities (which is in line with management’s forward expectations). Management plans to keep acquiring businesses that are growing their top line in the mid-single digits and are gross margin accretive.
ESAB March’22 Investor Presentation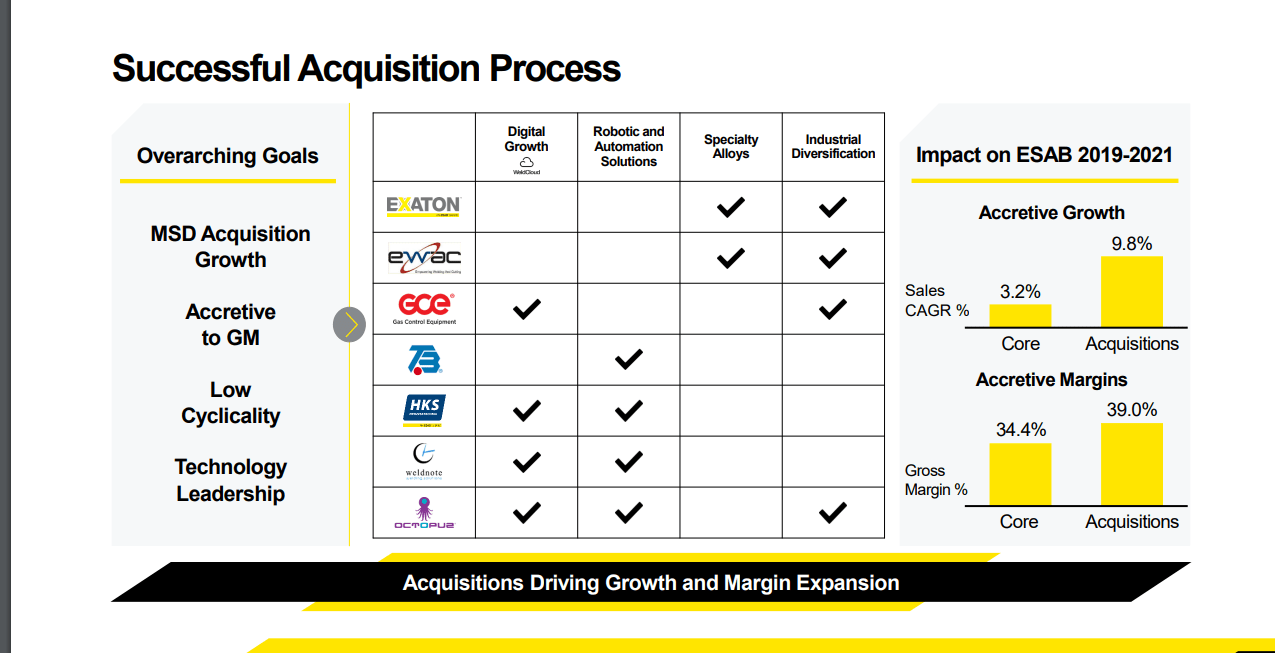
Lastly, because ESAB has always had a lower operating margin than its competitors, investors stand to gain more from the company’s strategic initiatives to raise margins (i.e., earnings growing faster than the top line).
Opportunities to further expand TAM in high-growth end markets
Aside from the current markets in which ESAB has a significant presence, it has gradually built a market presence in other new high-growth end markets over the years. Management believes that these markets could generate $300 million in revenue with an attractive gross margin of at least 50% and that these end markets will generate an additional $5 billion in TAM.
Examples of such markets are:
- Medical & Specialty gas control ($3bn TAM): ESAB acquired GCE in 2018.
- Digital solutions ($1bn TAM): ESAB acquired OCTOPUZ in 2021.
- Robots (TAM: $1 billion): ESAB acquired TBi in 2017.
ESAB March’22 Investor Presentation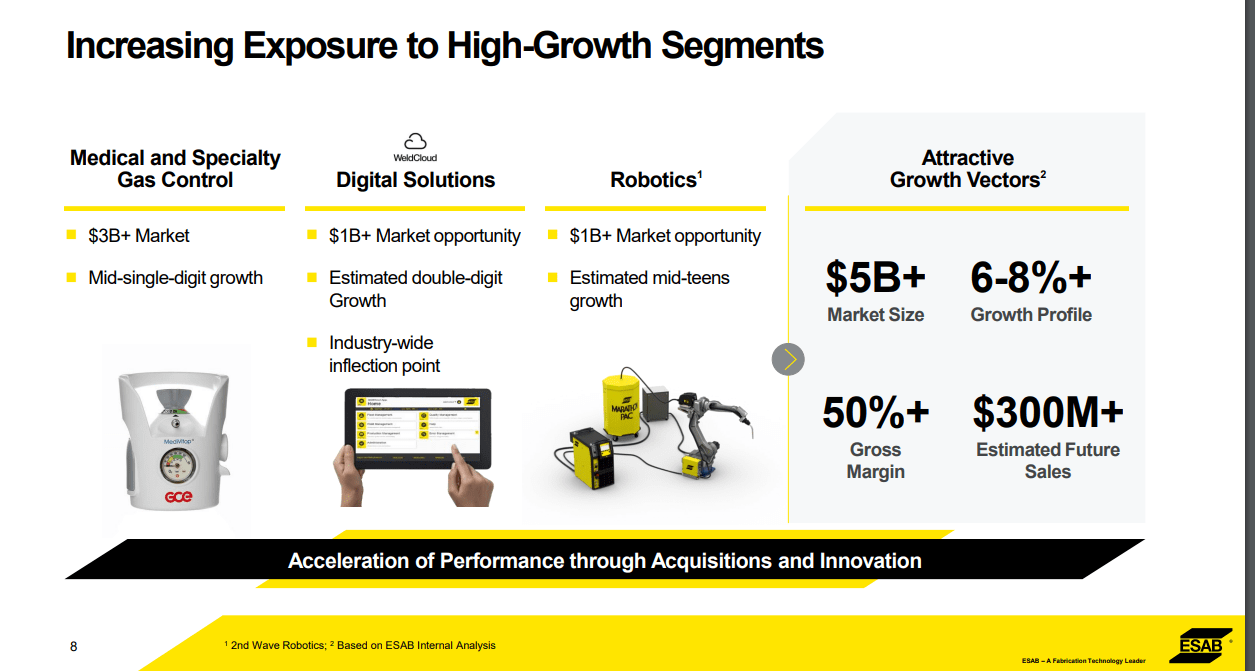
Innovation leads to an expansion in TAM
Since FY16, ESAB’s number of new product releases has skyrocketed, from 24 to 100 in FY21 and 110 in FY22 (with 25% of the objective met in 1Q22). Recent advances in robotics, digitalization, and automation have often been driven by customer-backed, team-based innovation initiatives. As the company adds more robotics and digital solutions, management expects to sell more than $100 million worth of equipment and filler metal each year.
Management guidance
During its Investor Day in March, ESAB laid out a number of long-term financial goals, such as making sales of $3.0–$3.5 billion, keeping an adjusted EBITDA margin of 20% or higher, and turning more than 100% of net income into FCF.
ESAB March’22 Investor Presentation
ESAB anticipates achieving its objectives within three to five years via a combination of cost-reduction measures, higher cash production, and organic and inorganic development efforts. It also aims to make at least $300 million in sales in high-growth markets – such as robotics, digital solutions, medical and specialty gas control, and specialty gas control – with gross margins of 50% or more.
Based on the tone of management, the low end of the revenue goal should be possible to reach organically, which would mean an organic CAGR in the mid-single digits over the next four years. M&A could also accelerate revenue growth.
ESAB – Financial model and valuation
In my base case, I expect ESAB’s top line to grow in the mid-single digits over the next few years while I expect margins to remain relatively stable. Any increase in top-line growth or margin expansion brought about by new innovation or M&A will be a bonus.
On a relative valuation basis, welding companies as well as suppliers of metal cutting/metalworking equipment and industrial tools are the best peers to compare with. ESAB’s peer companies are trading in the mid to high teens in NTM earnings and in the low teens in NTM EBITDA. Given that ESAB does a lot of M&As and has a high level of debt, the best way to evaluate it is with EV/EBITDA. See below for my valuation modeling table.
Own model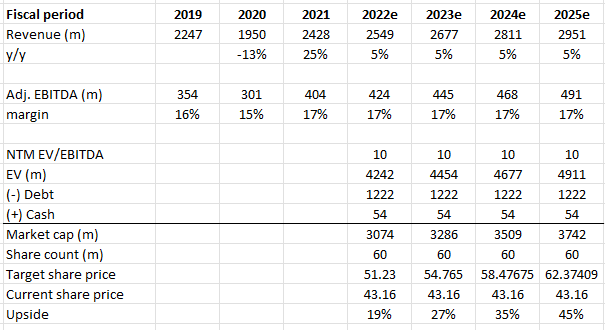
Risks
- It is important to consider the 30% of ESAB’s sales that originate in Europe, which is very likely going through a recession in the near-term. As the economy as a whole becomes less stable, it’s possible that one or more of ESAB’s end markets will shrink faster than expected.
- While I did not specifically model growth from M&A, it is one of ESAB’s key strategies, and as with all M&A, it invites challenges for integration and implementation. Mis-execution here would be a drain of resources and damage management creditability.
Conclusion
ESAB is a well-diversified company in the global fabrication sector that is over-indexed to profitable end industries. It has room for growth in medical and specialty gas control, digital solutions, and robotics. Additionally, ESAB could reduce the margin and value gap between itself and its competitors via organic expansion, projects that increase profitability, accretive mergers and acquisitions, and progressive debt reduction. At its current price, I think ESAB has a good upside with a growth catalyst in the short to medium terms.
Be the first to comment