

It’s not reasonable to try to analyze in detail every security in a large category, so by one means or another, it is practical to filter a long list into a shorter list of potentially interesting candidates.
This note is targeted to the DIY investor who prefers not to take recommendations from others without also doing their own research, or who simply prefers to do their own research – period. For those who merely want a buy recommendation without having to do any of their own work, this note won’t be satisfactory.
Filter Approaches
We did the filter using data sources which are either free or available by moderate cost subscription, so that this approach is completely available to most DIY investors. Otherwise, it’s frustrating if someone uses a prohibitively expensive data service like a Bloomberg terminal that most DIY investors cannot reasonably access. We wanted to make sure that there was nothing about this which was out of the reach of most DIY investors.
The only data in this note that you probably can’t find free here or there is the ability to create and then conveniently select the charts below online, and those can be had for an annual fee less than $500 – that is good for as many filter exercises as you need throughout the year.
As a DIY investor, you might do your initial universe reducing filter based on:
- Valuation data (price multiples)
- Fundamental data (such as leverage, profitability, and growth)
- Yield data (such as current yield, yield relative to the sector or to its own history)
- Sector, industry, and sub-industry classifications (subsequently specific business descriptions)
- “Technical” data (traditionally useful chart patterns and indicators)
- Visual pattern recognition (scanning charts by eye to capture granular detail)
Filter Approach We Used
The filtered list of REITs in this note was developed by the last filtering method, overall visual pattern recognition of both historical dividend adjusted chart patterns and distribution patterns. That is one way to come up with a list that might contain interesting opportunities. In our filter, we reduced nearly 180 equity REITs down to 18. There was no target number. The 18 are simply those that looked good by visual chart inspection.
We looked at 20-year monthly dividend adjusted performance charts that also contained the distributions for that period. We wanted a generally up trending pattern in both total return and dividends, eliminating those with large drawdowns and those with historical distribution cuts or generally flat distributions. We did not eliminate charts that basically fell off a cliff in the past few months because that is a systematic problem, and in fact the largest drawdowns could present significant gain opportunity.
The charts came from a subscription service at stockcharts.com
That set of criteria doesn’t sound like much, but it was sufficient to eliminate 90% of REITs.
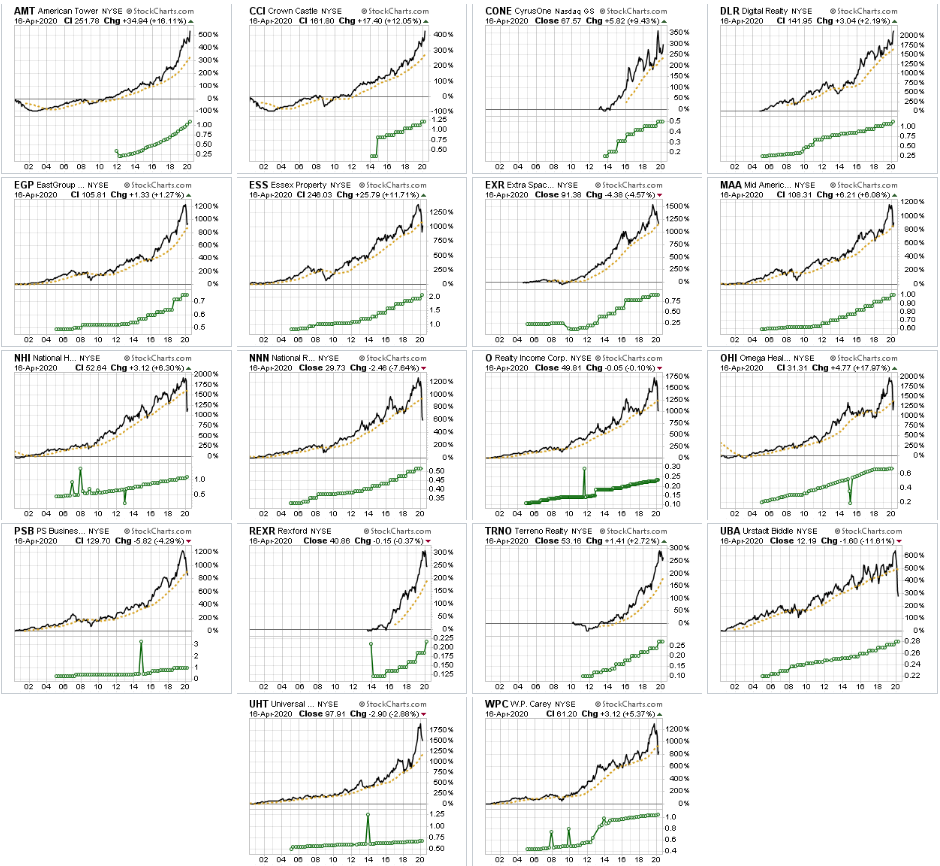
20-Year Monthly Charts
Here are the 20-year charts of the visual filter survivors. The upper panel in black contains the dividend adjusted price performance rather than dollar amount performance so that the performance is normalized across all REITs. The gold line in the upper panel is the three-year moving average. The lower panel in green presents the periodic distributions made by the REITs.
Three-Year Monthly Charts
The images below show the three-year normalized performance in black, with a 10-month moving average in gold; and the distributions in the lower panel in green.
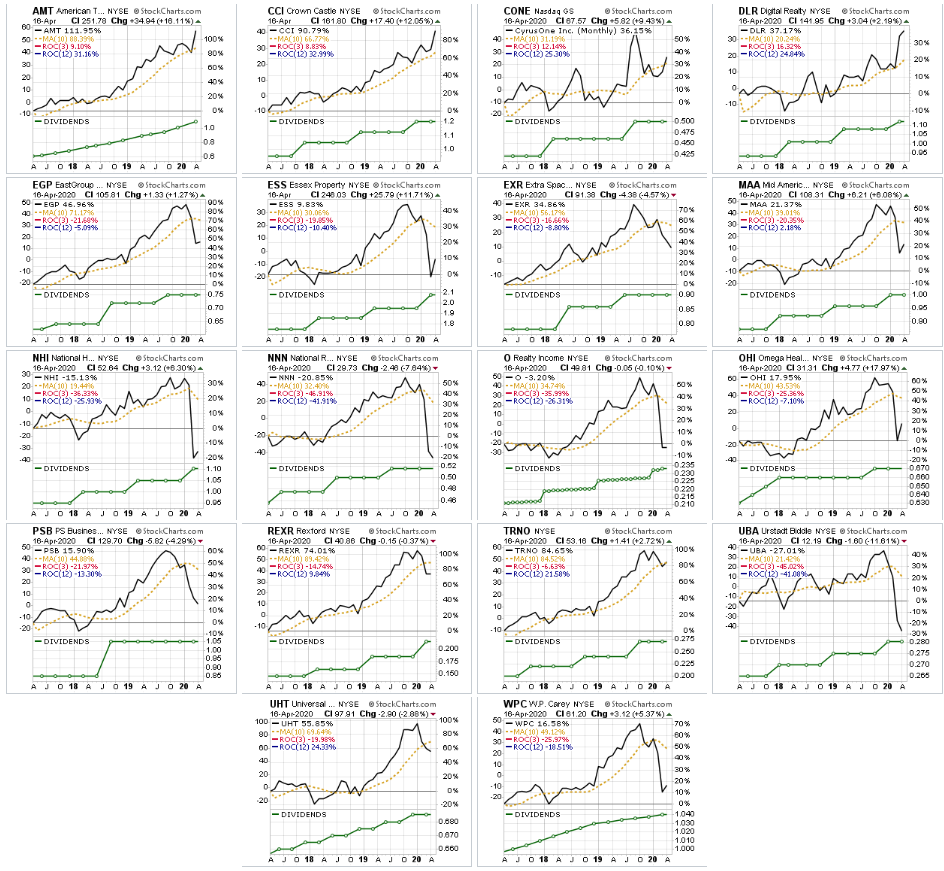
Remember, we are not saying any of these REITs are right for you, just that they have the most attractive charts from a visual inspection perspective; and may, therefore, justify further research.
Who They Are And What They Do
Once we had a set of visually satisfactory charts, the next question was “who are they and what do they do?”.
This table identifies the equity REITs sector for each as classified by NAREIT (National Association of Real Estate Investment Trusts), as well as the somewhat different sector classification used by CenterSquare. It is a real estate firm that manages the public REIT allocation within our investment in Griffin Capital Institutional Real Estate Fund (GRIFX), an interval fund in which we hold significant real estate positions; and its private real estate equity side manages a Value-Added limited partnership in which we are also invested. We are impressed by the thoughtfulness of CenterSquare public real estate research and believe it is useful to consider both the NAREIT and alternate CenterSquare classifications. The sector classifications for REITs are a free resource at the NAREIT website.

Business Descriptions
One of our mantras is always know What You Own and Why You Own It. We are regularly amazed at the number of investors who own stocks or funds and have no idea what they do, and the only reason they own it is because either the price went up or someone told them to buy it. For you as a DIY investor that approach doesn’t fly.
For a beginning sense of what each REIT does, here are the business descriptions available at Yahoo Finance under the profile page (example link for AMT).
Essex Property Trust, Inc., an S&P 500 company, is a fully integrated real estate investment trust (REIT) that acquires, develops, redevelops, and manages multifamily residential properties in selected West Coast markets. Essex currently has ownership interests in 250 apartment communities comprising approximately 60,000 apartment homes with an additional 7 properties in various stages of active development.
Mid-America Apartment Communities, an S&P 500 company, is a real estate investment trust, or REIT, focused on delivering full-cycle and superior investment performance for shareholders through the ownership, management, acquisition, development and redevelopment of quality apartment communities in the Southeast, Southwest, and Mid-Atlantic regions of the United States. As of December 31, 2019, MAA had ownership interest in 102,104 apartment units, including communities currently in development, across 16 states and the District of Columbia.
Digital Realty supports the data center, colocation and interconnection strategies of customers across the Americas, EMEA and APAC, ranging from cloud and information technology services, communications and social networking to financial services, manufacturing, energy, healthcare and consumer products
CyrusOne is a real estate investment trust (REIT) specializing in highly reliable enterprise-class, carrier-neutral data center properties. The Company provides mission-critical data center facilities that protect and ensure the continued operation of IT infrastructure for approximately 1,000 customers, including more than 200 Fortune 1000 companies. With a track record of meeting and surpassing the aggressive speed-to-market demands of hyperscale cloud providers, as well as the expanding IT infrastructure requirements of the enterprise, CyrusOne provides the flexibility, reliability, security, and connectivity that foster business growth. CyrusOne offers a tailored, customer service-focused platform and is committed to full transparency in communication, management, and service delivery throughout its nearly 50 data centers worldwide.
W.P. Carey ranks among the largest net lease REITs with an enterprise value of approximately $20 billion and a diversified portfolio of operationally-critical commercial real estate that includes 1,214 net lease properties covering approximately 140 million square feet. For over four decades, the company has invested in high-quality, single-tenant industrial, warehouse, office, retail and self-storage properties subject to long-term net leases with built-in rent escalators. Its portfolio is located primarily in the U.S. and Northern and Western Europe and is well-diversified by tenant, property type, geographic location and tenant industry.
National Retail Properties invests primarily in high-quality retail properties subject generally to long-term, net leases. As of December 31, 2019, the company owned 3,118 properties in 48 states with a gross leasable area of approximately 32.5 million square feet and with a weighted average remaining lease term of 11.2 years.
Realty Income, The Monthly Dividend Company, is an S&P 500 company dedicated to providing stockholders with dependable monthly income. The company is structured as a REIT, and its monthly dividends are supported by the cash flow from over 6,400 real estate properties owned under long-term lease agreements with commercial tenants. To date, the company has declared 596 consecutive common stock monthly dividends throughout its 51-year operating history and increased the dividend 105 times since Realty Income’s public listing in 1994. The company is a member of the S&P 500 Dividend Aristocrats index.
Omega is a real estate investment trust that invests in the long-term healthcare industry, primarily in skilled nursing and assisted living facilities. Its portfolio of assets is operated by a diverse group of healthcare companies, predominantly in a triple-net lease structure. The assets span all regions within the US, as well as in the UK.
Incorporated in 1991, National Health Investors, Inc. is a real estate investment trust specializing in sale-leaseback, joint-venture, mortgage and mezzanine financing of need-driven and discretionary senior housing and medical investments. NHI’s portfolio consists of independent, assisted and memory care communities, entrance-fee retirement communities, skilled nursing facilities, medical office buildings and specialty hospitals.
Universal Health Realty Income Trust, a real estate investment trust, invests in healthcare and human service related facilities including acute care hospitals, behavioral health care hospitals, specialty hospitals, medical/office buildings, free-standing emergency departments and childcare centers. We have investments in 71 properties located in 20 states, including two that are currently under construction.
Terreno Realty Corporation acquires, owns and operates industrial real estate in six major coastal U.S. markets: Los Angeles, Northern New Jersey/New York City, San Francisco Bay Area, Seattle, Miami, and Washington D.C.
PS Business Parks, Inc., a member of the S&P MidCap 400, is a REIT that acquires, develops, owns and operates commercial properties, primarily multi-tenant industrial, flex and office space. As of October 22, 2019, the Company wholly owned 27.5 million rentable square feet with approximately 4,900 commercial customers in six states and held a 95.0% interest in a 395-unit apartment complex. (California, Texas, Virginia, Florida, Maryland and Washington).
Rexford Industrial, a real estate investment trust focused on owning and operating industrial properties throughout Southern California infill markets, owns 213 properties with approximately 26.6 million rentable square feet and manages an additional 19 properties with approximately 1.0 million rentable square feet.
EastGroup Properties, Inc., an S&P MidCap 400 company, is a self-administered equity real estate investment trust focused on the development, acquisition and operation of industrial properties in major Sunbelt markets throughout the United States with an emphasis in the states of Florida, Texas, Arizona, California and North Carolina. The Company’s goal is to maximize shareholder value by being a leading provider in its markets of functional, flexible and quality business distribution space for location sensitive customers (primarily in the 15,000 to 70,000 square foot range). The Company’s strategy for growth is based on ownership of premier distribution facilities generally clustered near major transportation features in supply-constrained submarkets. EastGroup’s portfolio, including development projects and value-add acquisitions in lease-up and under construction, currently includes approximately 45.6 million square feet.
American Tower, one of the largest global REITs, is a leading independent owner, operator and developer of multitenant communications real estate with a portfolio of approximately 180,000 communications sites.
Crown Castle owns, operates and leases more than 40,000 cell towers and approximately 80,000 route miles of fiber supporting small cells and fiber solutions across every major U.S. market. This nationwide portfolio of communications infrastructure connects cities and communities to essential data, technology and wireless service – bringing information, ideas and innovations to the people and businesses that need them.
Extra Space Storage Inc., headquartered in Salt Lake City, Utah, is a self-administered and self-managed REIT and a member of the S&P 500. As of December 31, 2019, the Company owned and/or operated 1,817 self-storage stores in 40 states, Washington D.C. and Puerto Rico. The Company’s stores comprise approximately 1.3 million units and approximately 140.0 million square feet of rentable space. The Company offers customers a wide selection of conveniently located and secure storage units across the country, including boat storage, RV storage and business storage. The Company is the second largest owner and/or operator of self-storage stores in the United States and is the largest self-storage management company in the United States.
Urstadt Biddle Properties Inc. is a self-administered equity real estate investment trust which owns or has equity interests in 81 properties containing approximately 5.3 million square feet of space. Listed on the New York Stock Exchange since 1970, it provides investors with a means of participating in ownership of income-producing properties. It has paid 200 consecutive quarters of uninterrupted dividends to its shareholders since its inception and has raised total dividends to its shareholders for the last 26 consecutive years.
Fundamental Distribution Data
The table is sorted by NAREIT sector, then by CenterSquare sector, and shows the market-cap in millions in the right-hand column.
It is a coincidence that there is a seeming balance among the sectors. There was no consideration of who they are or what they do in the visual chart filter.
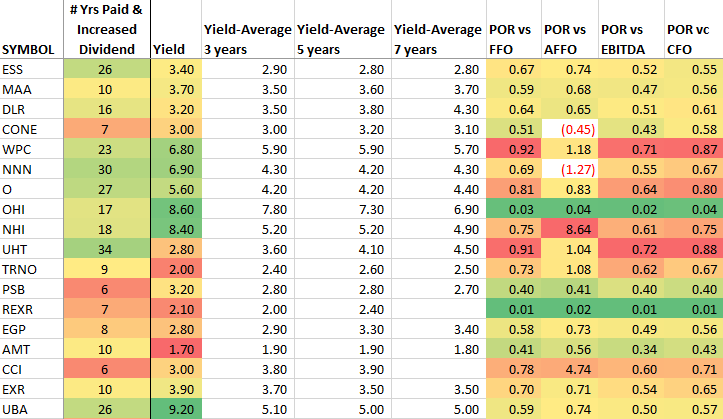
The next chart provides yield information:
# years distributions paid and increased without interruption (from Drip Investing), current trailing yield of each REIT (from AAII database subscription version), and 3-year, 5-year, and 7-year average yield (from AAII database).
A current yield higher than the averages could indicate a discount that might be captured as a gain in the future if the yield returns to its historical average level by action of the price rising as opposed to the distribution being reduced.
One way to think about whether the distribution will be reduced is to look at the payout ratio which is expressed here four ways:
- Payout versus FFO (funds provided by operations, basically EBITDA minus interest)
- Payout versus AFFO (adjusted funds provided by operations, primarily FFO minus cap-ex)
- Payout versus EBITDA (earnings before interest taxes depreciation and amortization)
- Payout versus CFO (cash flow from operations, the first of three totals in the Cash Flow Statement)
We have not independently verified any of this data which we certainly would do by reading the SEC filings for any REIT that we thought we might purchase. You should do the same.
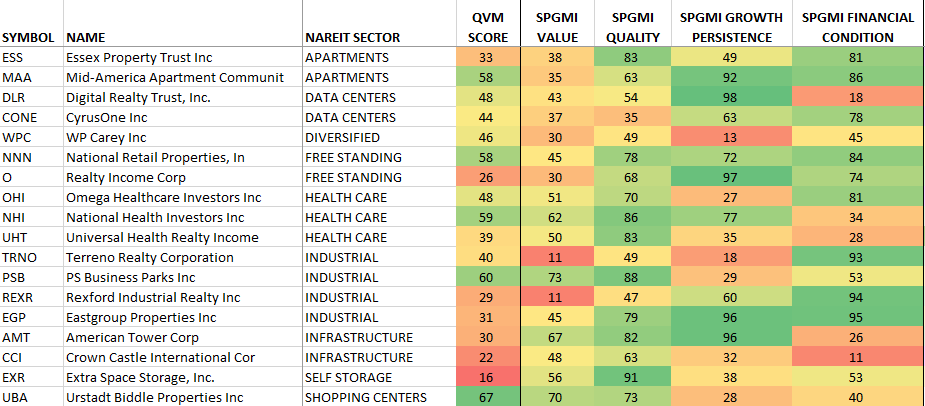
Composite Fundamental Ratings
Next, we wanted to look at a composite of fundamental data about each REIT. This next table presents our proprietary REIT scoring system (0 to 100) and the scoring system from Standard & Poor’s Global Market Intelligence (0 to 100).
The Standard & Poor’s evaluation has four dimensions:
- Value
- Quality
- Growth persistence
- Financial health
The methodology behind the Standard & Poor’s scoring system which it applies to stocks generally is proprietary to it and not disclosed, but there are first-class organizations whose opinion is worth considering.
The QVM REIT-specific scoring system is also proprietary and not fully disclosed, but we will say this. It uses 32 different tests covering seven broad areas:
- Leverage
- Valuation
- Distributions
- Revenue
- FFO
- Anti-dilution
- Sustainable growth rate
Those 32 tests are variously evaluated relative to growth versus inflation, growth versus revenue growth of the REIT itself, the dimension relative to the overall REIT index, and the dimension relative to its own historical values.
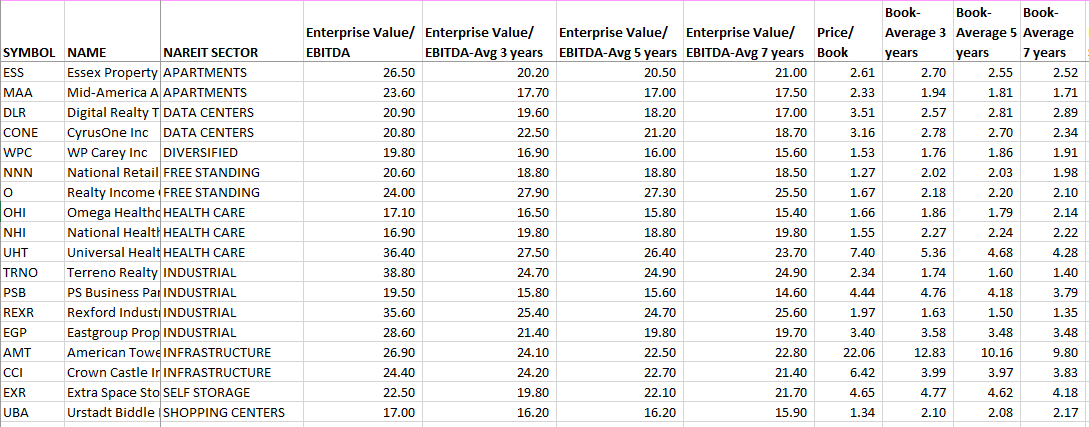
Fundamental Valuation Data
This table is a partial listing of some of the valuation data we use in the QVM scoring system:
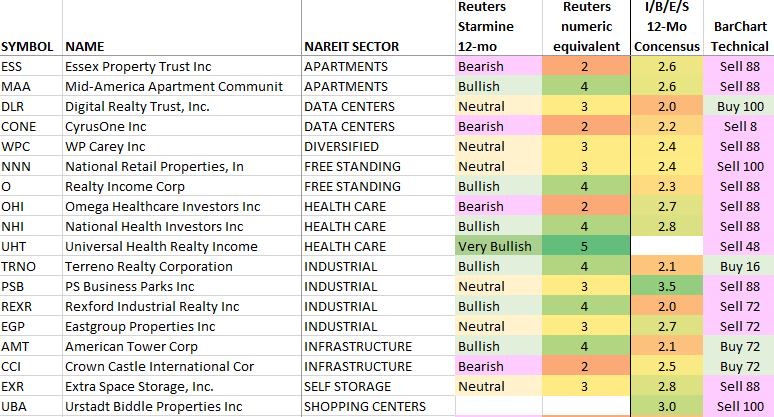
Analyst Short-Term And 12-Month Forward Opinions
Last in the filtering process before we delve deeply into the financial statements, SEC filings, website, and investor presentations, we take a look at the opinion of other parties which will not govern our decision but which we want as at least background information.
This next table provides:
- Reuters Starmine 12-mo forward return rating (which it says represents the opinions of the analysts whose opinions have tended to work out the best for the sector)
- I/B/E/S (“Street”) 12-mo forward return rating
- BarChart short-term technical opinion
So, there you have it – a list of plausibly attractive REITs selected by visual inspection of long-term monthly distribution adjusted prices and distribution history.
We hope you find something in this list that appeals to you and strongly suggest that whichever that might be you continue with in-depth examination of their financial statements, SEC filings, websites, and investor presentations.
Disclosure: QVM has positions in some of the securities identified in this article as of the publication date. We certify that except as cited herein, this is our work product. We received no compensation or other inducement from any party to produce this article, and are not compensated by Seeking Alpha in any way relating to this article.
General Disclaimer: This article provides opinions and information, but does not contain recommendations or personal investment advice to any specific person for any particular purpose. Do your own research or obtain suitable personal advice. You are responsible for your own investment decisions. This article is presented subject to our full disclaimer found on the QVM site available here.
Be the first to comment