


JosephBrewster/E+ via Getty Images
Equity LifeStyle Properties (NYSE:ELS) is a real estate investment trust (“REIT”) whose operations are focused on lifestyle-oriented properties, such as manufactured home (“MH”) and recreational vehicle (“RV”) communities and marinas. Altogether, they have an interest in approximately 170K sites located in 35 states and one Canadian Province.
Operationally, they are a close competitor to Sun Communities, Inc. (SUI), who is slightly larger by market value and property scale. Though ELS has outperformed SUI in total returns over a 10-YR time frame, both have handily beat the broader S&P 500, returning 419% and 365%, respectively, versus a return of 238% in the broader index.
YTD, however, both stocks are trailing the broader market indexes, with ELS still performing slightly better but down over 30%, nevertheless.
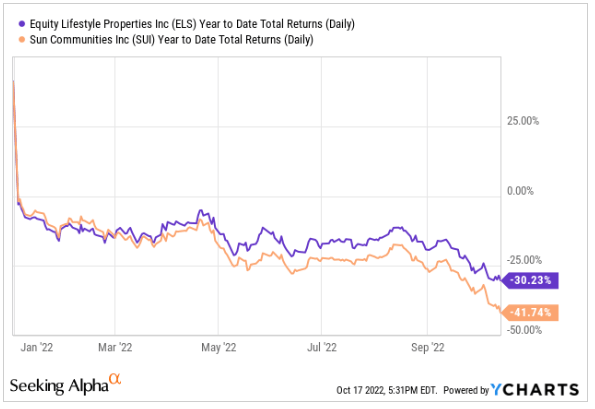
YCharts – YTD Returns Of ELS Compared To SUI
In recent days, shares have enjoyed a brief rally higher off their 52-week lows, but they are still down 30% from their earlier highs. Following their most recent earnings release, shares bumped higher by about 4% in the after-hours trading session in advance of their conference call.
Though the surface-level results appear to give credence to their business model, which continues to benefit from favorable current and long-term demand drivers, scaled down full-year guidance due to the impacts of Hurricane Ian necessitates a pause on any new initiation.
Equity LifeStyle Q3FY22 Earnings Recap
In the most recent quarter ended September 30, 2022, ELS reported total overall revenues of +$381M, which was up nearly 10% from the same period last year and just under +$6M better than expected. Sequentially, revenues came in higher by about 4.3%. Overall normalized funds from operations (“FFO”) were also up YOY and sequentially at 9.9% and 9.2%, respectively.
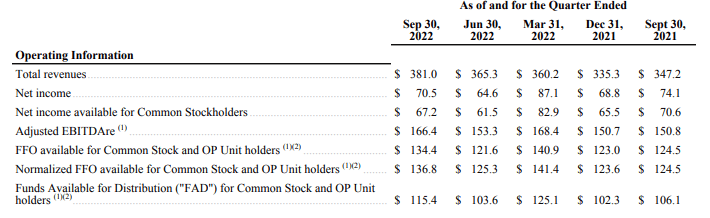
Q3FY22 Earnings Release – Quarterly Operating Summary Of Overall Portfolio
Within the core properties, which includes only the properties that they owned and operated during all of 2021 and 2022, total core operating revenues and income were up 5.3% and 3.5%, respectively. Revenues from MH homes, which account for approximately 60% of total property revenues, were up 5.9%, driven primarily by rate increases on occupancy levels that held strong at 95.2% at period end.
This was paired with a 4.1% increase in RVs and marinas, who together represent 32% of total property revenues. Though seasonal and transient revenues, which accounts for 40% of total RV and marina revenues, were down 2% due to a decline in transients, this was offset by an 8.6% increase in revenues from annuals.
On the expense side, total core operating expenses were up 7.8%, led by an increase of 12.1% and 10.2% in utilities and payroll, respectively. Within utilities, the recovery rate was down 100 basis points due to an acceleration of expenses over income, driven by electric rate increases of 14% during the quarter.
In addition to overall property level strength, the balance sheet remained stable with total leverage levels consistent with those reported in prior periods. The debt ladder also remains accommodative, with average years to maturity of 11.4 years and over 50% of the total burden due after 2031.
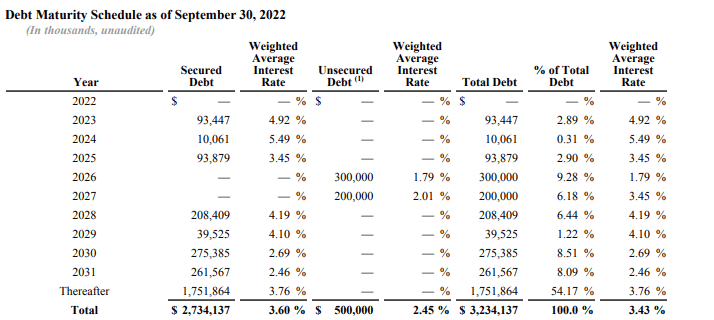
Q3FY22 Investor Supplement – Debt Maturity Schedule
As a result of the impacts from Hurricane Ian, which resulted in a +$3.7M loss during the current period, management scaled back full year guidance to a normalized FFO/share range of $2.64 to $2.70, down from $2.68 to $2.78 projected in Q2FY22.
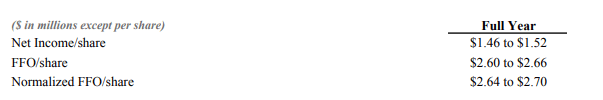
Q3FY22 Earnings Release – Revised Full-Year 2022 Guidance
Post-Earnings Insights
ELS’ reported results again came in better than expected, driven by continued pricing power on their core portfolio of manufactured homes, RVs, and marinas. In the MH segment, the rate increases are coming on occupancy levels that are holding above 95%. And strength in RVs is supported by further increases in annuals over the transients and seasonals, which is indicative of the long-term appeal of their sites.
Though the double-digit increases in utilities expense resulted in a lower recovery rate, partly due to the transient component of their RV properties, a segment that generates lower expense recovery, total overall core expenses were still largely controlled, allowing for a modest increase in core income during the period.
One contributing factor of ELS’s outperformance is their portfolio composition that consists of properties that are located in popular coastal and sunbelt retirement and vacation destinations with favorable existing and long-term demand drivers, such as increased inbound migration from a relevant demographic base and the business model’s relative affordability, especially in relation to single-family housing.
But the location of their properties in these regions could also be a liability, especially during the hurricane season. This was evidenced during Hurricane Ian in the current period, where its path crossed 60% of their Florida portfolio. Though the majority of the impact was minor, ELS did take a larger hit in the Fort Myers area, resulting in an overall write-down in the current period of +$3.7M. This, in turn, forced a revision downwards in full-year guidance.
Over the years, ELS has proved to be a durable portfolio holding that has consistently outperformed the broader markets. In addition, they have rewarded long-time holders with a compound dividend growth rate of 22% from 2006 through 2021. Though the current yield of less than 3% may be unappealing in the current environment, given the alternatives, those holding from 2006 would be sitting on a double-digit yield-on-cost at the current payout of $1.64/share.
Even near their 52-week lows, ELS continues to trade at over 23x the low end of their most recent normalized FFO/share projections. This represents a sizeable premium over SUI, who is currently trading at about 17x. While double-digit compound dividend growth rates may support a premium multiple, shares still seem richly valued compared to SUI due to the close comparability of their respective lifestyle portfolios. Scaled back guidance due to increased uncertainty following Hurricane Ian also was one dent in an otherwise solid earnings release. As such, investors may find it more appropriate to pause on new initiation in favor of more compelling alternatives.
Be the first to comment