

R&A Studio/iStock via Getty Images
The S&P 500 recently finished a remarkable 11% gain in 11 days.
Charlie Bilello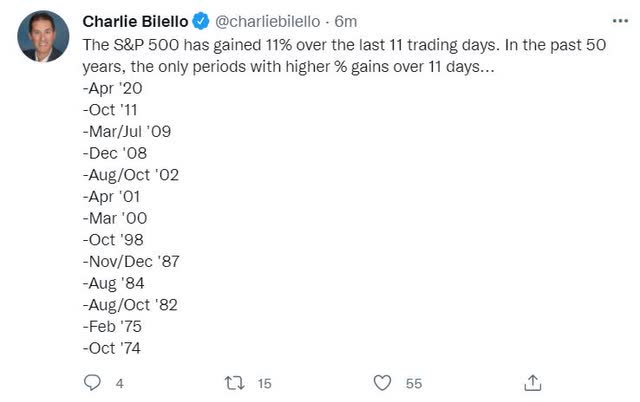
During this incredible run, Apple surged 18%, during a 12-day winning streak, the longest in nearly two decades!
This was the 14th best two-week rally in US market history. Is this a bear market “sucker rally”? Or simply a normal correction recovery?
Is the Fed going to tip us into a recession fighting the worst inflation in four decades? Or successfully engineer a soft landing as it did in 1969, 1984, and 1994?
Is the Russo-Ukrainian war on the verge of a breakthrough? Or are facing years of bloody bombing and global supply chain disruptions?
Is inflation about to peak and start declining rapidly as many economists expect?
Daily Shot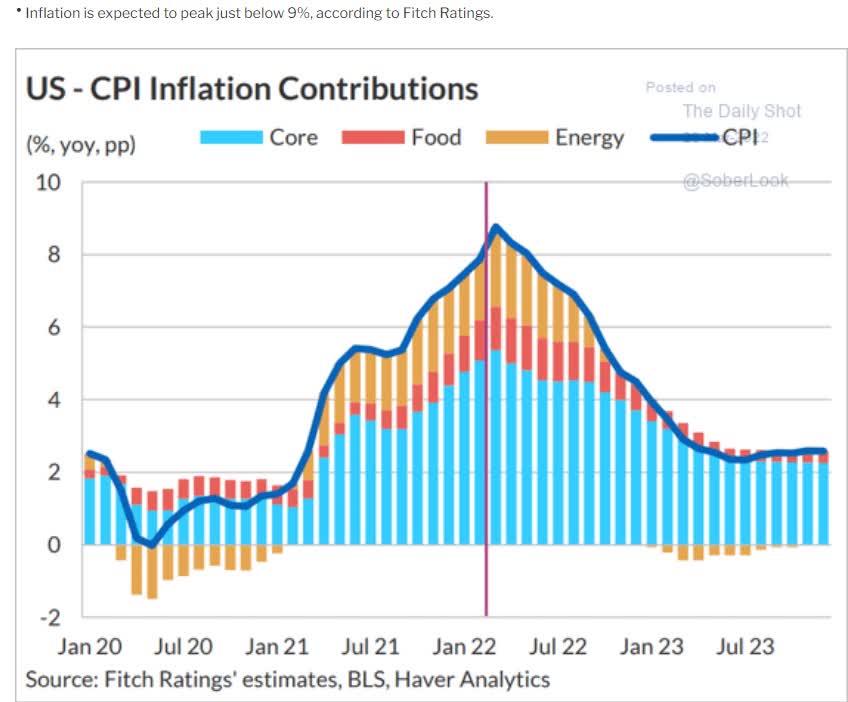
Or is Morgan Stanley right and we’ve passed the point of no return and are in an inflationary spiral?
Daily Shot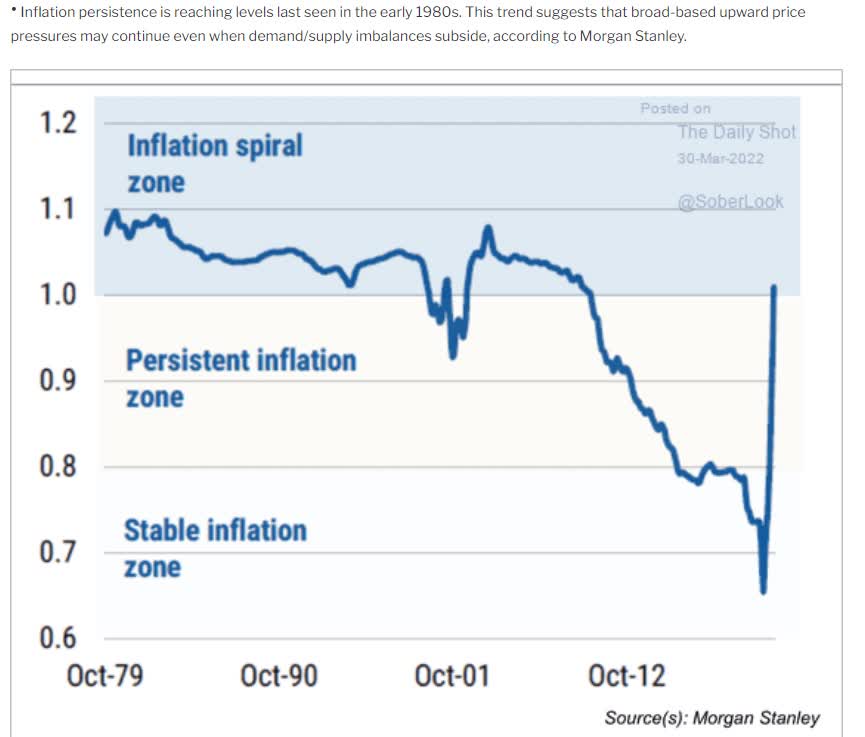
One that could potentially keep inflation at near 8% for the next year?
Daily Shot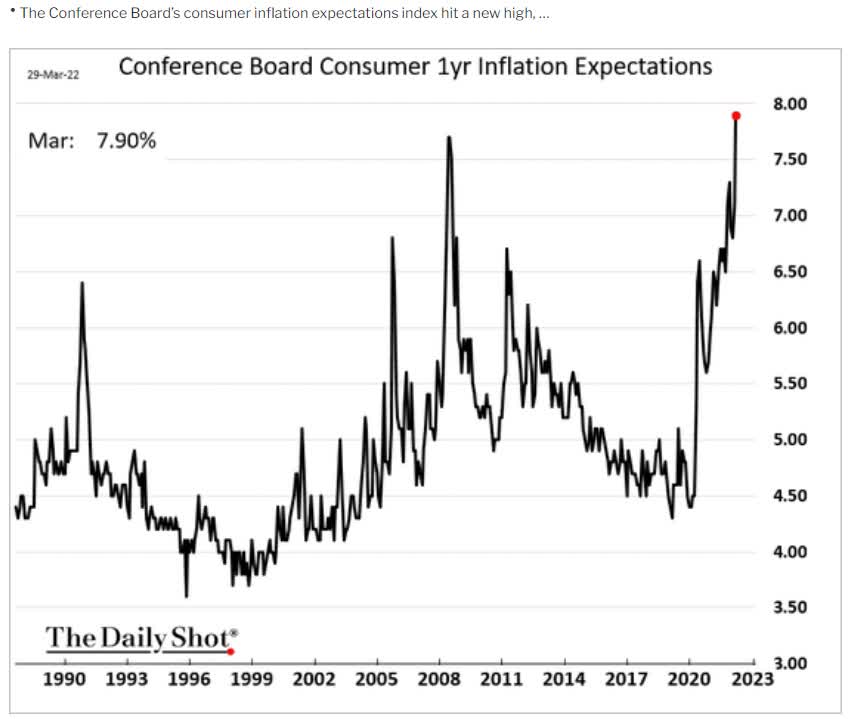
Are analysts who think inflation will drive strong earnings growth in 2022 and 2023 right?
Daily Shot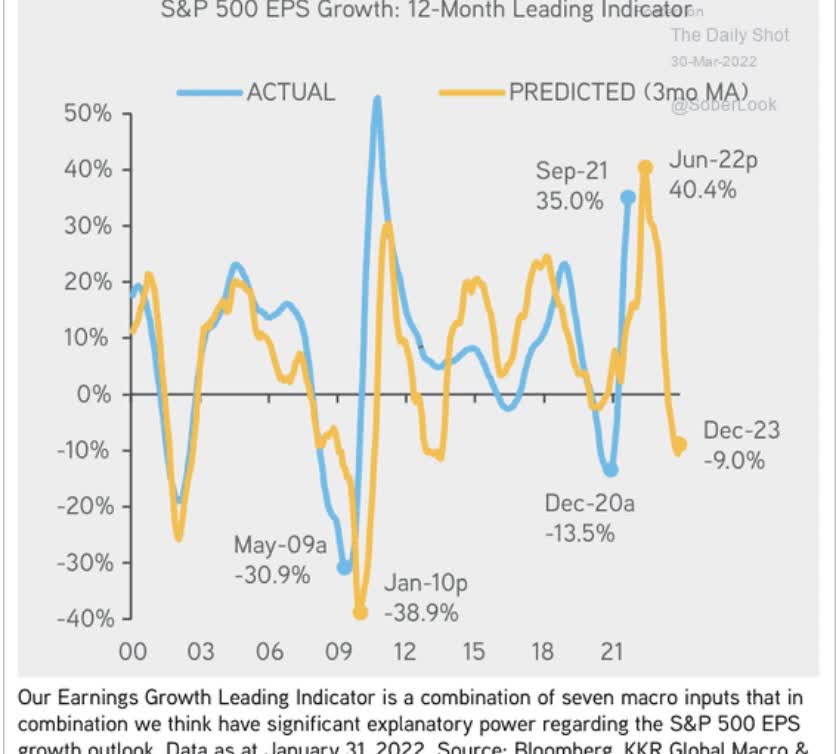
Or is high inflation going to start hurting margins and lead to an earnings recession by the end of next year, as Bloomberg expects?
These are just some of the hard questions that today’s investors face.
These risk factors can be especially frightening for retirees or those approaching retirement. After all, while the young might have decades to recover from a bear market, older investors don’t.
So let me share with you why Enterprise Products Partners (NYSE:EPD), is one of my favorite high-yield recommendations for those seeking the safest 7.2% yield on Wall Street today.
Not just incredible safe and generous yield but also inflation-fighting income growth and return potential tomorrow.
Or to put it another way, let me share with you the three reasons why Enterprise is the perfect 7.2% yielding rich retirement dream stock for whatever is coming next in terms of:
- the war
- inflation
- interest rates
- the economy
- and the stock market
Reason One: World-Class Quality You Can Trust In All Economic Conditions
The Dividend King’s overall quality scores are based on a 241 point model that includes:
-
dividend safety
-
balance sheet strength
-
credit ratings
-
credit default swap medium-term bankruptcy risk data
-
short and long-term bankruptcy risk
-
accounting and corporate fraud risk
-
profitability and business model
-
growth consensus estimates
-
management growth guidance
-
historical earnings growth rates
-
historical cash flow growth rates
-
historical dividend growth rates
-
historical sales growth rates
-
cost of capital
-
long-term risk-management scores from MSCI, Morningstar, FactSet, S&P, Reuters’/Refinitiv, and Just Capital
-
management quality
-
dividend friendly corporate culture/income dependability
-
long-term total returns (a Ben Graham sign of quality)
-
analyst consensus long-term return potential
In fact, it includes over 1,000 fundamental metrics including the 12 rating agencies we use to assess fundamental risk.
- 41% based on credit and risk-management ratings
- 82% focused on fundamental risk
How do we know that our safety and quality model works well?
During the two worst recessions in 75 years, our safety model 87% of blue-chip dividend cuts, the ultimate baptism by fire for any dividend safety model.
And then there’s the confirmation that our quality ratings are very accurate.
DK Zen Phoenix: Superior Fundamentals Lead To Superior Long-Term Results
| Metric | US Stocks | 188 Real Money DK Phoenix Recs |
| Great Recession Dividend Growth | -25% | 0% |
| Pandemic Dividend Growth | -1% | 6% |
| Positive Total Returns Over The Last 10 Years | 42% | 99.5% (Greatest Investors In History 60% to 80% Over Time) |
| Lost Money/Went Bankrupt Over The Last 10 Years | 47% | 0.5% |
| Outperformed Market Over The Last Decade (299%) | 36% | 51% |
| Bankruptcies Over The Last 10 Years | 11% | 0% |
| Permanent 70+% Catastrophic Decline Since 1980 | 44% | 0.5% |
| 100+% Total Return Over The Past 10 Years | NA | 88% |
| Sources: Morningstar, JPMorgan, Seeking Alpha |
Basically, historical market data confirms that the DK safety and quality model is one of the most comprehensive and accurate in the world.
This is why I entrust 100% of my life savings to this model and the DK Phoenix blue-chip strategy.
Dividend Safety
| Rating | Dividend Kings Safety Score (138 Point Safety Model) | Approximate Dividend Cut Risk (Average Recession) |
Approximate Dividend Cut Risk In Pandemic Level Recession |
| 1 – unsafe | 0% to 20% | over 4% | 16+% |
| 2- below average | 21% to 40% | over 2% | 8% to 16% |
| 3 – average | 41% to 60% | 2% | 4% to 8% |
| 4 – safe | 61% to 80% | 1% | 2% to 4% |
| 5- very safe | 81% to 100% | 0.5% | 1% to 2% |
| EPD | 90% | 0.5% | 1.5% |
| Risk Rating | Low-Risk (77th percentile risk management consensus) | BBB+ Stable credit rating, 5% 30-year bankruptcy risk | 20% OR LESS Max Risk Cap Recommendation |
Long-Term Dependability
| Company | DK Long-Term Dependability Score | Interpretation | Points |
| Non-Dependable Companies | 21% or below | Poor Dependability | 1 |
| Low Dependability Companies | 22% to 60% | Below-Average Dependability | 2 |
| S&P 500/Industry Average | 61% (58% to 70% range) | Average Dependability | 3 |
| Above-Average | 71% to 80% | Very Dependable | 4 |
| Very Good | 81% or higher | Exceptional Dependability | 5 |
| EPD | 83% | Exceptional Dependability | 5 |
Overall Quality
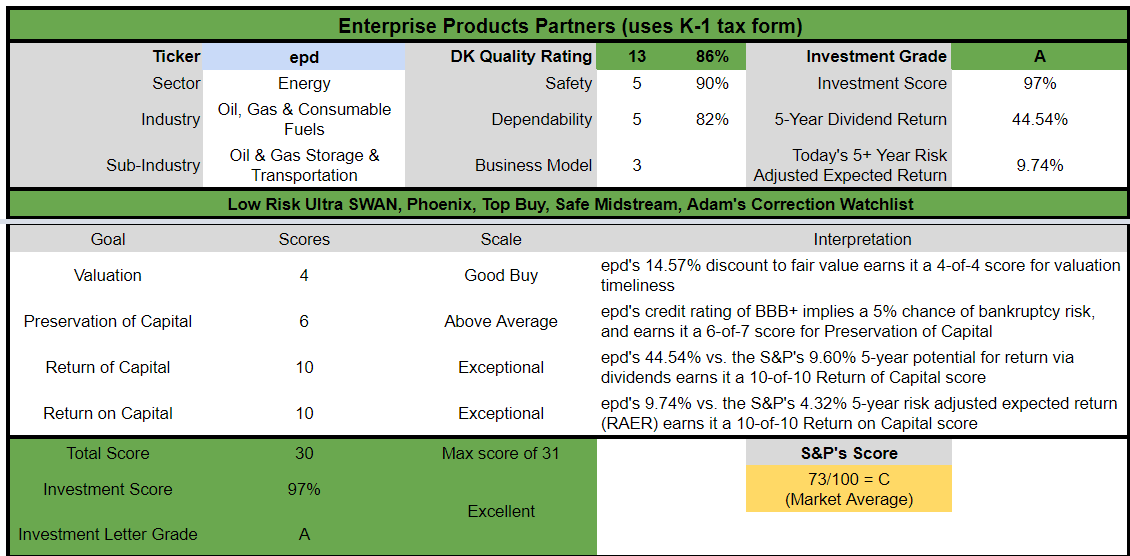
| EPD | Final Score | Rating |
| Safety | 90% | 5/5 very safe |
| Business Model | 70% | 3/3 wide moat |
| Dependability | 83% | 5/5 exceptional |
| Total | 86% | 13/13 Ultra SWAN |
| Risk Rating | 3/3 Low-risk | |
| 20% OR LESS Max Risk Cap Rec |
5% Margin of Safety For A Potentially Good Buy |
EPD: 74th Highest Quality Master List Company (Out of 509) = 86th Percentile
The DK 500 Master List includes the world’s highest quality companies including:
-
All dividend champions
-
All dividend aristocrats
-
All dividend kings
-
All global aristocrats (such as BTI, ENB, and NVS)
-
All 13/13 Ultra Swans (as close to perfect quality as exists on Wall Street)
- 45 of the world’s best growth stocks (on its way to 50)
EPD’s 86% quality score means its similar in quality to such blue-chips as
- Cummins (CMI)
- Altria (MO)
- NVIDIA (NVDA)
- Walmart (WMT) – dividend aristocrat
- Realty Income (O) – dividend aristocrat
- Mastercard (MA)
- Comcast (CMCSA) – recent recommendation
- Lockheed Martin (LMT)
- Abbott Labs (ABT) – dividend king
- Visa (V)
- Philip Morris International (PM) – dividend king
- Medtronic (MDT) – dividend aristocrat – recent recommendation
Even among the world’s highest quality companies, EPD is higher quality than 86% of them.
EPD is the highest quality midstream you can own.
| Company/MLP | Ticker | Safety Score | Quality Score | ESG/Long-Term Risk Management Consensus Industry Percentile | Longest Maturing Bond |
Longest Maturing Bond Yield To Maturity |
| Enterprise Products Partners (uses K-1 tax form) | EPD | 90% | 86% | 77% | 2078 | 4.7% |
| Enbridge | ENB | 87% | 84% | 88% | 2112 | 4.6% |
| Magellan Midstream Partners (uses K-1) | MMP | 85% | 83% | 70% | 2050 | 3.8% |
| National Fuel Gas | NFG | 83% | 78% | 40% | 2031 | 2.7% |
| Pembina Pipeline Corp | PBA | 82% | 76% | 69% | 2081 | 5.9% |
| Brookfield Infrastructure Corp | BIPC | 78% | 75% | 44% | 2032 | 3.0% |
| TC Energy | TRP | 79% | 74% | 69% | 2081 | 5.0% |
| ONEOK | OKE | 75% | 73% | 76% | 2051 | 4.3% |
| Kinder Morgan | KMI | 74% | 71% | 60% | 2098 | 4.9% |
| NextEra Energy Partners | NEP | 66% | 70% | 80% | 2026 | 2.8% |
| MPLX (uses K-1) | MPLX | 74% | 69% | NA | 2058 | 3.9% |
| Williams Companies | WMB | 67% | 65% | 65% | 2050 | 3.3% |
| Average | 78% | 75% | 67% | 2062 | 4.1% |
(Source: DK Research Terminal)
Why I Trust Enterprise With My Retirement Savings And So Should You
-
Deep Dive On Why The Energy Transition Will Take Decades
- This article explains why EPD’s business model won’t likely be disrupted anytime soon
- the bond market is confident EPD will still be around to pay off its 2078 bonds
But here’s the summary.
The energy transition, no matter what any politician tells you, WILL NOT happen quickly.
We need 6X of the current mineral production to make the green energy transition by 2050.
On average it takes over 16 years to get a new lithium mine into production thanks to the very regulations and lawsuits that environmentalists keep advocating for.
We need 135X as much lithium production as we have now.
10 to 20 years to go 100% green? Simply not possible. Not opinion, objective fact.
- 30 to 50 years is what experts actually expect the energy transition to take
And helping make that transition is Enterprise, one of the widest moat midstreams in America.
Investment Thesis Summary
Enterprise’s assets and geographical diversity allow it to pursue growth in virtually any environment…
In the current spending environment, the pivot is toward petrochemicals.
It can aggregate the supply of every type of hydrocarbon from multiple sources in major producing basins and deliver it to multiple end markets (refiners, petrochemicals, exports)…
The firm has built out a dominant position in natural gas liquids. This means it will be the primary beneficiary as U.S. NGL exports increase in the coming years…
In a more volatile midstream environment in 2022, the focus, in our view, will be on capital allocation…
Enterprise is pruning its capital spending budget, while focusing on capturing opportunities within petrochemicals, which we think will be its primary growth driver for the time being as two thirds of capital spending is being directed toward this area.” – Morningstar (emphasis added)
Exceptional Management You Can Trust
We ascribe an Exemplary capital allocation rating to Enterprise Products Partners…
The partnership has consistently been a thoughtful allocator of capital toward midstream projects, has sought to protect the balance sheet through the cycle, and maintained a reasonable stance on capital allocation for unitholders…
Enterprise retains sufficient distributable cash flow to reinvest in the business while limiting reliance on dilutive equity and debt capital market issuances.
Management has consistently pursued a prudent approach to achieving consistent, steady growth and returns. The recent achievement of self-funding the equity portion of its capital expenditure program a year ahead of schedule plus the announcement of a $2 billion unit buyback further cements the management team as worthy of our Exemplary rating…
Enterprise’s exemplary stewardship of its business mostly mitigates our concern about the limited rights of LP holders.
In Enterprise’s case, we continue to think the deep-seated apathy toward the firm is misguided, especially master limited partnership related concerns. Enterprise is unlikely to switch to a c-corp structure, given it can fund its spending program without issuing equity, and the need to issue equity to fund projects has forced similar conversions in the past, in our view.” – Morningstar (emphasis added)
This is why EPD’s management is considered the best in the industry.
- “chess masters while everyone else is playing checkers” – Morningstar
- $43 billion in cash returned to investors since 1998.
- While transitioning to a fully self-funded business model.
- With zero reliance on equity growth funding.
And raising the distribution every year for nearly a quarter-century including through:
- three oil crashes
- including -$38 crude in April 2020
- three recessions
- 2 economic catastrophes
- interest rates ranging from 0.5% to 6.5%
- three bear markets
- dozens of corrections and pullbacks
EPD isn’t just self-funding, its FCF self-funding.
- even after all maintenance and growth spending distributions consume just 84% of free cash flow
- 61% DCF payout ratio in 2021 vs 83% safe according to credit rating agencies
EPD has had a safe payout ratio every single year since 2006.
- in 2016 the oil crash only raised it to 80%
- self-funded since 2018
EPD’s bond profile has the longest duration in the industry, almost 21 years.
54% of its bonds (99.2% fixed rate) are over 30 years in duration, the longest being 56 years.
EPD has locked in 4.4% interest rates, 1/3 of its returns on invested capital, for the next two decades.
EPD is 32% owned by management (EPCO), 45% by individuals, and 23% by institutions.
39% of units have been owned for at least 10 years.
- a long-term focused investor base
- which is another reason not to convert to a c-corp and impose a large tax bill on its investor base
Conference Call Highlights
We generated $6.6 billion of DCF in ’21 compared to $6.4 million in 2020. We had 1.7 times coverage. We retained $2.6 billion of DCF in ’21 and headed into ’22 with significant financial flexibility. We also increased our distribution again in 2021 to $1.815 per common unit, making this the 23rd consecutive year of distribution growth since our IPO in 1998…
We were also excited to announce the agreement to acquire Navitas Midstream. Navitas gives us an attractive entry point for our natural gas processing and NGL businesses in the Midland Basin. We anticipate closing this acquisition in the first quarter of 2022, subject to customary regulatory approvals. Navitas plans for the construction of another natural gas processing plant, which would also provide us additional organic growth…
We expect to fund our acquisition of Navitas with a combination of cash on hand and borrowings under the partnership’s existing commercial paper facility and bank credit facilities. ” – Co-CEO, Q4 conference call
EPD is buying Navitas Midstream for $3.3 billion.
Woodlands, Texas-based Navitas owns a network of around 1,750 miles of natural gas pipelines in the Midland portion of the Permian basin, the region of Texas and New Mexico considered the heart of the U.S. shale industry…
The acquisition will be immediately accretive to Enterprise’s distributable cash flow per unit, Teague said, adding that it would also support additional returns to shareholders through dividends and buybacks.
Based on the current outlook for commodity prices, Enterprise expects the deal to add around 18 cents to 22 cents per unit to its distributable cash flow in 2023.” – Reuters
EPD expects a 6% boost in DCF/unit from this deal next year.
I’d also like to highlight the momentum from our evolutionary technology team. This team is led by Angie Murray and from a commercial perspective, Carrie Weaver is home to bright and creative people.
We have a number of initiatives underway with major players in each segment of the energy value chain. In addition to working on lower carbon opportunities in the areas like hydrogen, carbon sequestration, circular plastics, and renewable fuels, this team and our big data group constantly have a number of important projects underway using the billions of pieces of data that Enterprise has in order to improve the reliability of our systems and optimize these systems every day.” – Co-CEO, Q4 conference call
EPD is working steadily towards a green energy future.
- thus why the bond market is willing to lend to it for 56 years at reasonable rates
While US producers are being firm on capital discipline (not increasing production too quickly) the US is expected to see record oil and gas production by 2025.
- these forecasts are based on $55 US oil (currently $104)
- FactSet consensus for US oil is $62.25 in 2026
US oil exports are expected to reach a record 5 million bpd in 2025.
- 2 million bpd of that is from EPD’s export terminals
- EPD is the #1 oil exporter in the US
Bottom line: EPD Is The Safety And Quality King Of Midstream
- EPD’s management is considered the best in the industry according to the analyst consensus.
- it will be a cold day in hell before EPD’s management screws over investors
- EPD’s management, through EPCO, owns 32% of the stock
- paying them $1.35 billion per year in tax-deferred income
- EPD will likely never convert to a c-Corp
- and next put the payout at risk
- the expert consensus of management, analysts, rating agencies, and the bond market all agree EPD has a bright future
EPD Credit Ratings
| Rating Agency | Credit Rating | 30-Year Default/Bankruptcy Risk | Chance of Losing 100% Of Your Investment 1 In |
| S&P | BBB+ stable outlook | 5.00% | 20.0 |
| Fitch | BBB+ stable outlook | 5.00% | 20.0 |
| Moody’s | BBB+ stable outlook | 5.00% | 20.0 |
| Consensus | BBB+ stable outlook | 5.00% | 20.0 |
(Source: S&P, Fitch)
EPD shares the highest credit ratings in its industry, which means a 5% fundamental risk of losing all your money.
EPD Leverage Consensus Forecast
| Year | Debt/EBITDA | Net Debt/EBITDA (5.0 Or Less Safe According To Credit Rating Agencies) |
Interest Coverage (2.5+ Safe) |
| 2020 | 3.72 | 3.58 | 3.91 |
| 2021 | 3.37 | 3.18 | 4.92 |
| 2022 | 3.44 | 3.28 | 4.85 |
| 2023 | 3.26 | 3.06 | 5.15 |
| 2024 | NA | 2.90 | 5.48 |
| 2025 | NA | NA | 5.89 |
| Annualized Change | -4.37% | -5.14% | 8.51% |
(Source: FactSet Research Terminal)
EPD’s fortress balance sheet is expected to keep getting stronger over time.
EPD Balance Sheet Consensus Forecast
| Year | Total Debt (Millions) | Cash | Net Debt (Millions) | Interest Cost (Millions) | EBITDA (Millions) | Operating Income (Millions) | Average Interest Rate |
| 2020 | $30,001 | $410 | $28,819 | $1,287 | $8,056 | $5,035 | 4.29% |
| 2021 | $28,271 | $2,819 | $26,662 | $1,283 | $8,381 | $6,315 | 4.54% |
| 2022 | $29,596 | $1,048 | $28,266 | $1,306 | $8,610 | $6,331 | 4.41% |
| 2023 | $29,035 | $1,284 | $27,315 | $1,280 | $8,915 | $6,586 | 4.41% |
| 2024 | NA | NA | $26,955 | $1,267 | $9,306 | $6,947 | NA |
| 2025 | NA | NA | NA | $1,200 | $9,320 | $7,062 | NA |
| 2026 | NA | NA | NA | NA | $10,014 | NA | NA |
| 2027 | NA | NA | NA | NA | $10,524 | NA | NA |
| Annualized Growth | -1.09% | 46.31% | -1.66% | -1.39% | 3.89% | 7.00% | 0.91% |
(Source: FactSet Research Terminal)
Debt is expected to modestly roll off over time, while cash flows grow at a modest to quick rate.
Bond Profile: The Smart Money On Wall Street Is Confident In EPD’s Green Energy Transition Plans
- $7.7 billion in liquidity
- 91% unsecured bonds (very high financial flexibility)
- well-staggered bond maturities (no trouble refinancing debt)
- 4.4% average borrowing cost vs bond market’s 2.2% long-term inflation forecast
- EPD’s effective real interest rate is 2.2% vs 20.1% cash return on invested capital
- returns on investment are 10X its real borrowing cost
Credit Default SWAPs: Real-Time Fundamental Risk Estimates From The Bond Market
(Source: FactSet Research Terminal)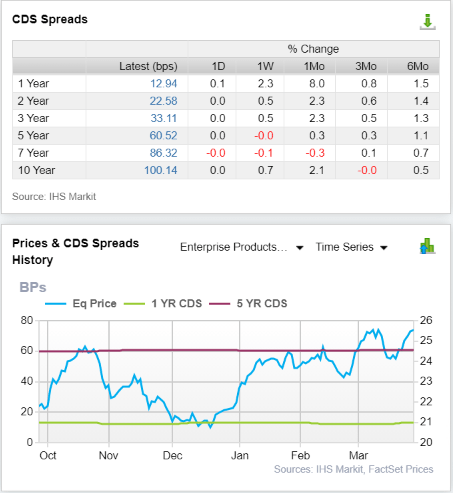
Credit default SWAPs are insurance bond investors take out against bankruptcies and defaults.
They represent a real-time fundamental risk estimate and are affected by things like breaking news, earnings updates, etc.
- EPD’s price may rise or fall but its fundamental risk is very stable
- the bond market is estimating a 3% default risk of 30 years
- treating EPD as an A-rated company
- analysts, rating agencies, the bond market, and management all agree the investment thesis is intact
EPD Profitability: Wall Street’s Favorite Quality Proxy
EPD historically has profitability in the top 20% of its peers.
EPD Trailing 12-Month Profitability Vs Peers
| Metric | Industry Percentile | Major Oil & Gas Companies More Profitable Than EPD (Out Of 1,108) |
| Operating Margin | 65.58 | 381 |
| Net Margin | 71.20 | 319 |
| Return On Equity | 78.44 | 239 |
| Return On Assets | 77.08 | 254 |
| Return On Capital | NA | NA |
| Average | 73.08 | 298 |
(Source: GuruFocus Premium)
For midstream (and REITs) moatiness is defined by the asset base, management track record, and cost of capital.
EPD’s industry-leading asset base, management quality, and cost of capital give it a wide and stable moat.
EPD’s profitability has been stable or improving for the last quarter-century.
Recent scaling back on growth spending has sent returns on invested capital and FCF margins soaring.
EPD Growth Spending Consensus Forecast
| Year | Capex |
| 2021 | $2,245 |
| 2022 | $2,556 |
| 2023 | $1,952 |
| 2024 | $1,925 |
| 2025 | $2,041 |
| 2026 | $2,426 |
| 2027 | $2,441 |
| Annualized Growth | 1.40% |
| Total Spending 2020 to 2027 | $15,586 |
(Source: FactSet Research Terminal)
EPD’s growth spending pre-pandemic was $3.3 billion per year.
Spending is expected to fall through 2024.
- this year $1.5 billion in growth spending and about $1.1 billion in maintenance
- then modest accelerating in growth spending in 2025 through 2027
EPD Profit Margin Consensus Forecast
| Year | DCF Margin | EBITDA Margin | EBIT (Operating) Margin | Net Margin |
| 2020 | 23.6% | 29.6% | 18.5% | 13.9% |
| 2021 | 16.2% | 20.5% | 15.5% | 11.4% |
| 2022 | 15.4% | 19.6% | 14.4% | 11.2% |
| 2023 | 15.5% | 19.7% | 14.5% | 11.4% |
| 2024 | 14.2% | 18.0% | 13.5% | 10.7% |
| Annualized Growth | -11.89% | -11.67% | -7.66% | -6.38% |
| Annualized Growth (Ignoring Pandemic) | -4.29% | -4.25% | -4.55% | -2.08% |
(Source: FactSet Research Terminal)
Analysts expect modest margin pressure over time through 2024.
EPD Tax Consensus Forecast
| Year | Pre-Tax Profit | Tax Costs | Tax Rate |
| 2020 | $3,762 | -$124 | -3.30% |
| 2021 | $4,904 | $70 | 1.43% |
| 2022 | $5,135 | $36 | 0.70% |
| 2023 | $5,445 | $38 | 0.70% |
| 2024 | $5,687 | $44 | 0.77% |
| Annualized Growth | 10.88% | -8.07% | -18.47% |
|
Total Taxes 2020 through 2024 |
$114 |
(Source: FactSet Research Terminal)
As an MLP EPD pays virtually no taxes.
- management has no plans to “check the box” and convert to a c-corp.
- which would trigger over $3 billion in deferred tax liabilities for management
- which owns 32% of EPD via EPCO
EPD Distribution Growth Consensus Forecast
| Year | Distribution Consensus | DCF/Share Consensus | Payout Ratio | Retained (Post-Distribution) Cash Flow | Buyback Potential | Debt Repayment Potential |
| 2021 | $1.82 | $3.00 | 60.7% | $2,568 | 4.62% | 9.1% |
| 2022 | $1.87 | $3.12 | 59.9% | $2,720 | 4.90% | 9.6% |
| 2023 | $1.93 | $3.30 | 58.5% | $2,981 | 5.37% | 10.1% |
| 2024 | $1.99 | $3.44 | 57.8% | $3,155 | 5.68% | 10.9% |
| 2025 | $2.06 | $3.53 | 58.4% | $3,199 | 5.76% | NA |
| 2026 | $2.12 | $3.84 | 55.2% | $3,743 | 6.74% | NA |
| 2027 | $2.18 | $4.05 | 53.8% | $4,069 | 7.32% | NA |
| Total 2021 Through 2027 | $13.97 | $24.28 | 57.5% | $22,434.56 | 40.38% | 79.36% |
| Annualized Rate | 3.05% | 5.13% | -1.97% | 7.98% | 7.98% | 6.16% |
(Source: FactSet Research Terminal)
83% is the safety guideline rating agencies like to see for payout ratios. EPD’s is 60% and is expected to fall to 54% by 2026.
- payout growth rate forecast up from 2% to 3% CAGR through 2027
Ycharts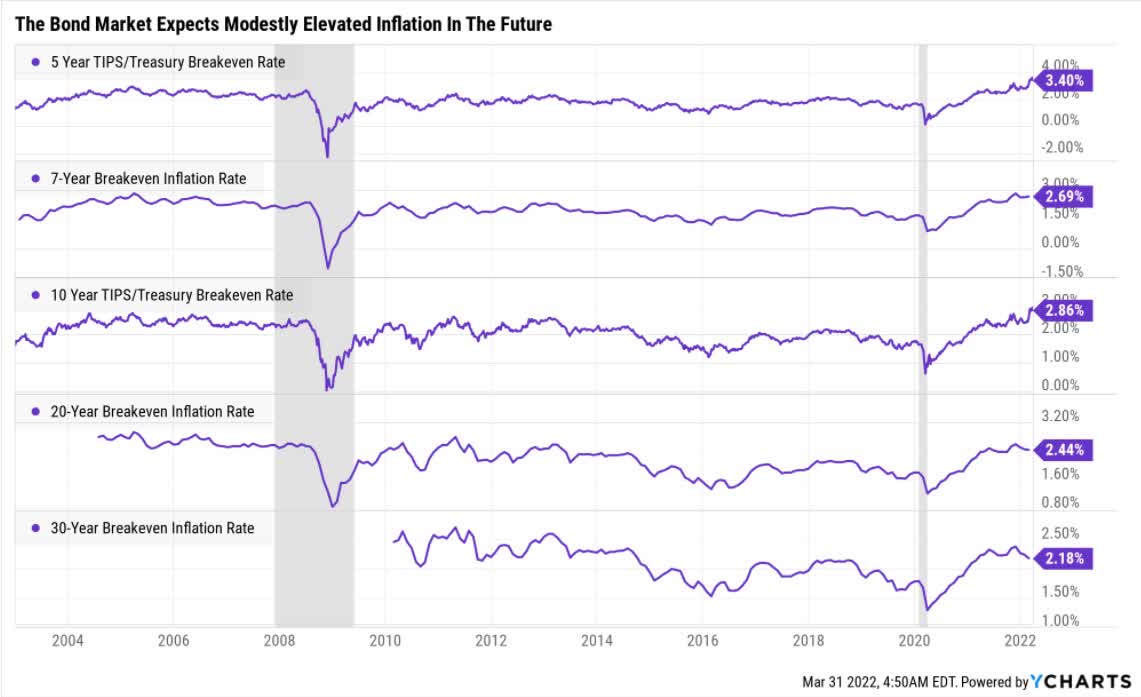
3% income growth might not sound like much, but the bond market thinks it will be enough to keep up with inflation for the next 7+ years.
In fact, it’s about 1% faster than the inflation rate the bond market expects over the next three decades.
$22.4 billion in retained cash flow is enough to pay off 79% of current debt or buy back almost 40% of its stock at a rate up to 8% per year.
EPD Buyback Consensus Forecast
| Year | Consensus Buybacks ($ Millions) | % Of Shares (At Current Valuations) | Market Cap |
| 2022 | $200.0 | 0.4% | $55,563 |
| 2023 | $300.0 | 0.5% | $55,563 |
| 2024 | $300.0 | 0.5% | $55,563 |
| 2025 | $300.0 | 0.5% | $55,563 |
| 2026 | $300.0 | 0.5% | $55,563 |
| 2027 | $300.0 | 0.5% | $55,563 |
| 2028 | NA | 0.0% | $55,563 |
| Total 2022-2027 | $1,700.00 | 3.1% | $55,563 |
| Annualized Rate | 0.52% | Average Annual Buybacks | $283.33 |
(Source: FactSet Research Terminal)
EPD’s buyback program is relatively new and analysts expect it to be a steady 0.5% reduction in the net unit count over time.
| Time Frame (Years) | Net Buyback Rate | Units Remaining | Net Units Repurchased |
| 5 | 0.5% | 97.43% | 2.57% |
| 10 | 0.5% | 94.92% | 5.08% |
| 15 | 0.5% | 92.48% | 7.52% |
| 20 | 0.5% | 90.10% | 9.90% |
| 25 | 0.5% | 87.78% | 12.22% |
| 30 | 0.5% | 85.52% | 14.48% |
(Source: DK Research Terminal, FactSet Research Terminal)
That could result in a 15% reduction in units outstanding over the next 30 years.
Reason Two: Steady Growth To Drive Rising Payouts For Decades To Come
We’ve already seen how the energy transition is likely to take decades, and how EPD is preparing for it so effectively the bond market is willing to lend to them for nearly 60 years.
What kind of growth do analsyts expect from EPD in the medium-term?
EPD Medium-Term Growth Consensus Forecast
| Year | Sales | Distributable Cash Flow | EBITDA | EBIT (Operating Income) | Net Income |
| 2020 | $27,200 | $6,407 | $8,056 | $5,035 | $3,775 |
| 2021 | $40,807 | $6,608 | $8,381 | $6,315 | $4,634 |
| 2022 | $43,881 | $6,749 | $8,610 | $6,331 | $4,895 |
| 2023 | $45,352 | $7,049 | $8,915 | $6,586 | $5,186 |
| 2024 | $51,624 | $7,329 | $9,306 | $6,947 | $5,504 |
| 2025 | NA | $7,708 | $9,320 | $7,062 | $5,770 |
| 2026 | NA | $8,175 | $10,014 | NA | $6,260 |
| 2027 | NA | $8,580 | $10,524 | NA | $6,626 |
| Annualized Growth | 17.37% | 4.26% | 3.89% | 7.00% | 8.37% |
| Annualized Growth (Ignoring Pandemic | 8.15% | 1.74% | 1.76% | 2.41% | 2.91% |
(Source: FactSet Research Terminal)
EPD’s distributable cash flow is the #1 priority for income investors and it’s growing at a steady rate each year.
| Metric | 2022 Growth Consensus | 2023 Growth Consensus | 2024 Growth Consensus | 2025 Growth Consensus | 2026 Growth Consensus |
2027 Growth Consensus |
| Sales | 3% | 2% | 7% | -1% | NA | NA |
| Distribution | 3% | 3% | 3% (25-year streak) | 4% | 3% | 3% |
| Operating Cash Flow | -16% | 5% | 6% | NA | NA | NA |
|
Distributable Cash Flow |
4% | 6% | 4% | 3% | 9% | 5% |
| EBITDA | 2% | 4% | 3% | NA | NA | NA |
| EBIT (operating income) | -2% | 6% | 5% | NA | NA | NA |
(Source: FAST Graphs, FactSet Research)
Analysts expect EPD to become a dividend champion by 2024.
- MLPs are not permitted in the S&P 500 so EPD can never be an official aristocrat
What about the long-term?
EPD Long-Term Growth Outlook
- 3.5% to 4.7% CAGR growth consensus range
- 4.4% CAGR median growth consensus
- 3% to 5.7% individual analyst growth range
OK, but how accurate are analyst forecasts for EPD? Over the last 20 years:
Smoothing for outliers historical analyst margins of error are 5% to the downside and 20% to the upside.
- 3% to 6% CAGR margin-of-error adjusted growth consensus range
Analysts expect similar growth to the last 14 years.
And here’s great news for anyone worried that the recent market rally means all the best blue-chip bargains are gone.
Reason Three: Incredible Quality, Safety, Yield, And An Anti-Bubble Bargain To Boot
Over 20 years, outside of bear markets and bubbles, tens of millions of income investors have paid 10 to 12X cash flow for EPD.
This includes the worst industry bear market in history, which includes two epic oil crashes, the worst recession in over 75 years, and oil trading at -$38 in April 2020.
- 91% statistical probability this represents intrinsic value for EPD
| Metric | Historical Fair Value Multiples (9-Years, 100% worst bear market in industry history) | 2021 | 2022 | 2023 | 2024 |
12-Month Forward Fair Value |
| 5-Year Average Yield | 6.72% | $27.08 | $27.68 | $27.68 | $29.61 | |
| 13-Year Median Yield | 5.85% | $31.11 | $31.79 | $31.79 | $34.02 | |
| 23-Year Average Yield | 6.67% | $27.29 | $27.89 | $27.89 | $29.84 | |
| Operating Cash Flow | 10.00 | $38.80 | $32.50 | $34.20 | $36.40 | |
| Average | $30.42 | $29.80 | $30.15 | $32.22 | $29.89 | |
| Current Price | $25.89 | |||||
|
Discount To Fair Value |
14.89% | 13.13% | 14.12% | 19.64% | 13.38% | |
|
Upside To Fair Value (NOT Including Dividends) |
17.50% | 15.12% | 16.44% | 24.44% | 15.45% (23% including distribution) | |
| 2022 OCF | 20223 OCF | 2022 Weighted OCF | 2023 Weighted OCF | 12-Month Forward OCF | 12-Month Average Fair Value Forward P/OCF |
Current Forward P/OCF |
| $3.25 | $3.42 | $2.44 | $0.86 | $3.29 | 9.08 | 7.86 |
Our model is highly conservative, estimating EPD is worth 9X cash flow but today it is trading at 7.8.
- pricing in -1.4% CAGR growth according to the Graham/Dodd fair value formula
- an anti-bubble blue-chip bargain
- How To Avoid Bubbles And Profit From “Anti-Bubbles”
As long as you avoid becoming a forced seller for emotional or financial reasons, and EPD grows faster than zero over time, it’s mathematically impossible to lose money on this investment over the long-term.
|
Analyst Median 12-Month Price Target |
Morningstar Fair Value Estimate |
| $29.17 (8.5X cash flow) | $27.50 (8.4X cash flow) |
|
Discount To Price Target (Not A Fair Value Estimate) |
Discount To Fair Value |
| 12.48% | 7.16% |
|
Upside To Price Target (Not Including Dividend) |
Upside To Fair Value (Not Including Dividend) |
| 14.26% | 7.72% |
|
12-Month Median Total Return Price (Including Dividend) |
Fair Value + 12-Month Dividend |
| $31.03 | $29.36 |
|
Discount To Total Price Target (Not A Fair Value Estimate) |
Discount To Fair Value + 12-Month Dividend |
| 17.72% | 13.04% |
|
Upside To Price Target ( Including Dividend) |
Upside To Fair Value + Dividend |
| 21.54% | 15.00% |
Analysts expect EPD to deliver 22% total returns in the next year and that forecast is justified by its fundamentals.
Of course, I don’t care about 12-month price forecasts, only whether or not EPD’s margin of safety compensates you sufficiently for its risk profile.
| Rating | Margin Of Safety For Low-Risk 13/13 Ultra SWAN Quality Companies | 2022 Price | 2023 Price |
12-Month Forward Fair Value |
| Potentially Reasonable Buy | 0% | $29.80 | $30.15 | $29.88 |
| Potentially Good Buy | 5% | $28.31 | $28.64 | $28.39 |
| Potentially Strong Buy | 15% | $25.33 | $25.63 | $25.40 |
| Potentially Very Strong Buy | 25% | $21.24 | $22.61 | $22.41 |
| Potentially Ultra-Value Buy | 35% | $19.37 | $19.60 | $19.42 |
| Currently | $25.53 | 14.34% | 15.32% | 14.57% |
| Upside To Fair Value (Not Including Dividends) | 16.74% | 18.09% | 17.05% |
For anyone comfortable with its risk profile EPD is a potentially good buy, bordering on a strong buy, and here’s why.
Consensus Return Potential That’s Far Beyond What The Market Can Offer
For context, here’s the return potential of the 20% overvalued S&P 500.
| Year | EPS Consensus | YOY Growth | Forward PE | Blended PE | Overvaluation (Forward PE) |
Overvaluation (Blended PE) |
| 2021 | $206.30 | 50.38% | 20.7 | 21.9 | 20% | 25% |
| 2022 | $225.37 | 9.24% | 20.3 | 20.5 | 18% | 16% |
| 2023 | $248.05 | 10.06% | 18.4 | 19.4 | 7% | 10% |
| 2024 | $275.12 | 10.91% | 16.6 | 17.5 | -3% | 0% |
| 12-Month forward EPS | 12-Month Forward PE | Historical Overvaluation | PEG | 25-Year Average PEG | S&P 500 Dividend Yield |
25-Year Average Dividend Yield |
| $227.28 | 20.132 | 19.48% | 2.37 | 3.62 | 1.41% | 2.01% |
(Source: DK S&P 500 Valuation And Total Return Tool)
Stocks have already priced in 97% EPS growth from 2020 through 2024 and are trading at 20X forward earnings.
- 16.85 is the 25-year average
- 16.9 is the 10-year average (low rate era)
- A 15.1% correction needed to get back to the historical market fair value
S&P 500 2027 Consensus Return Potential
| Year | Upside Potential By End of That Year | Consensus CAGR Return Potential By End of That Year | Probability-Weighted Return (Annualized) |
Inflation And Risk-Adjusted Expected Returns |
| 2027 | 32.31% | 5.76% | 4.32% | 0.75% |
(Source: DK S&P 500 Valuation And Total Return Tool)
Adjusted for inflation, the risk-expected returns of the S&P 500 are about 0.8% for the next five years.
- S&P’s historical inflation-adjusted returns are 6.4% CAGR
- currently, the market is offering just 11% of its historical real return
| S&P Earnings Yield | 10-Year US Treasury Yield | Earning Yield Risk-Premium (3.7% 10 and 20-year average) |
| 4.97% | 2.52% | 2.45% |
| Theoretical Interest Rate Justified Market Fair Value Forward PE | Current PE |
Theoretically Interest Rate Justified Market Decline |
| 16.08 | 20.13 | 20.11% |
(Source: DK S&P 500 Valuation And Total Return Tool)
Even adjusting for interest rates, stocks still require an even larger 20% correction before they become theoretically fairly valued.
But here’s what investors buying EPD today can reasonably expect (3% to 6% growth and 10 to 12X cash flow)
- 5-year consensus return potential range: 12% to 18% CAGR
EPD 2024 Consensus Total Return Potential
(Source: FAST Graphs, FactSet)
- 64% consensus return potential through 2024
- 20% annual returns
- Buffett-like return potential from an anti-bubble blue-chip bargain hiding in plain sight
EPD 2027 Consensus Total Return Potential
(Source: FAST Graphs, FactSet)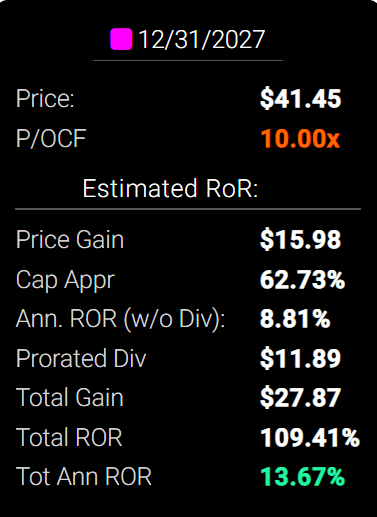
- if EPD grows as expected and returns to historical fair value (low end) 109% total return in five years
- 14% annually
- over 3X the S&P 500 consensus
What does this mean for potential EPD investors?
EPD Investment Decision Score
DK (Source: DK Automated Investment Decision Tool)
For anyone comfortable with its risk profile, EPD is one of the most reasonable and prudent high-yield blue-chips you can buy today.
- 15% discount vs 20% market premium
- far superior fundamental quality and safety
- 15% higher long-term return potential than S&P 500 overtime
- almost 3X the risk-adjusted expected return for the next five years
- 5.2X the market’s yield
- a much safer yield at that (23-year distribution growth streak)
And what about the long-term?
| Investment Strategy | Yield | LT Consensus Growth | LT Consensus Total Return Potential | Long-Term Risk-Adjusted Expected Return | Long-Term Inflation And Risk-Adjusted Expected Returns | Years To Double Your Inflation & Risk-Adjusted Wealth |
10 Year Inflation And Risk-Adjusted Return |
| Enterprise Products Partners | 7.2% | 4.4% | 11.6% | 8.2% | 6.0% | 12.0 | 1.79 |
| Safe Midstream | 5.3% | 6.0% | 11.3% | 7.9% | 5.7% | 12.6 | 1.75 |
| Safe Midstream + Growth | 3.3% | 8.5% | 11.8% | 8.3% | 6.1% | 11.8 | 1.80 |
| REITs | 2.9% | 6.5% | 9.4% | 6.6% | 4.4% | 16.4 | 1.54 |
| High-Yield | 2.8% | 11.3% | 14.1% | 9.9% | 7.7% | 9.4 | 2.10 |
| Europe | 2.6% | 12.8% | 15.4% | 10.7% | 8.6% | 8.4 | 2.27 |
| 10-Year US Treasury | 2.5% | 0.0% | 2.5% | 1.8% | -0.4% | -167.4 | 0.96 |
| Dividend Aristocrats | 2.2% | 8.9% | 11.1% | 7.8% | 5.6% | 12.9 | 1.72 |
| 60/40 Retirement Portfolio | 2.1% | 5.1% | 7.2% | 5.1% | 2.9% | 24.9 | 1.33 |
| Value | 2.1% | 12.1% | 14.1% | 9.9% | 7.7% | 9.3 | 2.10 |
| REITs + Growth | 1.8% | 8.9% | 10.6% | 7.4% | 5.2% | 13.7 | 1.67 |
| High-Yield + Growth | 1.7% | 11.0% | 12.7% | 8.9% | 6.7% | 10.8 | 1.91 |
| Dividend Growth | 1.6% | 8.0% | 9.6% | 6.7% | 4.5% | 15.9 | 1.56 |
| S&P 500 | 1.4% | 8.5% | 9.9% | 7.0% | 4.8% | 15.1 | 1.59 |
| Nasdaq (Growth) | 0.8% | 10.7% | 11.5% | 8.1% | 5.9% | 12.3 | 1.77 |
(Source: Morningstar, FactSet, Ycharts)
- 11.7% long-term returns = better than the S&P, aristocrats, and Nasdaq
- and with 7.3% tax-deferred distributions on day 1
Inflation-Adjusted Consensus Total Return Potential: $1,000 Initial Investment
| Time Frame (Years) | 7.7% CAGR Inflation-Adjusted S&P Consensus | 9.0% Inflation-Adjusted Aristocrat Consensus | 9.5% CAGR Inflation-Adjusted EPD Consensus | Difference Between Inflation Adjusted EPD Consensus And S&P 500 |
| 5 | $1,449.03 | $1,540.04 | $1,575.68 | $126.64 |
| 10 | $2,099.70 | $2,371.71 | $2,482.76 | $383.06 |
| 15 | $3,042.53 | $3,652.52 | $3,912.02 | $869.49 |
| 20 | $4,408.74 | $5,625.01 | $6,164.09 | $1,755.35 |
| 25 | $6,388.41 | $8,662.72 | $9,712.61 | $3,324.20 |
| 30 | $9,257.02 | $13,340.91 | $15,303.93 | $6,046.92 |
(Source: DK Research Terminal, FactSet)
How do the prospects of potential 15X inflation-adjusted returns over the next 30 years sound?
| Time Frame (Years) | Ratio Aristocrats/S&P | Ratio Inflation-Adjusted EPD Consensus Vs S&P 500 |
| 5 | 1.06 | 1.09 |
| 10 | 1.13 | 1.18 |
| 15 | 1.20 | 1.29 |
| 20 | 1.28 | 1.40 |
| 25 | 1.36 | 1.52 |
| 30 | 1.44 | 1.65 |
(Source: DK Research Terminal, FactSet)
How about potentially beating the market by nearly 2X over the coming decades?
EPD Total Returns Since 1999
(Source: Portfolio Visualizer Premium) (Source: Portfolio Visualizer Premium) (Source: Portfolio Visualizer Premium)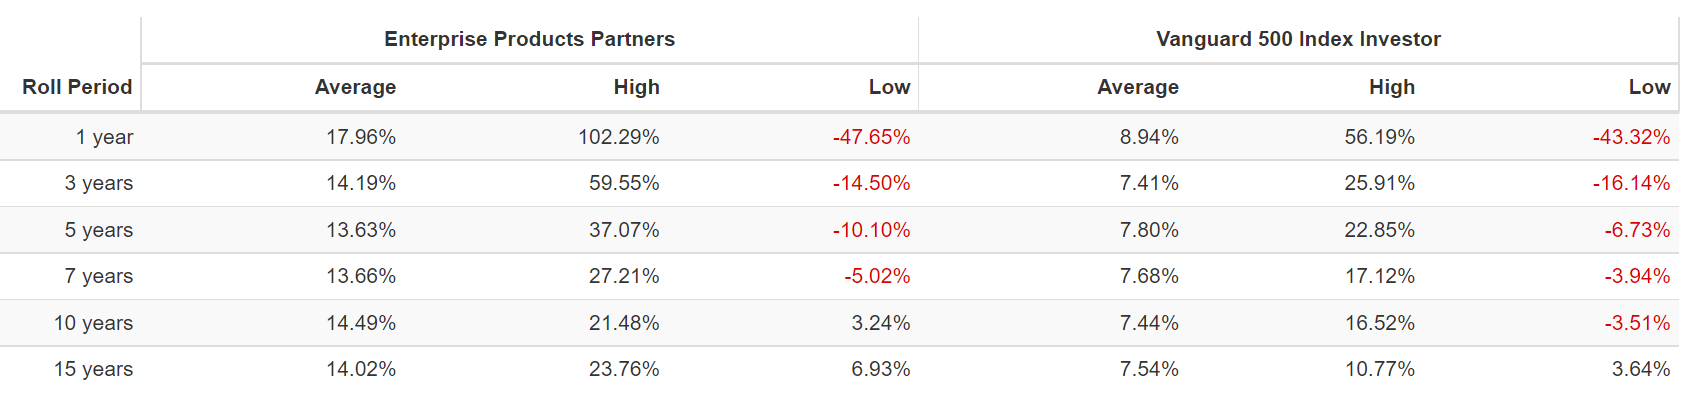
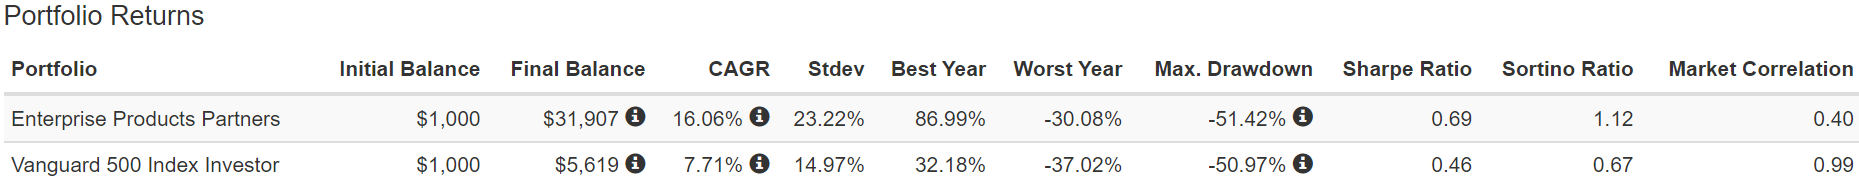

- EPD is expected to deliver slightly lower returns than it has historically
- but still a proven market-beater high-yield investors can trust
But that doesn’t mean EPD is right for everyone.
Risk Profile: Why Enterprise Products Isn’t Right For Everyone
There are no risk-free companies and no company is right for everyone. You have to be comfortable with the fundamental risk profile.
What Could Cause EPD’s Investment Thesis To Break
- safety falls to 40% or less
- balance sheet collapses
- business model completely disrupted
- growth outlook falls to less than 0.3% for seven years
- EPD’s role in a portfolio is to deliver long-term 8+% returns with minimal fundamental risk
- EPD is an energy utility
- like all defensive sectors (REITs, utilities, midstream, healthcare, telecom, consumer staples), I target 8+% long-term return potential for all recommendations
How long it takes for a company’s investment thesis to break depends on the quality of the company.
| Quality |
Years For The Thesis To Break Entirely |
| Below-Average | 1 |
| Average | 2 |
| Above-Average | 3 |
| Blue-Chip | 4 |
| SWAN | 5 |
| Super SWAN | 6 |
| Ultra SWAN | 7 |
These are my personal rule of thumb for when to sell a stock if the investment thesis has broken.
EPD is highly unlikely to suffer such catastrophic declines in fundamentals.
EPD’s Risk Profile Includes
- heavy bet on NGLs (nearly 85% of growth budget)
- regulatory/political risk (pertaining to interstate projects)
- litigation risk (pertaining to interstate projects and industrial accidents)
- industrial accident risk (can cost over $1 billion each to clean up)
- green energy transition execution risk
- M&A execution risk
- talent retention risk
- supply chain disruption risk (causing havoc globally right now)
- cyber security risk: hackers and ransomware (pipelines are now targets)
- virtually no say in how the LP is run
Recession Watch
EPD’s business model is only modestly sensitive to economic cycles.
The bond futures market expects the 10-2 yield curve to invert in June and a mild recession to begin around February 2024.
| Bonds | Yield |
| 3-Month Treasury Yield | 0.55% |
| 2-Year Treasury Yield | 2.28% |
| 10-Year Treasury Yield | 2.32% |
| 10-3M Curve (Most Accurate Recession Forecasting Tool) | 1.77% (Steadily Falling For Several Weeks) |
| 10-2 Curve (Most Popular Yield Curve Followed By Wall Street) | 0.04% |
| Bond Futures Pricing In Inversion | June 2022 |
| Bond Futures Pricing In Recession Start | January 2024 |
| Potential Historically Average Recession Start If Curve Inverts Now (March 30th, 2022) | October 31st, 2023 |
| Potential Historically Average Bear Market Start If Curve Inverts Now (March 30th, 2022) | September 8th, 2023 |
(Source: DK S&P 500 Valuation And Total Return Tool)
The 10-2 curve is the most closely watched by Wall Street but a study from the NY Fed finds that the 10-3 curve is the most accurate at forecasting recessions.
- NY Fed estimates a 6% 12-month recession risk as of March 4th
The St. Louis Fed’s model, based on four economic metrics, estimates a 0.08% chance we’re in a recession right now.
Currently, the bond market is mildly concerned about recession risk and we are monitoring the situation closely each day.
- A recession scare could occur in 2022
- yield curve + BaR economic grid makes it very likely that we’ll see a recession coming at least 10 months out
How do we quantify, monitor, and track such a complex risk profile? By doing what big institutions do.
Material Financial ESG Risk Analysis: How Large Institutions Measure Total Risk
- 4 Things You Need To Know To Profit From ESG Investing
- What Investors Need To Know About Company Long-Term Risk Management (Video)
Here is a special report that outlines the most important aspects of understanding long-term ESG financial risks for your investments.
- ESG is NOT “political or personal ethics based investing”
- it’s total long-term risk management analysis
ESG is just normal risk by another name.” Simon MacMahon, head of ESG and corporate governance research, Sustainalytics” – Morningstar
ESG factors are taken into consideration, alongside all other credit factors, when we consider they are relevant to and have or may have a material influence on creditworthiness.” – S&P
ESG is a measure of risk, not of ethics, political correctness, or personal opinion.
S&P, Fitch, Moody’s, DBRS (Canadian rating agency), AMBest (insurance rating agency), R&I Credit Rating (Japanese rating agency), and the Japan Credit Rating Agency have been using ESG models in their credit ratings for decades.
- credit and risk management ratings make up 41% of the DK safety and quality model
- dividend/balance sheet/risk ratings make up 82% of the DK safety and quality model
Dividend Aristocrats: 67th Industry Percentile On Risk Management (Above-Average, 24/100 Medium Risk)
EPD Long-Term Risk Management Consensus
| Rating Agency | Industry Percentile |
Rating Agency Classification |
| Morningstar/Sustainalytics 20 Metric Model | 94.9% |
21.5/100 Medium-Risk |
| Reuters’/Refinitiv 500+ Metric Model | 56.4% | Satisfactory |
| FactSet | 50.0% |
Average, Positive Trend |
| Morningstar Global Percentile (All Rated Companies) | 71.4% | Good |
| Consensus | 68% |
Low-Risk, Above-Average, Stable Trend, |
(Sources: Morningstar, Reuters’, JustCapital, S&P, FactSet Research)
EPD’s Long-Term Risk Management Is The 206th Best In The Master List (59th Percentile)
For Context
- Dividend Champions: 57th percentile – average
- Monthly Dividend Stocks: 60th percentile – above-average
- Hyper-Growth stocks: 61st percentile – above-average
- Master List average: 62nd percentile -above-average
- Dividend Kings: 63rd percentile -above-average
- Average Blue-Chip Quality Company: 64th percentile – above-average
- Dividend Aristocrats: 67th percentile -above-average
- Enterprise Products: 68th percentile – above-average
- Ultra SWANs: 71st percentile – good
- Foreign Dividend Stocks: 75th percentile – good
- Strong ESG Stocks: 78th percentile – good bordering on very good
EPD’s risk-management consensus is in the top 41% of the world’s highest quality companies and similar to that of such other companies as
- Hormel Foods (HRL) – dividend king
- TC Energy (TRP)
- Magellan Midstream Partners (uses K-1) (MMP)
- Illinois Tool Works (ITW) – dividend king
- Altria (MO) – dividend king
- Royal Bank of Canada (RY)
- Consolidated Edison (ED) – dividend aristocrat
- FedEx (FDX)
- CSX (CSX) – railroad giant
- V.F. Corp (VFC) – dividend king
The bottom line is that all companies have risks, and EPD is above-average at managing theirs.
How We Monitor EPD’s Risk Profile
- 26 analysts
- 3 credit rating agencies
- 6 total risk rating agencies
- 32 experts who collectively know this business better than anyone other than management
- and the bond market for real-time fundamental risk-assessments
When the facts change, I change my mind. What do you do sir?” – John Maynard Keynes
There are no sacred cows at iREIT or Dividend Kings. Wherever the fundamentals lead we always follow. That’s the essence of disciplined financial science, the math for retiring in safety and splendor.
Bottom Line: Enterprise Is The Perfect 7.2% Yielding Blue-Chip For What’s Coming Next
Turn on the TV, or check out YouTube, and you’ll see a lot of people claiming to have crystal balls.
Guess who talks in certainties about Wall Street?
- fools
- charlatans
- people trying to sell you something
- sometimes the same person is all three
Nobody can predict interest rates, the future direction of the economy or the stock market. Dismiss all such forecasts and concentrate on what’s actually happening to the companies in which you’ve invested.” – Peter Lynch
Guess who speaks in terms of probabilities, prudent risk-management, appropriate asset allocations, and attractive margins of safety?
Smart long-term investors who know how the real world works.
These are the people who know how to create safe income streams today, and life-changing wealth over time.
Guess who is running the show at the world’s safest 7.2% yielding blue-chip?
The best management team in midstream.
So I’m not going to lie to you and tell you I know what’s coming next with the economy, interest rates, inflation, or the stock market.
But here’s what I can tell you.
Reasons To Potentially Buy EPD (Even With 2023 Recession Risk Rising)
- 86% quality low-risk 13/13 Ultra SWAN quality midstream
- #1 highest quality midstream you can buy
- very safe 7.2% yield (90% safety score)
- 23-year dividend growth streak (becomes a dividend champion in 2024, the year of the possible recession)
- 14.8% conservatively undervalued (potential good buy) – right on the verge of a strong buy
- Fair Value: $29.88 (9.3X cash flow, very conservative model)
- 7.8X cash flow vs 10 to 12 historical
- anti-bubble blue-chip
- BBB+ stable outlook credit rating = 5% 30-year bankruptcy risk
- risk management consensus 68th industry percentile = Above-Average
- 3% to 6% CAGR margin-of-error growth consensus range
- 4.4% CAGR median growth consensus
- 5-year consensus total return potential: 12% to 18% CAGR
- base-case 5-year consensus return potential: 14% CAGR (over 3X market consensus)
- consensus 12-month total return forecast: 22% (8.5X cash flow, reasonable)
- Fundamentally Justified 12-Month Returns: 24% CAGR
When you stop trying to time the market, you are free to truly build life-changing wealth on Wall Street.
When you stop trying to control the uncontrollable, you free your soul to enjoy life and what truly matters.
When you stop gambling, you can truly start investing.
When you stop praying for luck on Wall Street, you start making your own.
Luck is what happens when preparation meets opportunity.” – Roman philosopher Seneca the younger
When you stop trying to find high-yield in dangerous value traps, you can actually achieve the rich retirement of your dreams.
Fortunes are made by buying right and holding on.” – Tom Phelps, 100 to 1 On Wall Street
When you buy the right companies, at the right prices, at the right times, you can take charge of your financial destiny and retire in safety and splendor.
And for anyone looking for the world’s safest 7.2% yield, the time to buy Enterprise Products Partners is now.
Be the first to comment