3alexd/E+ via Getty Images
During EnLink’s (NYSE:ENLC) 2nd quarter earnings results, they raised their 2022 EBITDA guidance from $1220MM at the midpoint to $1270MM at the midpoint. If achieved, this would represent a 21% growth rate from their 2021 EBITDA of $1050MM, essentially ending three years of stagnation at this level. What’s driving this growth and will it be sustainable? The main driver so far is increased producer activity across their three producing basins, with Permian volumes increasing close to 50% on a YoY basis and Oklahoma and the North Texas Barnett coming in flat relative to 2021 after falling in the previous two years. Their Louisiana segment profit is also relatively flat compared to last year (although volumes were up – more on this below). The recent Crestwood acquisition in the Barnett (North Texas) will add roughly $28MM to the bottom line in the 2nd half of 2022 and $56MM in 2023.
Commodity Prices
From Jan 2019 to May 2021, weekly Henry Hub natural gas traded from roughly $1.50 to $3 per MMbtu (yellow box in figure 1) as supply continued to outstrip demand, but in 2021, the price took off and never looked back (green box in figure 1). August 2022 averaged close to $9. The EIA’s latest STEO (short-term energy outlook) predicts natural gas prices in 2023 will average $5-6 as the US produces an additional 2-3 Bcf/d in 2022 and a similar amount in 2023. In the meantime, producers and midstream companies with exposure to natural gas prices are enjoying the uplift and responded with increased drilling in the gassier regions like the Haynesville and Barnett regions.
Henry Hub Natural Gas Prices (EIA)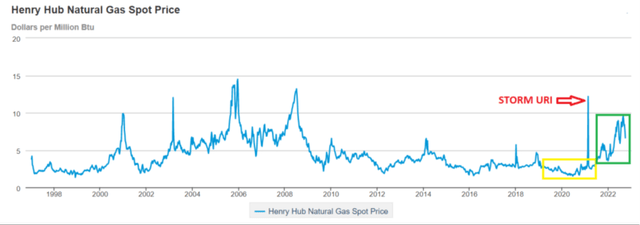
A huge part of what’s driving natural gas prices are the increased liquid natural gas (‘LNG’) export facilities coming online with Venture Global’s Calcasieu Pass being the latest. Natural Gas is still trading in the $6 area despite the temporary loss of the Freeport LNG facility which knocked out roughly 2 Bcf/d in US export capacity on June 8th. It is not expected to return until mid-November (the Covepoint LNG export facility also went down recently for maintenance).
US LNG Feedgas (RBN Energy)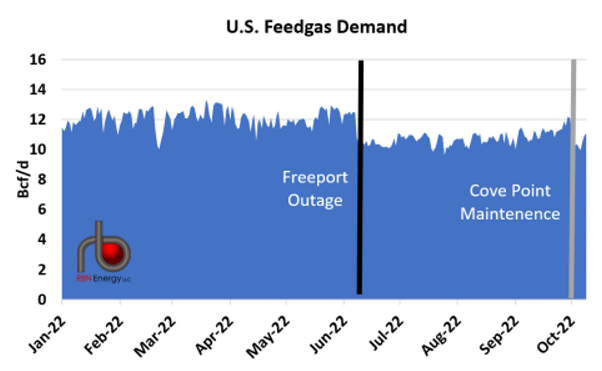
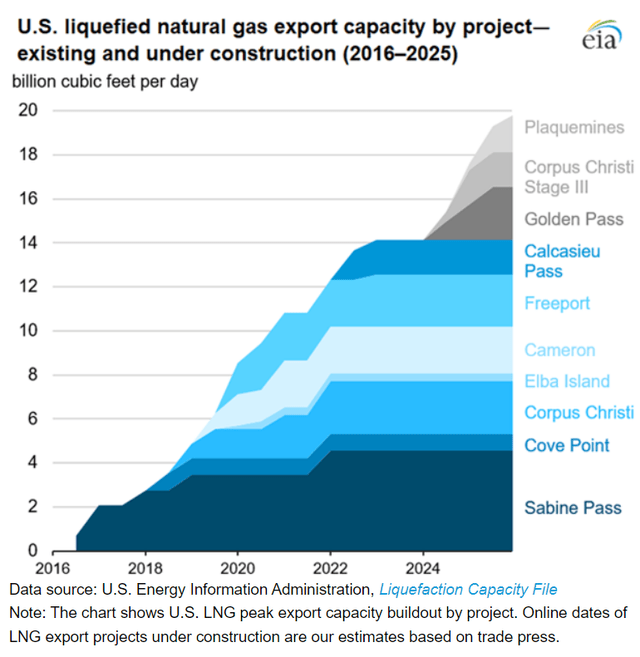
Looking further out, additional export capacity is coming online in the next three years that will continue to drive export capacity to 20 Bcf/d, a 43% rise over today’s capacity, including Freeport’s capacity.
Likewise, natural gas liquids (ethane, propane, butane and natural gasoline) are also selling at a premium not seen since 2012. Mont Belvieu’s liquid composite price rose to $12.48 per MMbtu in June of 2022 from a low of $2.85 in April of 2020 just after COVID hit the US. The composite is currently trading in the $8.90 range.
US Natural Gas Liquid Composite (EIA)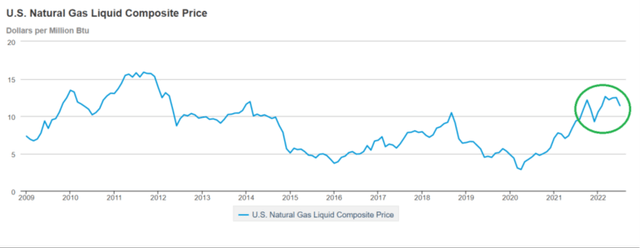
Not to be outdone, WTI oil prices rocketed to $121 per barrel on June 13th before pulling back to the low $80’s area as President Biden released a million barrels a day from our Strategic Petroleum Reserve (‘SPR’) ahead of the mid-term elections and recession fears deflated the premium. The scheduled release from the SPR is anticipated to end in November. Depending on the state of the economy, we might witness a boost in crude prices into 2023 as that support is removed. WTI is currently trading at $90 per barrel bouncing back after OPEC+ announced a 2 million barrel per day cut in production quotas.
Impact Of Commodity Prices On EnLink
The impact to EnLink’s bottom line from rising commodity prices is both direct and indirect. The direct impact is minimal because they have hedged their exposure. In 2022 through Q2, they have realized hedging losses of $46.7MM, blunting the would-be gains. I expect a significant portion of this hedging loss to unwind in the 2nd half with the pullback in NGL and oil prices. This will shield the deterioration in EBITDA due to a pullback in commodity prices in the 2nd half of 2022 and/or the full year 2023 (if that occurs). The strong outlook for 2023 will not degrade unless producer activity falls in tandem and that’s certainly not the base case.
What has truly driven up their EBITDA in the first half of 2022 is an increase of volumes on their Permian basin system driven by higher commodity prices. Versus Q2 of 2021, processing volumes are up 49%, gas gathering volumes are up 46% and crude volumes are up 43% – substantial gains across the board. They are already running above their nameplate gas processing capacity in the Permian, although the 200 MMcf/d Phantom processing plant is due to come online sometime in Q4 and relieve the overburden. If this pace of growth continues, they will need more Permian capacity in late 2023.
EnLink’s Permian Volumes (EnLink’s Quarterly Report)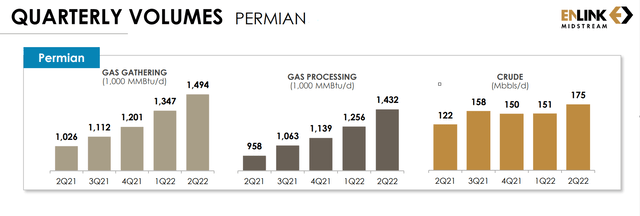
Their Louisiana gas transportation volumes are up significantly, most likely due to the ramp in Calcasieu Pass and growth in the Haynesville Shale region, but I suspect the majority of income derived from this is take-or-pay, so it didn’t show up in any significant way in their YoY numbers. Crude volumes in their Ohio River Valley operations were up 20% over Q2 2021 and NGL fractionation volumes were essentially flat.
EnLink’s Louisiana Volumes (EnLink’s Quarterly Report)
Oklahoma volumes were likewise flat across all three classifications. Volumes are expected to ramp into 2023, rising by 7-9% over 2022 numbers. We should get a larger volume of well connects in the 2nd half of 2022 to support that growth.
EnLink’s Oklahoma Volumes (EnLink’s Quarterly Report)
Activity Returns to the Barnett
The real shocker, although you could see it coming if you studied the numbers, was the flattening of the volumes in North Texas Barnett Shale.
EnLink’s North Texas Volumes (EnLink’s Quarterly Report)
The decline in that basin had been running like clockwork since volumes peaked in 2012 at over 5.5 Bcf/d basin wide. By 2014, EnLink’s share grew to around 3MM MMbtu/d (2.9 Bcf/d) in gathering and 1.15MM MMbtu/d in processing when they combined their Barnett shale assets with Devon’s in 2014. Those volume have since been sliced in half in 8 years. What’s shocking is that volumes are flat in Q2 2022 versus Q2 2021, and EnLink achieved this with organic growth (new drills and re-frack activity), not through acquisition. Note: EnLink’s North Texas volume numbers don’t include the Crestwood acquisition bump because that purchase closed on July 1st.
BKV launches into the re-frack business
The primary reason for the flattening of Barnett volumes for EnLink was BKVs 300 re-fracks in the basin over the past 5 quarters. BKV is the largest producer in the Barnett shale with 518 MMcfe/d produced on EnLink’s system. If you recall, BKV stepped into Devon Energy’s (DVN) Barnett assets when BKV purchased the system in late 2020 for roughly $830MM including contingent payments for higher commodity prices. When you combine BKV’s re-frack activity with the 3-4 rigs in the play adding a modest level of new drills, you’ve got flat volumes over 4 quarters.
How good are BKV’s re-fracks in the Barnett? For roughly $400 to $500MM per well (essentially a third of the cost of an identical new well), they can increase the EUR (estimated ultimate recovery) in a well by 25-30%. Averaging the data on a dozen randomly selected BKV re-fracked Barnett wells, we can produce this chart.
12 BKV Re-frack Barnett Wells (Author with well data from RRC)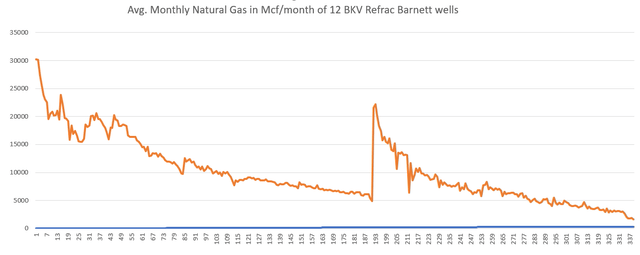
This is the average natural gas output of 12 re-fracked wells over 214 months of data. The horizontal axis is measured in months and the vertical axis lists the average throughput of natural gas (Mcf/month). The data is aligned across all 12 wells so all re-fracks occurred at the same point in time. Because the age of each well is different, the front of the chart is a bit choppy. On month 1, we averaged 4 wells and by month 14, we’ve averaged 6 wells. In month 85, we’ve got all 12 averaged into the data and you can see the line smooths out. Since these are recent re-fracks, I used additional well data to complete the long tail to 337 months. The total average EUR for the 12 wells is 3.4 Bcf per well. Of that, 25% or 0.846 Bcf per well is the natural gas uplift due to refracturing. These are very strong economics with quick paybacks, especially when natural gas is trading at $6-9/MMbtu.
These 12 wells were originally completed in 2004 through 2011 when the practice of fracturing wells was relatively new. In the early days, the fracture stages were smaller and more spaced out and this practice left a lot of untouched rock. As you can see in the chart, re-fracked natural gas wells come online immediately, and the average uplift of our 12 wells is 4x the volume being produced prior to re-fracturing. Because a newly re-fracked well is exposing untouched rock, the decline rates from the peak is fast, like a new well, but not quite as fast. Think of a re-fracked well as part new well and part old well. It takes time for the decline rate to settle out again.
A typical refracture candidate is a well that was sub-optimally fracked, and the producer goes back at a later point in time and adds bigger and more frequent frack stages. BKV is even adding fracture stages in the heel of the well, where it bends from a vertical position to a horizontal position – a common practice in modern shale completions.
In addition to the 300 re-frack completions, BKV has 1200 additional re-frack candidates. The 231 refracs they completed in 2021 were enough to keep BKV’s volumes flat for 2021. This year, they plan to complete an estimated 175-200 re-fracks and drill 12 additional wells in the 2nd half. That should be enough to keep their volumes healthy in 2022.
Back in 2015, Devon re-fracked 4 wells for between $0.90MM to $1MM each (double what BKV is paying now). Because these are older re-fracks, we have 7 years of data to show how these wells progressed. Again, we see similar results on a larger scale because these were highly successful wells. The 4 wells will each produce on average 5 Bcf of natural gas over their lifetime with 29% of that due to the re-fracks or about 1.45 Bcf extra per well.
Devon’s re-fracks (Author with data from the RRC)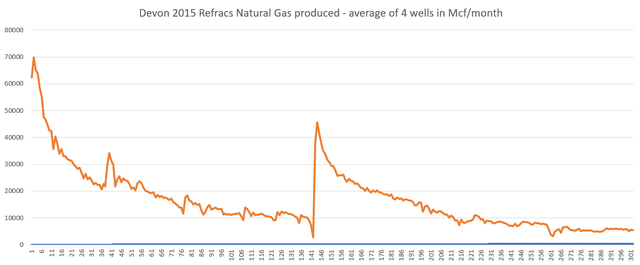
Long Term prospects for the Barnett
What is the long-term prospect of the Barnett Shale and what can it tells us about the longevity of shale in general? Although the Barnett Shale region will see a rebirth of sorts, the long-term prospect of the shale play is questionable. In addition to the 1200 re-frack candidates, BKV has another 300 long lateral drilling locations of which they will drill 12 new wells in the back half of 2022. This is enough inventory to keep their production flat for another 12 years, but this doesn’t guarantee that the entire basin will level off for the next 12 years. The weakness in the basin is due to the economics of the remaining inventory. Although some producers like BKV have low cost, high producing inventory, much of the remaining inventory rests in locations where you need sustained natural gas prices above $9/MMbtu and even if we could sustain those prices, there is plenty of drilling in other basins like the Haynesville or the Anadarko with break-evens below $3.
The following two charts from BTU Analytics show the limitations of new drilling in the basin.
Barnett Inventory and Breakeven Drilling Locations (BTU Analytics)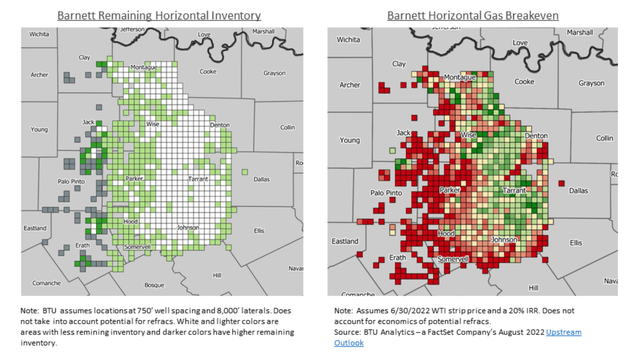
BTU Analytics explains it this way:
“The map above (left) shows remaining drilling locations with white boxes being the areas with the fewest locations and dark green boxes being the areas with the most. In the other map above (right), dark green grids indicate breakeven economics below $4/MMBtu and dark red boxes indicate breakeven prices of at least $9/MMBtu based on a 20% IRR. By pairing the map of remaining locations with a breakeven map, BTU is able to estimate remaining new drilling locations by breakeven. Wells at the border of Wise and Denton counties, as well as in Tarrant and Johnson counties, have the lowest breakeven prices, but the acreage has been largely drilled out. While significant undrilled locations remain in other counties, such as Parker, Hood, and Somervell, gas prices would need to increase in order for them to be considered economic.”
One way for EnLink to stave off the decline in the basin is with acquisitions like the Crestwood system purchase that closed on July 1st of this year which will add roughly 200 MMcf/d of natural gas to their system for $275MM. They assigned $50MM to surplus compression equipment and 3 gas processing plants that could be relocated (saving future CAPEX expenses), thus giving that purchase a 4x EBITDA multiple based on 2023 numbers. The asset will produce roughly $56MM in cash flow in 2023. That purchase, along with producer activity, will turn back the clock on EnLink’s North Texas system by 5 years. Their segment profit for the entire basin for 2023 will equal earnings in 2018 (net of their minimum volume commitments in 2018 – MVCs).
I suspect there aren’t too many of those acquisition left, and although EnLink may get a multi-year reprieve from declining volumes in the basin, the downward trend in the basin will eventually resume, chipping off 4-6% per year in segment profit. Fortunately for EnLink, the Permian has 30 years of runway (for natural gas and NGLs) and their Oklahoma assets have roughly 15-20 years. For 2023, assuming commodity prices and EnLink’s CAPEX spend stays robust (this is the base case), we should see EnLink’s EBITDA grow to $1,350-1400MM area – a new record. If we get a significant pullback in producer activity in some of the basins (similar to what we saw in 2019 in the STACK region), then we should expect a relatively flat YoY EBITDA in 2023.
Conclusion
In summary, I think EnLink will produce a record year of EBITDA in the $1270MM range (at the midpoint of the guidance), a 21% growth over 2021 numbers. Strong commodity prices are driving a recovery in producer activity which is slowing the long-term decline in their North Texas assets and reversing them in their Oklahoma assets. Their Permian assets are growing on both sides of the basin – Delaware and Midland. Growth in terms of volume have reached 50% YoY which is far outpacing the growth across the entire basin. Their assets are in the cores of the basin where activity is strongest. Acquisitions continue to help support growth and stave off declines. The Crestwood acquisition for $275MM in the Barnett reverses a 5-year decline in segment profit in that basin.


Be the first to comment