

bodnarchuk/iStock via Getty Images
Introduction
The London-based Endeavour Mining plc (TSX: EDV, LSE: EDV, OTCQX: EDVMF) is one of the largest gold producers in West Africa, with six operating assets across Senegal, Cote d’Ivoire, and Burkina Faso and a strong portfolio of advanced development projects and exploration assets in the Birimian Greenstone Belt across West Africa.
Important note: This article is an update of my article published on March 22, 2022. I have been following EDVMF on Seeking Alpha since 2021.
1 – 1Q22 Results Snapshot
On May 5, 2022, Endeavour Mining announced that gold production for the first quarter of 2022 was 367K ounces. Production from continuing operations was 353K ounces.
Revenue for the quarter came in at $686.20 million, up from $601 million last year.
Endeavour Mining is well-positioned to achieve its 2022 guidance production and AISC for continuing operations of 1,315-1,400K Oz at an AISC of $880-930 per ounce.
CEO Sebastien De Montessus said in the conference call:
In a nutshell, we had a strong operating performance this quarter with production of 357,000 ounces at a very low all-in sustaining costs of $848 per ounce from our continuing operations. This performance has resulted in robust cash flow generation during the quarter, which in line with our capital allocation framework, we used to further strengthen our balance sheet to continue our attractive shareholder returns program and to reinvest back into our business.
EDVMF 1Q22 highlights Presentation (Endeavour Mining)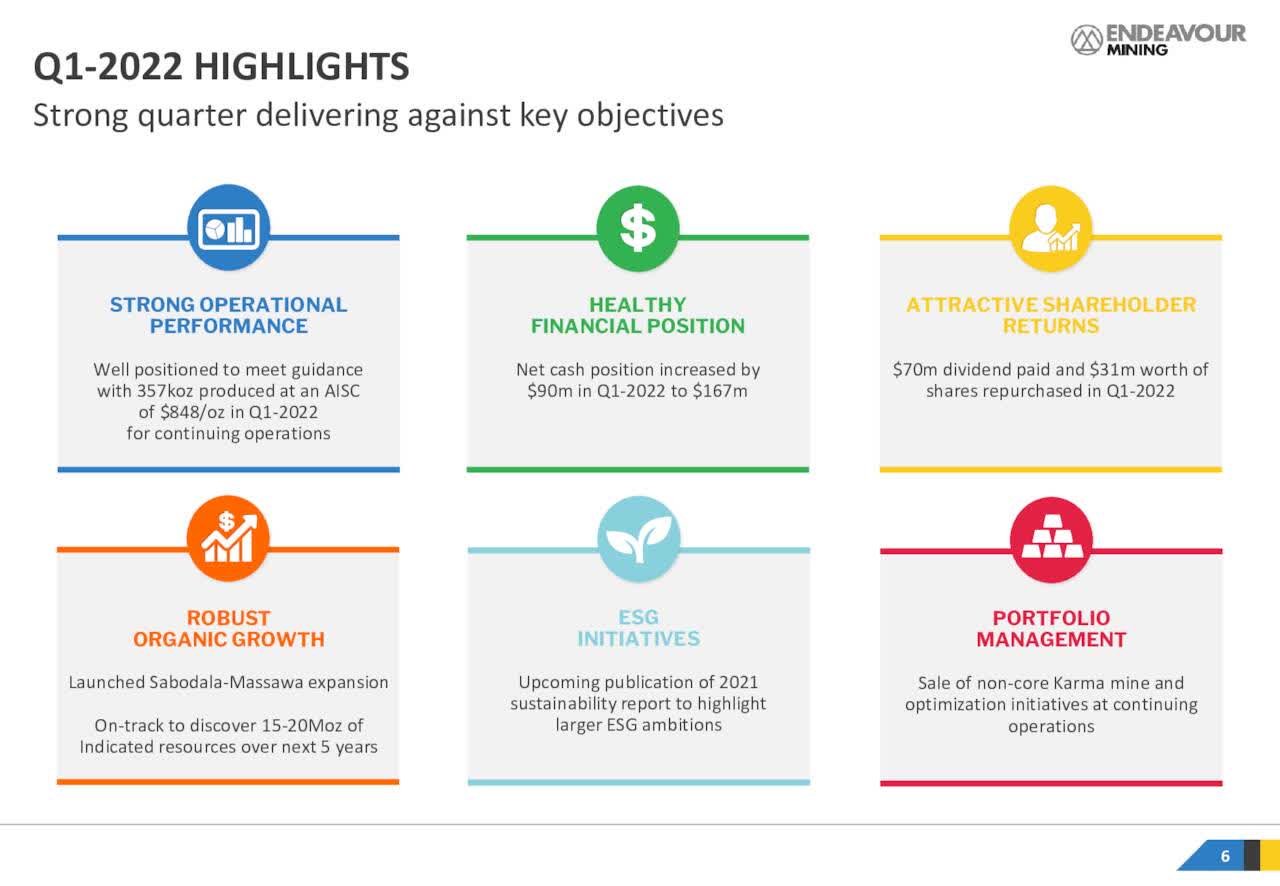
2 – Investment Thesis
The investment thesis is not changing much here. Endeavour Mining shows an excellent financial profile and is friendly toward its shareholders with a good dividend and shares buyback policy. Moreover, the company has significant cash of over $1 billion.
However, we should not discount the risk of doing business in West Africa even though the African assets are well diversified, which helps mitigate some risks.
EDVMF Assets portfolio Presentation (Endeavour Mining)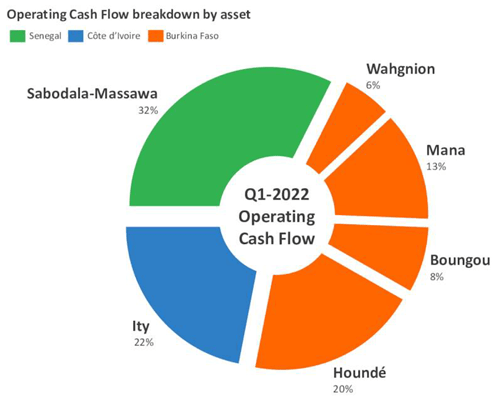
The gold mining sector has been struggling recently due to a risk of recession triggered by rampant inflation.
Despite a gold price holding well above $1,800 per ounce, most of the gold miners I follow dropped significantly.
It is puzzling because this selloff is not reflecting the industry’s intrinsic value, and I see that divergence as an excellent opportunity for the long term.
The best way to mitigate such particular cases is to trade short-term LIFO about 30%-40% of your total position and use your short-term gain to increase your core long-term position for a much higher target when the market decides to be willing to pay for the accurate valuation.
3 – Stock Performance
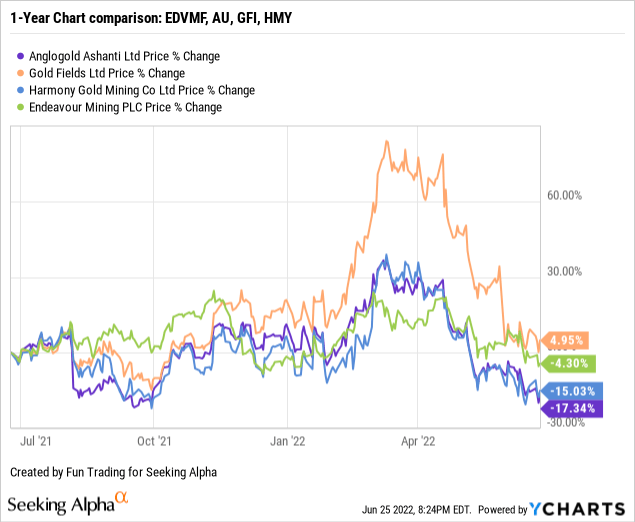
EDVMF performed reasonably well on a one-year basis compared to a few of its peers and is down 4%.
CEO Sebastien de Montessus said in the conference call:
You can see that the strong cash flow we are generating is coming from a well-balanced portfolio of 6 mines across 3 West African countries. Furthermore, we see further potential to diversify our production by completing the brownfield expansion at Sabodala-Massawa and over time by pursuing our greenfield project pipeline.
Endeavour Mining – 1Q22 Balance Sheet And Trend – The Raw Numbers
| Endeavour Mining | 1Q21 | 2Q21 | 3Q21 | 4Q21 | 1Q22 |
| Total Revenues in $ Million | 635.79 | 753.43 | 691.71 | 697.17 | 686.20 |
| Net Income in $ Million | 89.57 | 126.78 | 113.59 | -106.36 | -42.20 |
| EBITDA $ Million | 332.41 | 359.90 | 341.85 | 85.27 | 215.40 |
| EPS diluted in $/share | 0.43 | 0.50 | 0.45 | -0.48 | -0.17 |
| Operating Cash flow in $ Million | 197.94 | 300.48 | 311.91 | 355.78 | 304.30 |
| Capital Expenditure in $ Million | 113.70 | 144.04 | 132.47 | 132.30 | 85.20 |
| Free Cash Flow in $ Million | 84.24 | 156.44 | 179.44 | 223.49 | 219.10 |
| Total Cash $ Million | 868.20 | 832.88 | 760.37 | 906.20 | 1,054.30 |
| Total Long-term Debt in $ Million | 1,044.81 | 929.76 | 850.43 | 841.90 | 916.80 |
| Shares outstanding (diluted) in Million | 209.21 | 253.43 | 252.13 | 251.82 | 249.64 |
| Production Au Oz | 1Q21 | 2Q21 | 3Q21 | 4Q21 | 1Q22 |
| Total Production Gold | 346.8 | 409.0 | 382.2 | 398.0 | 367.0* |
| AISC (co-product) from continuing operations | 868 | 853 | 904 | 900 | 848 |
| Gold Price realized | 1,749 | 1,791 | 1,763 | 1,787 | 1,911 |
Source: Company release. Fun Trading files.
* Including Karma mine, divested on March 10, 2022. The company said in the press release:
On 10 March 2022, Endeavour closed the sale of its 90% interest in its non-core Karma mine in Burkina Faso to Néré Mining SA, for consideration of up to $25.0 million plus a 2.5% Net Smelter Return royalty, applicable on production in excess of approximately 160koz of recovered gold from 1 January 2022.
Analysis: Revenues, Free Cash Flow, Debt, And Gold Production
1 – Quarterly Revenues for the First Quarter of 2022
EDVMF quarterly Revenues history (Fun Trading) Revenues reached were $686.20 million in the first quarter of 2022, up 14.2% from a year ago and down 1.6% sequentially. The adjusted net earnings were up $22 million over 1Q21 to $122 million. The net loss attributable to shareholders was $42.2 million or $0.17 per diluted share in 1Q22 compared to a net income of $73.10 million or $0.35 per diluted share in 1Q21.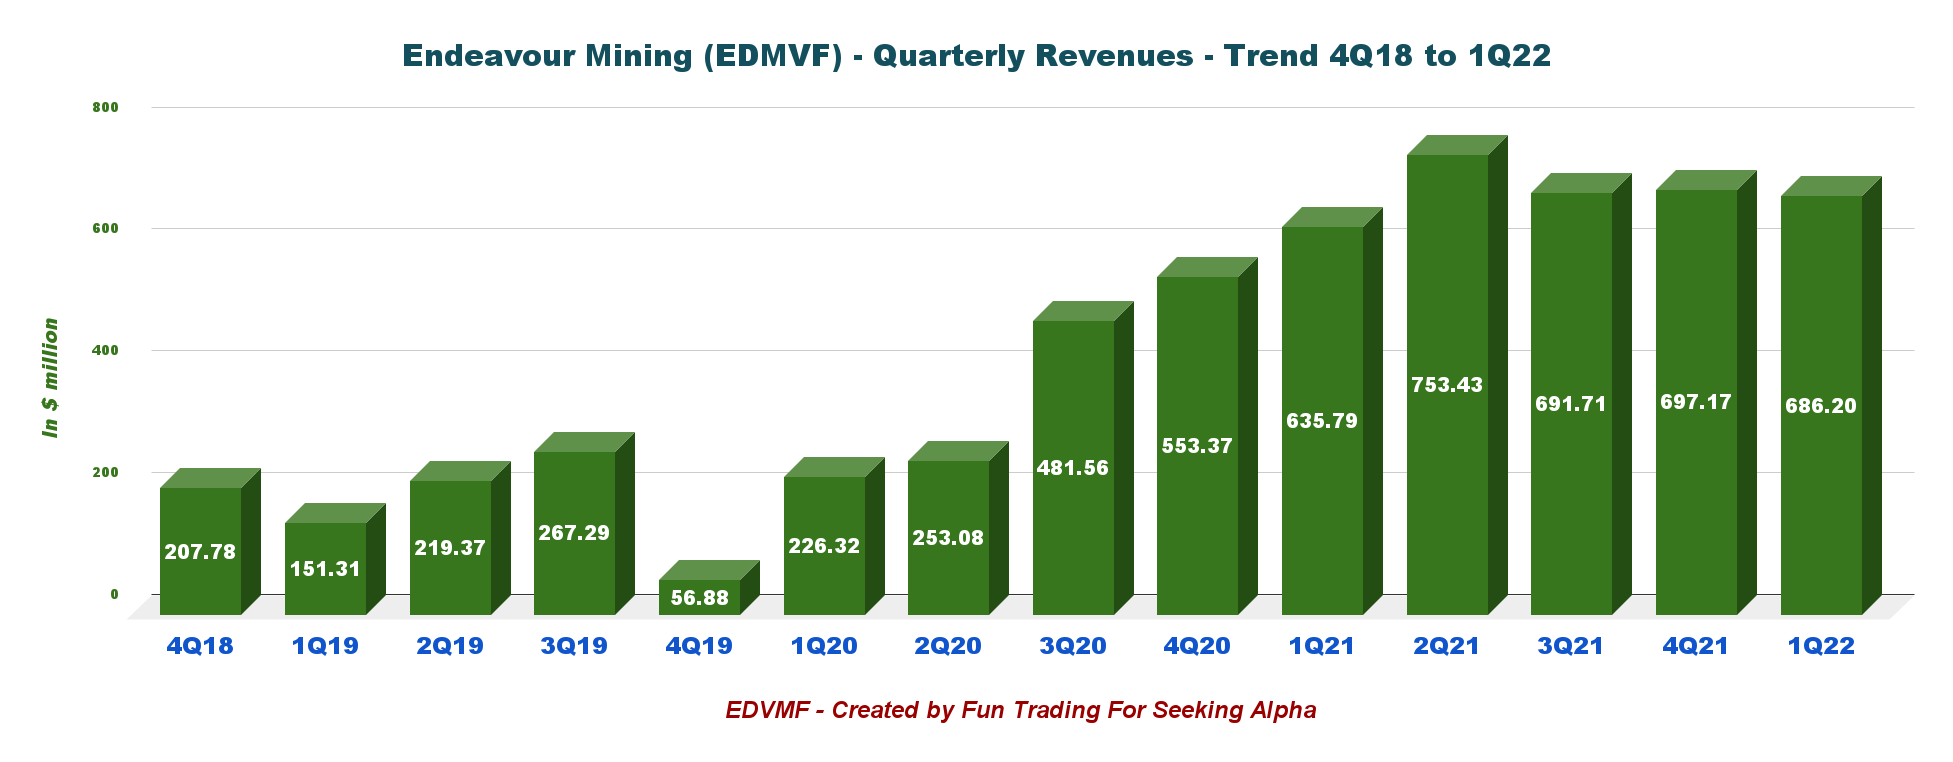
2 – Quarterly Free Cash Flow History
EDVMF Quarterly Free cash flow history (Fun Trading)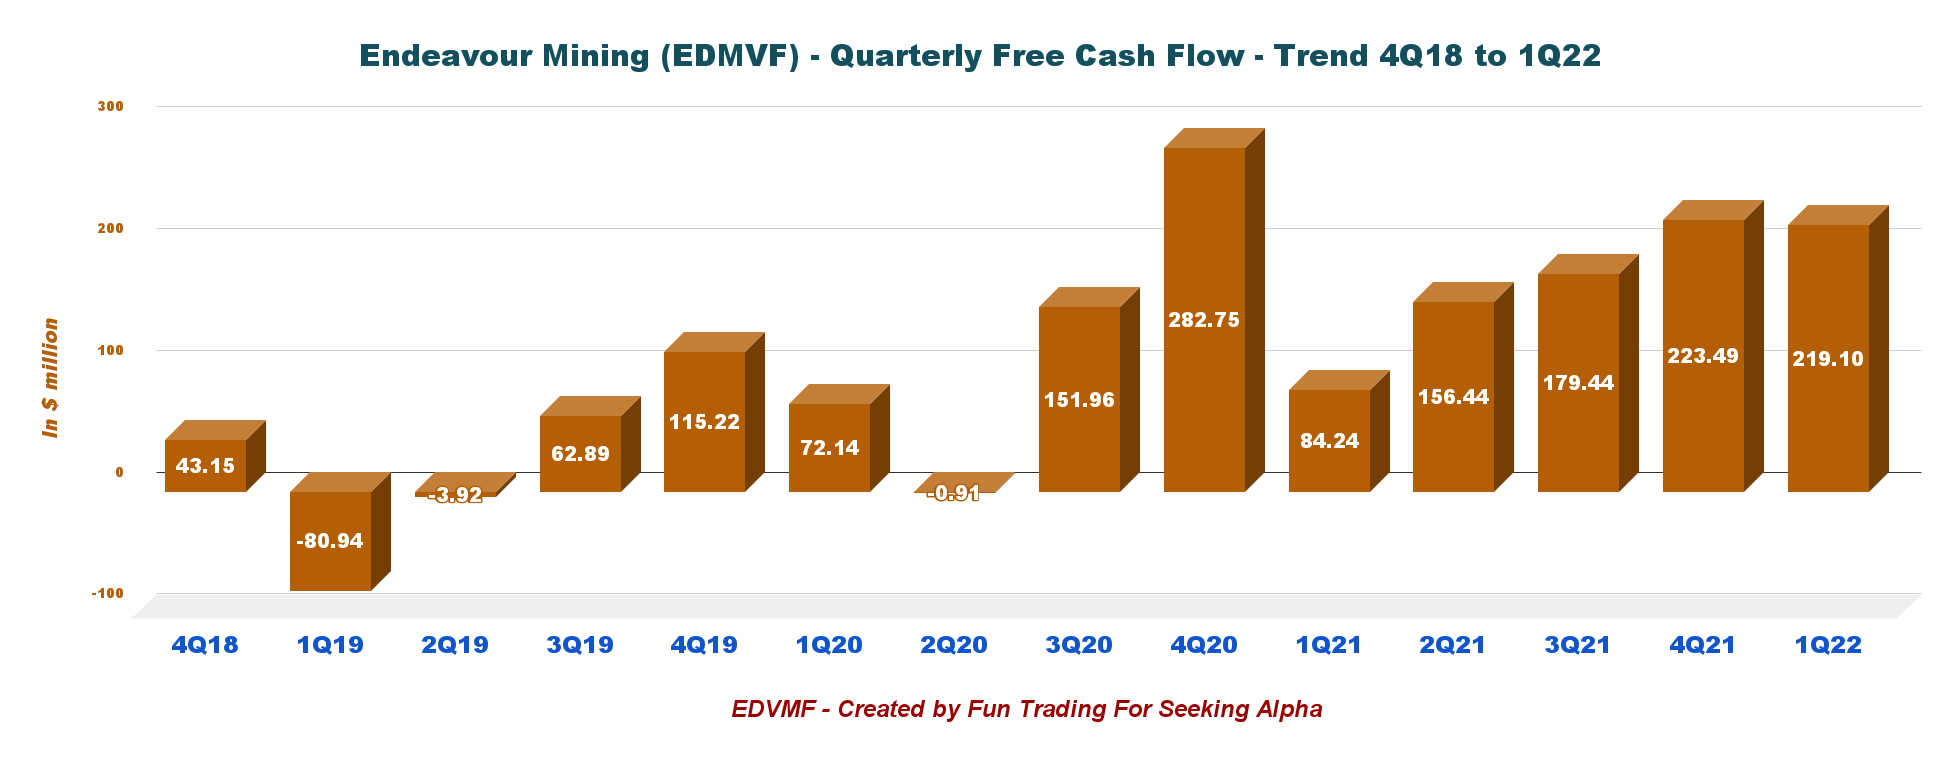
The company’s free cash flow for the first quarter was $219.10 million, and the trailing 12-month free cash flow was $778.47 million.
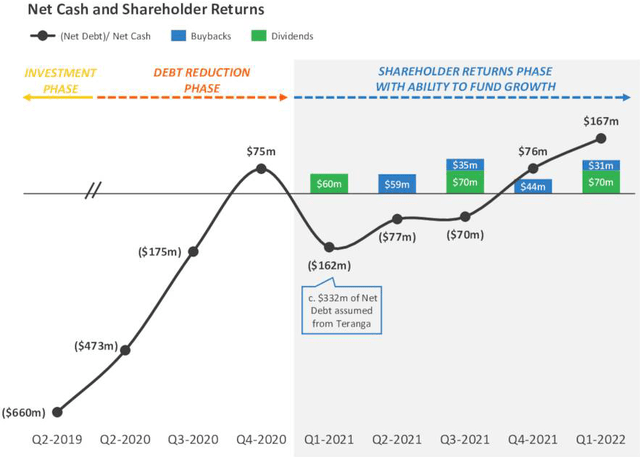
In 2021, Endeavour implemented a shareholder return programmed with a dividend of $150 million for 2022. It is a minimum dividend that could be supplemented with additional dividends and buyback assuming gold price remains above $1,500 per ounce and net leverage debt to adjusted EBITDA remains below 0.5x.
EDVMF Shareholders return (Endeavour Mining Presentation)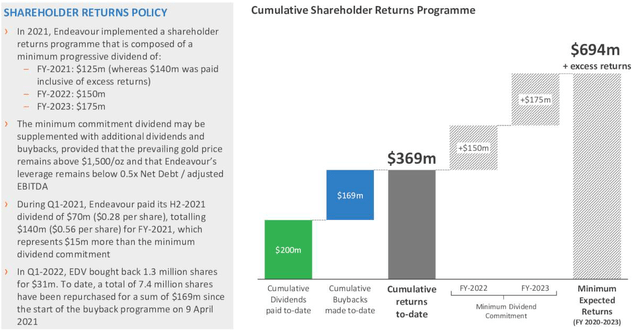
3 – Debt Situation in 1Q22. No net debt and total Cash of $1,054 million.
EDVMF Cash versus Debt history (Fun Trading) Cash and cash equivalent and investment were $1,054.30 million, and the debt (including current) was $916.8 million at the end of March 2022. The company continues to be net debt-free or net cash. EDVMF Balance sheet history (Endeavour Mining Presentation)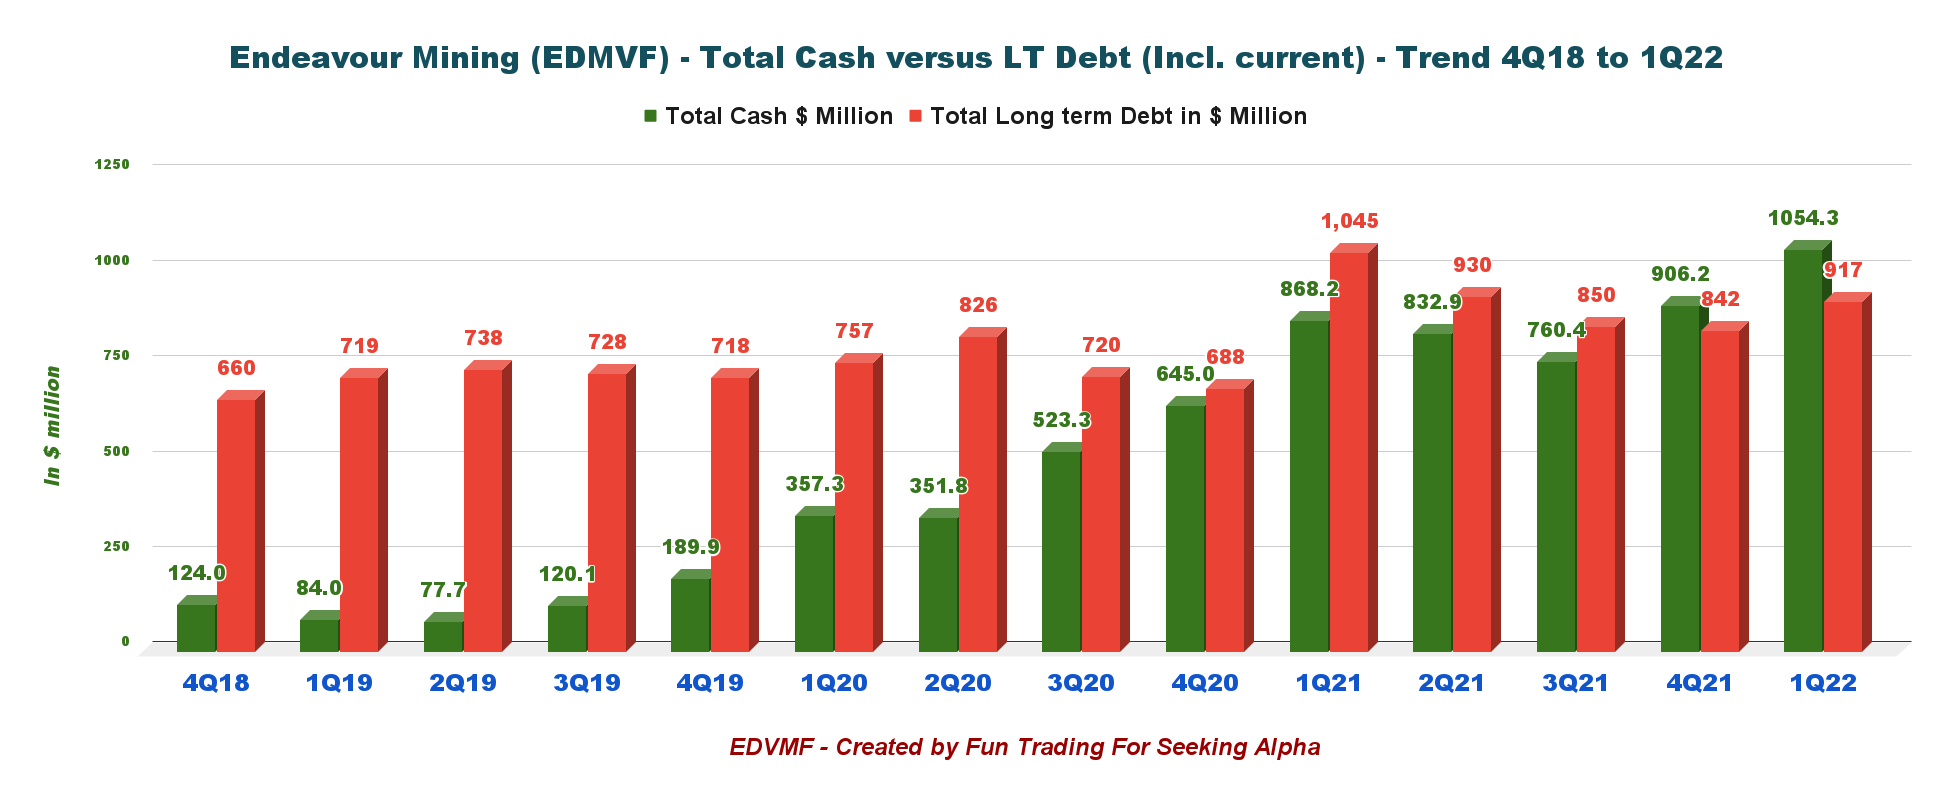
3 – Quarterly Gold Production Analysis
3.1 – Gold Production
EDVMF Quarterly gold production history (Fun Trading)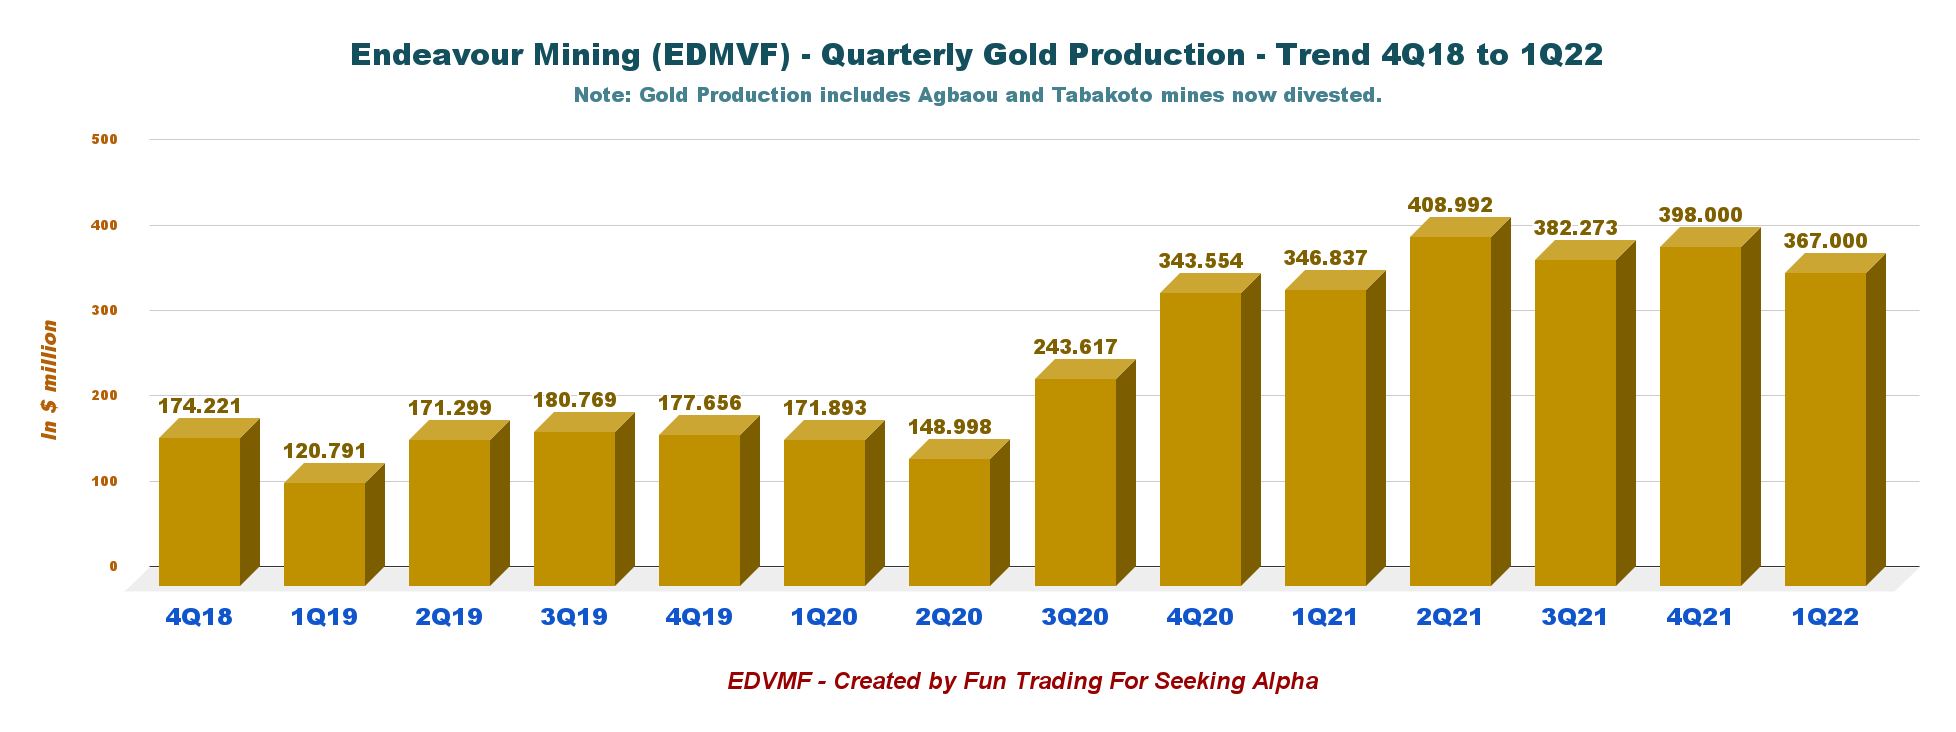
1Q22 gold production from continuing operations was 357k ounces, an increase of 44koz or 14% over 1Q21, but a decrease of 5% QoQ mainly due to lower production at Sabodala-Massawa and Wahgnion. Total production, including Karma mine, was 367K ounces.
The strong production was due to solid performances at Houndé, Ity, and a full quarter of production from the Sabodala-Massawa and Wahgnion mines that were incorporated after acquiring Teranga on 10 February 2021.
3.2 – Gold production per mine. Comparison between 1Q21 and 1Q22
EDVMF Production comparison 1Q21 versus 1Q22 per mine (Fun Trading) Note: Karma mine was sold in March 2022.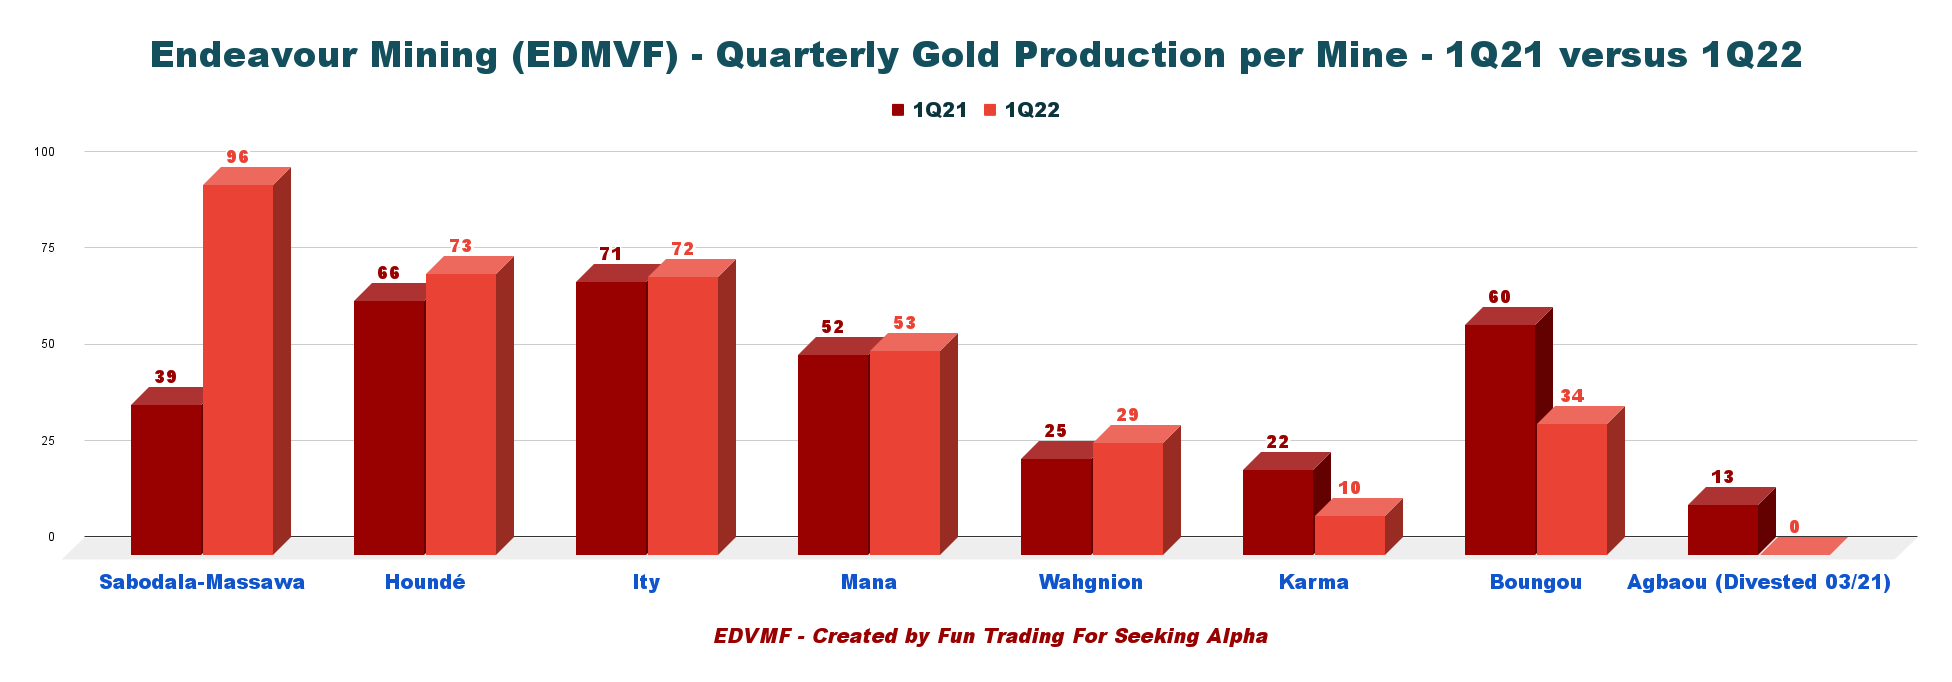
3.3 – Quarterly Gold price realized and AISC
AISC for all operations decreased slightly this quarter to $848 per ounce, which is still excellent, especially considering the increase in inflationary pressures.
EDVMF Quarterly gold price and AISC history (Fun Trading)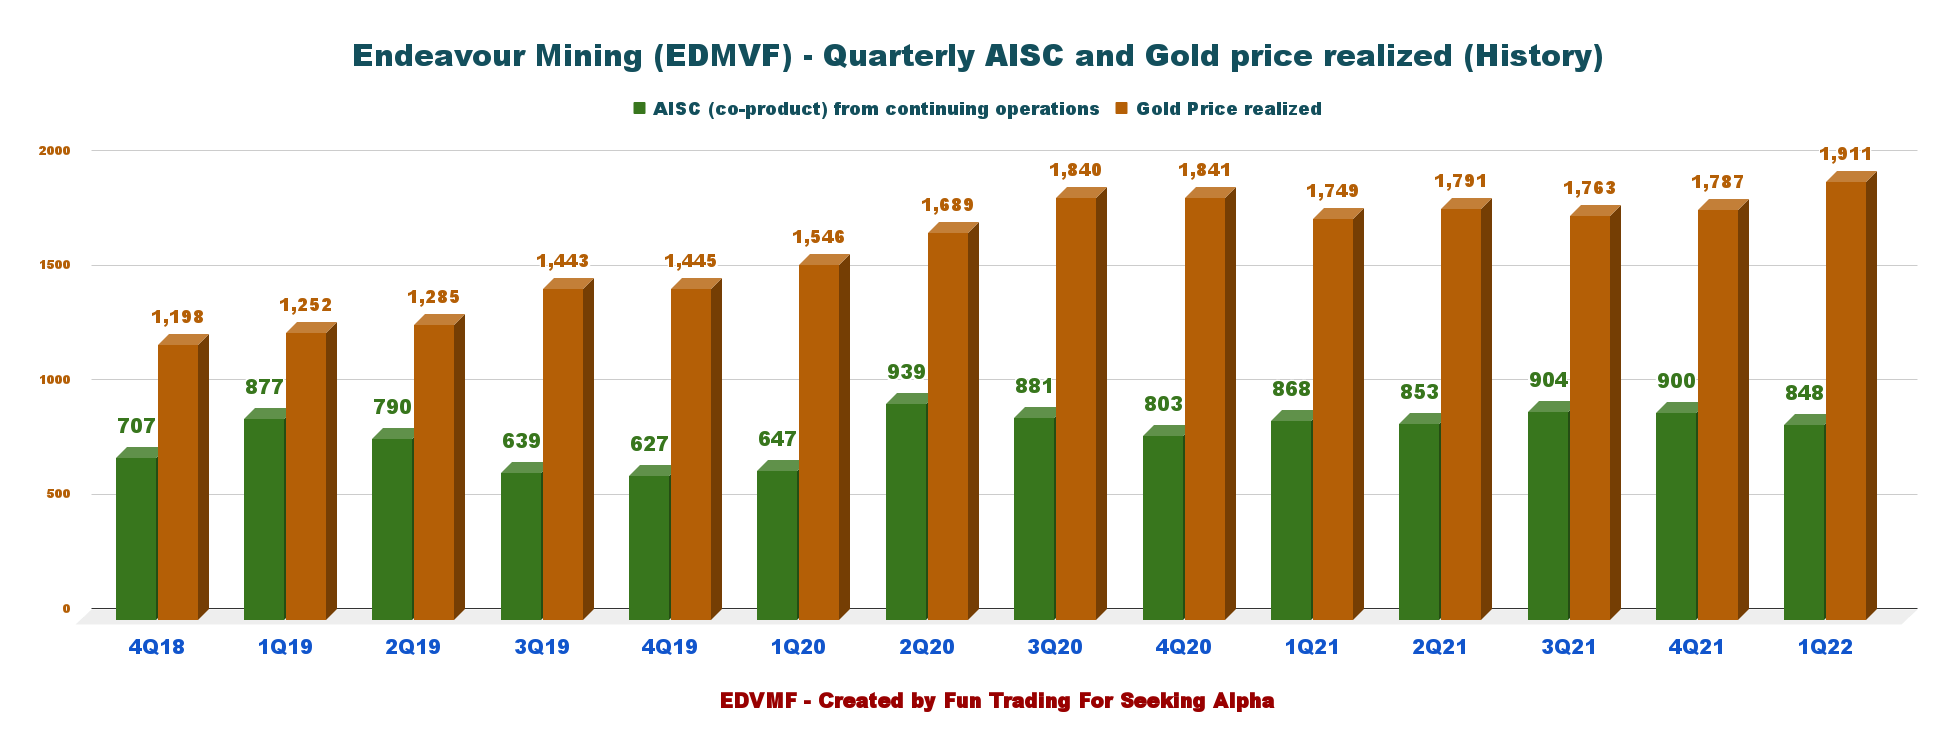
4 – 2022 Guidance
2022 production is expected to be 1,315K-1,400K oz at an AISC of $880-930/oz.
EDVMF 2022 Guidance Presentation (Endeavour Mining)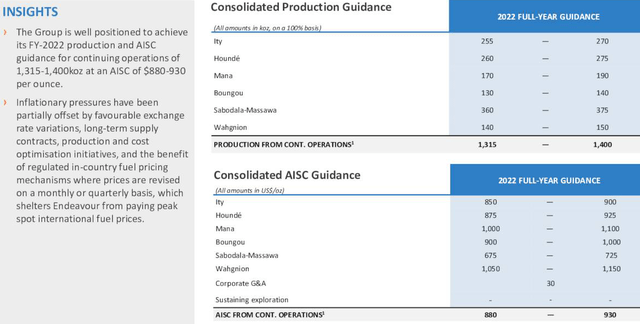
As indicated in my preceding article, sustaining and non-sustaining CapEx is expected to decline by about $40 million in 2022 compared to 2021. Sustaining CapEx for 2022 will be $169 million, compared to a CapEx of $167 million in 2021.
Non-sustaining capital for 2022 is expected to be $163 million, compared to $214 million in 2021.
EDVMF 2022 Guidance 2 Presentation (Endeavour Mining)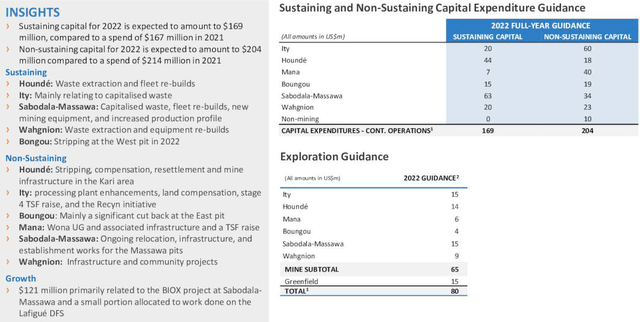
5 – Key Growth Projects
EDVMF Key Growth Projects Presentation (Endeavour Mining)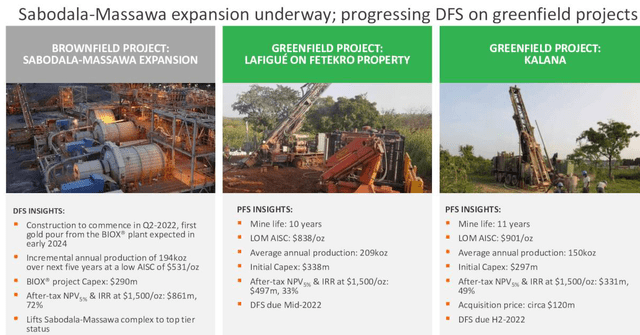
The main project underway is the Sabodala-Massawa project, with an expansion phase to commence in 2Q22 and the first gold pours forecasted in early 2024. Annual production will be 194K Oz over the next five years, with AISC at $531 per ounce.
The two other projects are long-term greenfields.
Commentary And Technical Analysis
EDVMF TA Chart short-term (Fun Trading)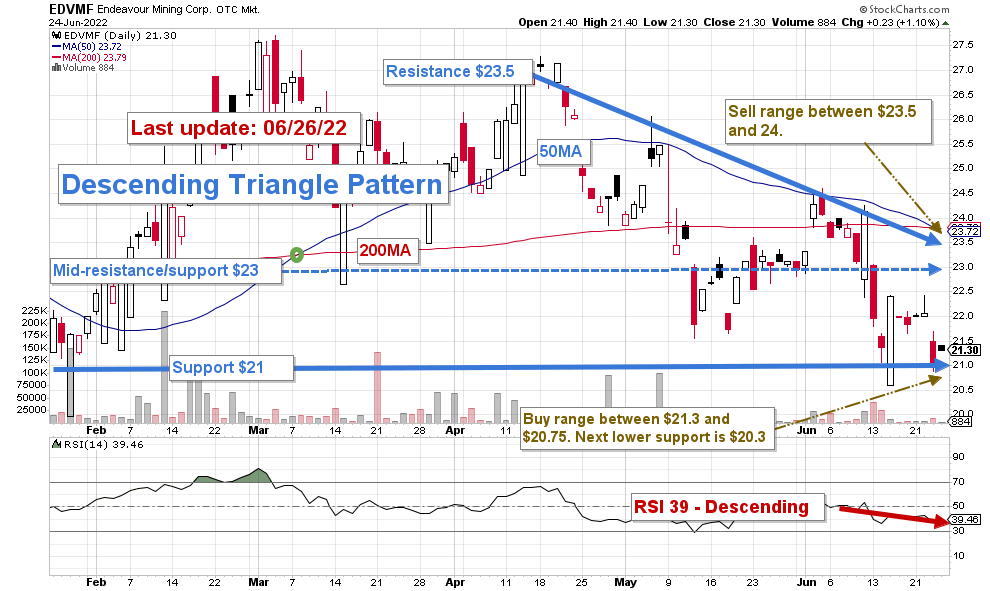
The trading strategy is to gradually sell about 30%-40% of your EDVMF position between $23.5 and $24 and accumulate between $21.3 and $20.8. The best-adapted approach is to sell short-term LIFO while keeping a core long-term position for a much higher final target.
The risk of recession is a crucial concern for shareholders due to the Russian invasion of Ukraine and untamed inflation that may lead to a difficult period of stagflation. The gold price has been incredibly resilient and has traded above $1,800 per ounce for quite a while despite the recent FED’s 75-point hike. However, the gold miners, on the other hand, have dropped significantly in connection with the general market.
EDVMF could cross the support and retest $20.3 or lower if it happens.
Watch the gold price like a hawk.
Note: The LIFO method is prohibited under International Financial Reporting Standards (IFRS), though it is permitted in the United States by Generally Accepted Accounting Principles (GAAP). Therefore, only US traders can apply this method. Those who cannot trade LIFO can use an alternative by setting two different accounts for the same stock, one for the long-term and one for short-term trading.
Warning: The TA chart must be updated frequently to be relevant. It is what I am doing in my stock tracker. The chart above has a possible validity of about a week. Remember, the TA chart is a tool only to help you adopt the right strategy. It is not a way to foresee the future. No one and nothing can.
Author’s note: If you find value in this article and would like to encourage such continued efforts, please click the “Like” button below to vote for support. Thanks.
Be the first to comment