

kentoh
By Seth Hickle and James Humphries
Volatility can sometimes be misunderstood as something to avoid, however, understanding volatility strategies can be useful in many trading environments. To quantify this, we look to the Cboe Volatility Index® (the VIX® index), which is a calculation designed to estimate the 30-day expected volatility of the U.S. stock market by aggregating the weighted prices of S&P 500 Index (SPX) call and put options over a wide range of strike prices. In most scenarios, the VIX Index is inversely correlated with the S&P 500 Index, meaning investors typically observe the VIX Index rising when the S&P 500 Index declines.
Unexpected changes in volatility can significantly impact investors, especially those with a short-term time horizon or low risk tolerance, causing them to reassess their investment goals and access to assets. An individual’s risk tolerance can also be influenced by plain human emotion with some investors experiencing anxiety from swings in their portfolio value. However, as investment managers, we view volatility differently. From our perspective, it’s an opportunity to enhance risk-adjusted returns or generate income.
As an asset class, equities have a market-risk profile and volatility is normal. Notably, the VIX Index’s average measure has been around 19.50 since 1990. Consider this chart from Strategas Research Partners:
- Blue bars represent the full calendar year returns of the S&P 500 Index.
- Red dots represent each year’s maximum intra year drawdown. Drawdowns, and thus volatility, are normal when invested in equity markets.
Strategas Research Partners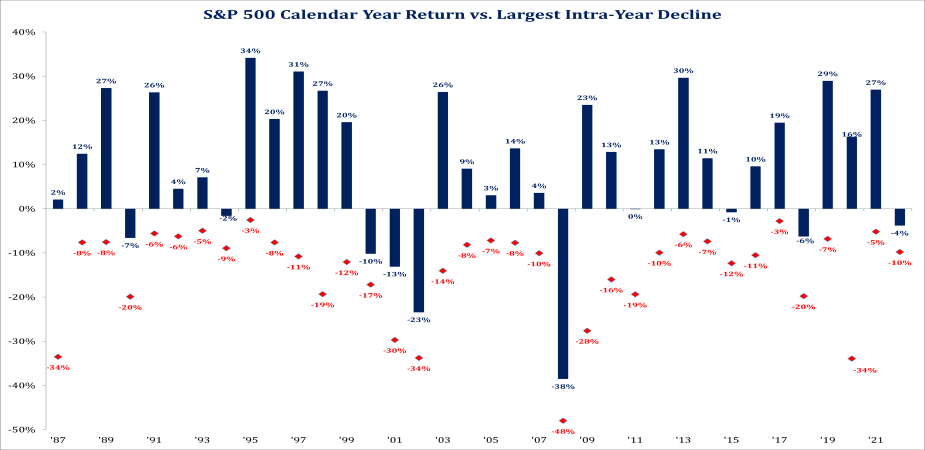
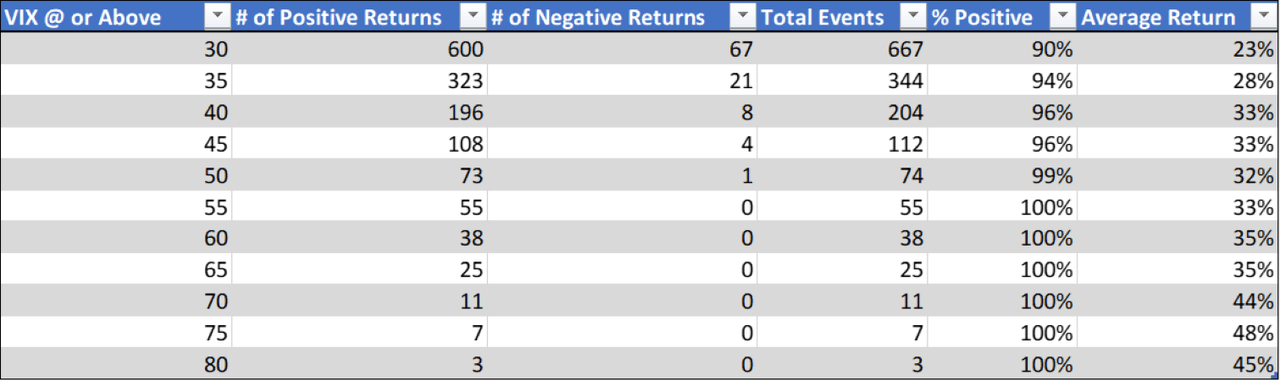
To investigate this further, we conducted a historical analysis of the VIX and S&P 500 indices. Our analysis illustrates what happened to forward S&P 500 returns after a rise in volatility, as measured by the VIX Index at various levels between 1990 and 2021. The analysis considered VIX Index levels above 30, 35, 40, 45 and 50, and the subsequent one-year forward returns of the S&P 500 Index for each day the VIX Index was at or above those levels.
Looking at the S&P 500 Index one-year forward returns, we found:
- When the VIX Index closed above 30, the S&P 500 subsequent return was 23% on average.
- When the VIX Index closed above 35, the S&P 500 subsequent return was 28% on average.
- When the VIX Index closed above 40, the S&P 500 subsequent return was 33% on average.
Each time, the market confidence interval was greater than 90%, as illustrated in the chart below.
FactSet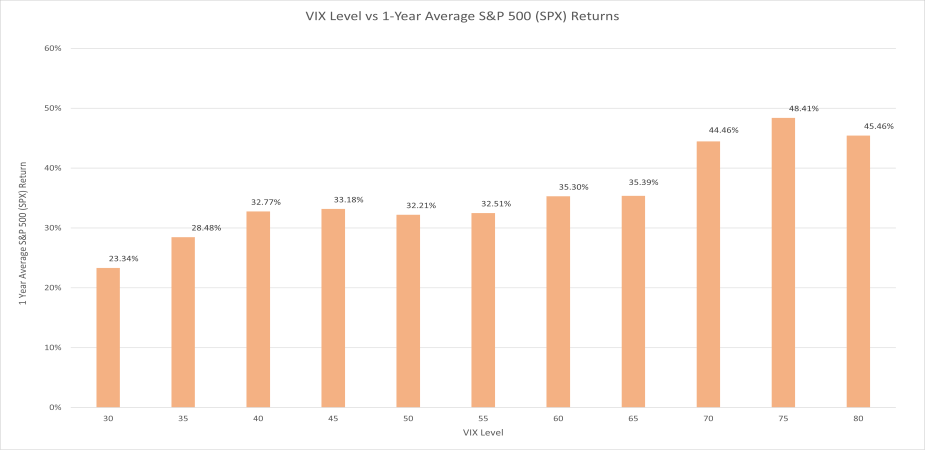
LPL Financial conducted a similar study highlighting the S&P 500 Index returns during various timeframes after the VIX Index rose above 30 and remained at a level above 30 for at least 10 days. The study then calculated subsequent market returns after the streak ended. The results aligned with our observations; the S&P 500 Index subsequent one year return was 21.9% on average, with a confidence interval greater than 90%.
LPL Financial Research, FactSet 03/15/2022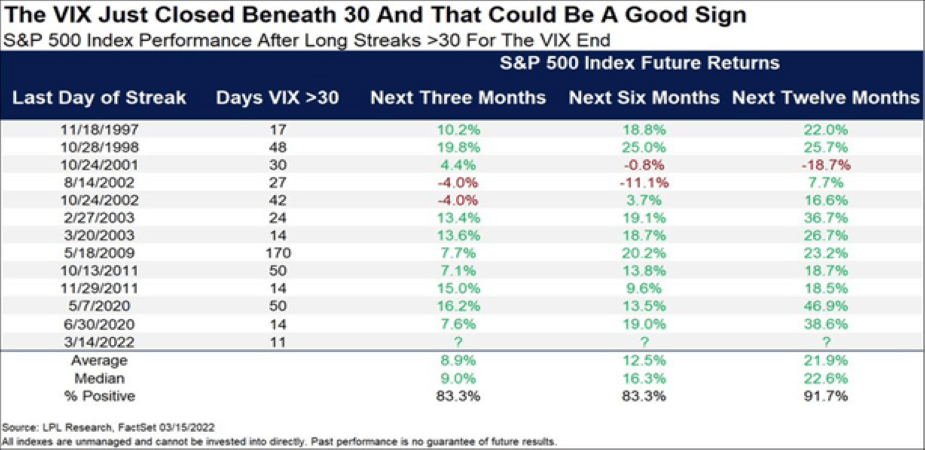
Harnessing Volatility
Historically, market participants purchasing protection against downside price movements are willing to pay a premium to compensate counterparties for the protection they provide. Investor risk aversion and a tendency to overestimate volatility in the market drive higher demand and therefore, a higher price of this protection, or insurance. This means, in theory, an option buyer is willing to pay more than they should for the protection they are purchasing.
The question remains: how can investors and investment managers harness volatility? In our experience, opportunities to harness volatility are available through capturing the Volatility Risk Premium (VRP). The VRP is calculated as the difference between the expected 30-day volatility, or implied volatility, minus the subsequent 30-day realized volatility.
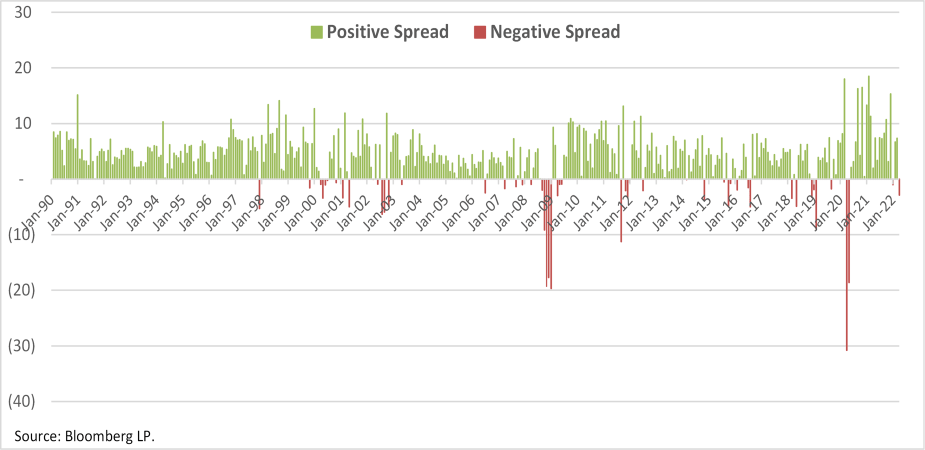
Historically, we observed the VRP on the S&P 500 Index, as measured by the VIX Index minus the subsequent 30-day realized volatility on the S&P 500 Index, generated positive returns most of the time. Over the last 31 years, the referenced VRP on the S&P 500 Index was positive in 336 out of 387 measured occurrences, or 86.8% of the time. The charts below illustrate the historical performance of the VRP on the S&P 500 since the inception of the VIX Index through March 2022.
Bloomberg LP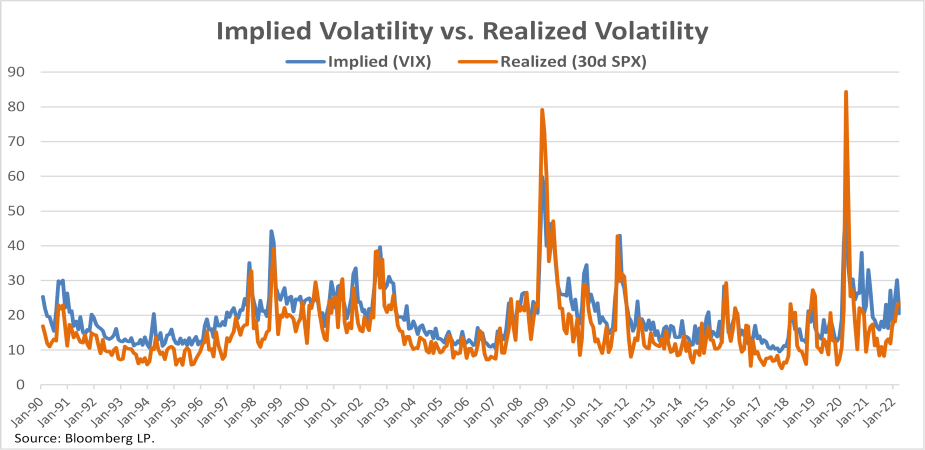
Collecting Volatility Risk Premium
With an understanding of volatility risk premium, there are a few ways to leverage this market inefficiency.
First, let’s examine a short put option strategy. A put option gives the holder (long or purchaser) the right, but not the obligation, to sell shares to the writer (short or seller) of the option at a predetermined price, known as the strike price, at or before a predetermined expiration date in the future. This allows the buyer of the option to put the shares to the seller of the option, obliging the seller of the option to purchase the shares.
Selling put options can be used as a stock replacement strategy. Alternatively, the sale of a put against an underlying cash position, also known as a cash-secured put write strategy, can be used to enhance the returns of an invested portfolio.
Stock/ETF Replacement: A Put Sale
A stock replacement strategy simply gives the investor the ability to potentially buy shares of a stock or ETF at a predetermined price at or before a specific date all while being paid a little extra cash (premium). If the investor intends to buy shares of a stock or ETF, selling a put allows them to get paid while holding the equivalent to a limit order for a defined period. Typically, this strategy requires cash to be set aside to pay for the assignment of shares.
Enhance Risk-Adjusted Return: Cash-Secured Put Write
Using a cash-secured put write strategy on a portfolio can capture volatility risk premium over time. In the short term, returns may have a high variance, but over long periods of time when correctly implemented with a systematic approach, returns should begin to reflect the gap between implied and realized volatility to some varying degree based on how the trade was structured.
The seller of the put contract will receive cash as compensation for the risk of potentially being obliged to buy shares and provide protection to the buyer of the put. The premium received is the maximum that one could potentially profit from a short put. The breakeven point of a short option is the strike price sold minus the premium received for the sale of the put.
For a visual representation, a put would be sold at point A on the chart below. The flat line at the top of the chart is the maximum potential gain, while the breakeven is where the blue and black lines intersect. Potential loss is anything on the blue line below the breakeven point.
Options Playbook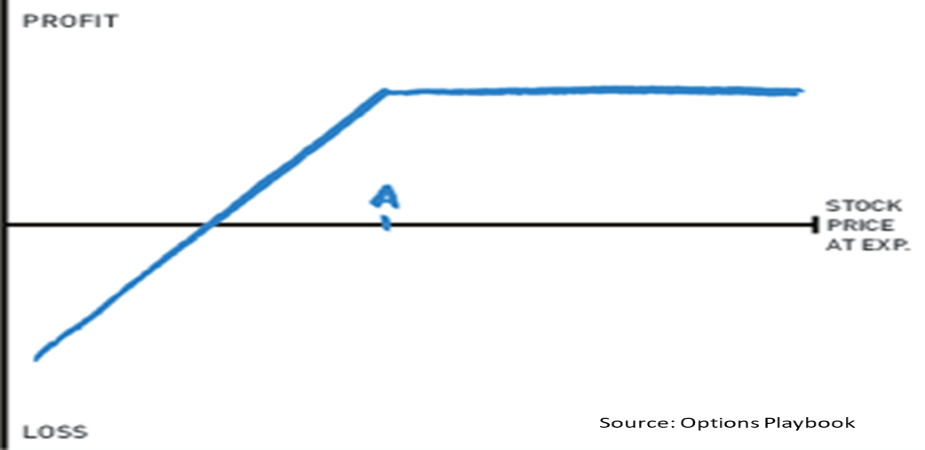
There are important risk factors to consider when selling a put. Investors can lose money. A put written on a stock, ETF or index that goes to $0, has a substantial potential loss, limited to the strike price minus volatility risk premium.
Income Generation: A Credit Vertical Put Spread
Now consider the alternative of a short, or a credit vertical put spread. The potential loss from a short put may be lessened by combining it with a long put with a lower strike price. Colloquially referred to as “spreading off risk,” this practice creates a position commonly known as a bull put spread, or short put spread. The potential risk is limited to the differential between the two strike prices minus the premium received. The purchase of the lower strike put lessens the overall volatility risk premium collected but allows the risk to be controlled at the outset of a trade.
This strategy results in less premium but assumes less risk. Less of a net credit (volatility risk premium collected on short put-premium paid for long put) can be a great tradeoff for more risk-averse investors. A consistent approach is important to a strategy’s success, with the objective of harvesting volatility risk premium.
Visually, the chart of a bull put spread looks like the short put chart below while flattening the loss line out to the left. In this case, point B is the put that is sold for a credit while point A is the put that is purchased to spread off risk. Point A can be thought of as an insurance policy against a declining stock, ETF or index price. Ideally, the underlying price is at or above point B, and both options expire worthless.
Options Playbook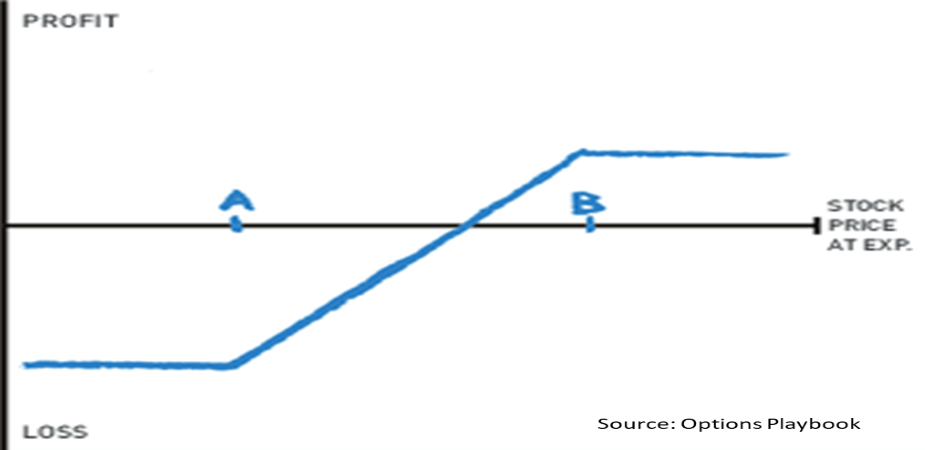
Short put, cash-secured put write or credit vertical put spread strategies are used with a goal of being compensated for providing protection from unexpected market volatility. These strategies capitalize on the demonstrated willingness of an options buyer to pay more than they should for the protection they are purchasing. Nonetheless, short puts and short put-spreads have different risk profiles and may not be appropriate for all investors or investment managers. Carefully consider the risk/reward objectives of each investment strategy before implementation.
Although these observations may seem counterintuitive, they capture the essence of Warren Buffett’s famous line: “Be greedy only when others are fearful.” (Berkshire Hathaway, Inc., “Chairman’s Letter,” 1986.)
This article is part of Cboe’s Guest Author Series, where firms and individuals share their insights, strategies and ideas with the broader Cboe community. Interested in contributing? Email social@cboe.com or contact your Cboe representative to learn more.
The authors prepared this article at the request of Cboe. The information in this article is for informational purposes only and no statement within this article should be construed as investment advice or a recommendation to buy or sell any security. There are important risks associated with transacting in any of the Cboe Company products discussed here. Before engaging in any transactions in those products, it is important for market participants to carefully review the disclosures and disclaimers contained at Disclosures and Disclaimers Related to Cboe Options and Futures Products and to Digital Assets.
Editor’s Note: The summary bullets for this article were chosen by Seeking Alpha editors.
Be the first to comment