

U.S. DOLLAR FUNDMANTAL FORECAST: BULLISH
- Flattening yield curve impedes dollar prospects.
- Economic breather next week.
DXY FUNDAMENTAL BACKDROP
The U.S. economy is displaying solid performance metrics particularly in the labor market. Coupled with a hawkish central bank in the midst of extreme inflationary pressures, the greenback is yet to take off as many expected. Markets are pricing in roughly four rate hikes in 2022 (see table below) with a 97% probability scheduled for the January meeting.
FED RATE HIKE IMPLIED PROBABILITIES
Source: Refinitiv
With this aggressive tightening on the cards, bond markets have been relatively muted and a flattening yield curve reflected by the 2s10s (difference between long and short term bonds) curve below is an indicator that markets are apprehensive about the future of the U.S. economy. Higher interest rates and the Fed’s intention to reduce a ballooning balance sheet could hurt economic growth within. Markets are therefore looking for higher returns elsewhere instead of adding to the already extended dollar longs. This being said, the drop off shown by the Dollar Index (DXY) is likely to be short-lived as the overall outlook remains rather bullish.
U.S. YIELD CURVE (2s10s)
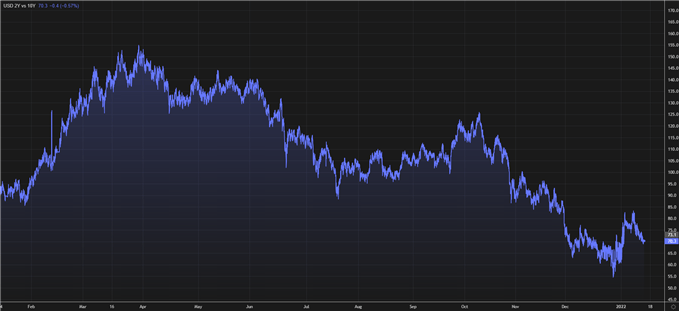
Source: Refinitiv
Next week’s dollar economic calendar is fairly light with no major announcements scheduled. This should allow markets to digest last week’s slew of information and focus on the broader macroeconomic environment. Martin Luther King Jr. Day next week Monday the 17th should result in thin trading volumes, so expect a larger market moves should anything significant occur over the weekend and holiday period.
TECHNICAL ANALYSIS
U.S. DOLLAR INDEX DAILY CHART
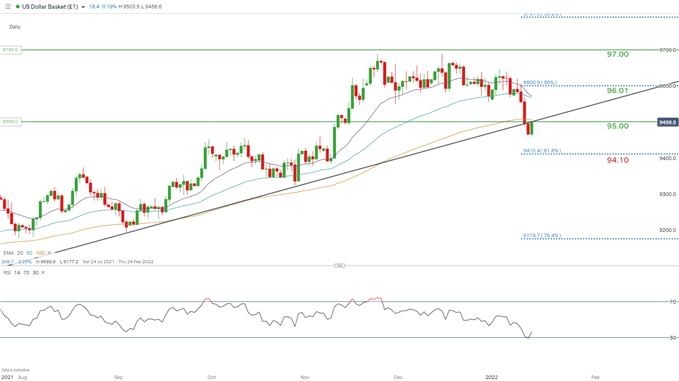
Chart prepared by Warren Venketas, IG
This week’s dollar sell-off saw the key medium-term trendline support (black) unable prevent further downside momentum. This noteworthy break opens up room for further dollar depreciation to subsequent support levels. This being said, should Friday’s daily candle close above the 95.00 psychological handle, the downside break may be ruled as a false breakout. Similarly, if prices hover just beneath 95.00 and creep above after a few trading days, the same principle would apply.
The Relative Strength Index (RSI) further supports this outlook with the momentum indicator impending on oversold levels.
Resistance levels:
- 96.01 (50% Fibonacci)
- 95.00
Support levels:
Contact and follow Warren on Twitter: @WVenketas
Be the first to comment