

LeoWolfert/iStock via Getty Images
This article was first published for DGI+ Club members on March 21, 2022.
Investment Thesis
Back on May 29, 2020, I published an article, “Ecolab: High Multiple, ‘Leaky Equity Bucket’, Time To Cash Out“. Since that time the Ecolab Inc. (NYSE:ECL) share price has declined by 19.52%, while the S&P 500 has increased by 46.87%. I decided it’s time to take another look at Ecolab shares at the lower share price. Certainly, based on SA Premium analysts’ estimates, and at the lower share price, my forward projections in Table 3 further below indicate double-digit returns are possible, buying at the current share price and holding through end of 2024. That would require the P/E ratio to remain around the present mid 30s, which is possible if the high EPS growth rates implicit in analysts’ estimates are met. My major concern with Ecolab in its history is one of what I refer to as being “shareholder unfriendly”, with a “leaky equity bucket”. The effect of a “leaky equity bucket” can be seen in my balance sheet analyses under Tables 5.1 and 5.2 below. To summarize those analyses, Ecolab management reported earnings totaling $7,141 million over the 5 years through end of 2021. The only distributions to shareholders over that period were dividends totaling $2,569 million. That should leave an increase in shareholders’ funds of $4,572 million. Now there were share repurchases of ~11.9 million shares for $1,769 million, and these are often assumed to be a form of distribution to shareholders. So that would reduce the increase in shareholders’ funds to $2,803 million. The problem with this is there were ~11.9 million shares issued for employee stock compensation, so shareholders did not benefit from a reduction in share count. And as detailed in the balance sheet analyses, the increase in shareholders’ equity over the 5-year period was not $2,803 million but a much lesser $323 million. I also noticed evidence of “shareholder unfriendly” in relation to the Apergy merger. In my article, “Ecolab: Understanding The ChampionX Apergy Merger Transaction“, I made the following summary points about the position Ecolab shareholders were put in by the arrangements put in place by management,
Ecolab shareholders could be said to be, ‘between a rock and a hard place’ with this tender offer…There is no real benefit from the tender, but the very real prospect of a penalty, if 100% of individual shareholders’ Ecolab shares are not tendered.
Fig. 1 below shows ratings per SA premium,
Figure 1
Data sources: Seeking Alpha Premium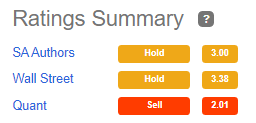
While I might like many aspects of the Ecolab business and its future prospects, I find, based on past history, being a shareholder of Ecolab is likely not the best investment available. I concur with the SA Quant rating and continue to rate Ecolab a Sell.
My usual detailed structured financial analysis follows below.
Looking for share market mispricing of stocks
What I’m primarily looking for here are instances of share market mispricing of stocks due to distortions to many of the usual statistics used for screening stocks for buy/hold/sell decisions. The usual metrics do not work when the “E” in P/E is distorted by the impact of COVID-19. And if the P/E ratio is suspect, so too, then, is the PEG ratio similarly affected. I believe the answer is to start with data at the end of 2019, early 2020, pre-COVID-19 and compare to projections out to the end of 2022 or later, when hopefully the impacts of COVID-19 will have largely dissipated. Summarized in Tables 1, 2, and 3 below are the results of compiling and analyzing the data on this basis.
Table 1 – Detailed Financial History And Projections
Data sources: Seeking Alpha Premium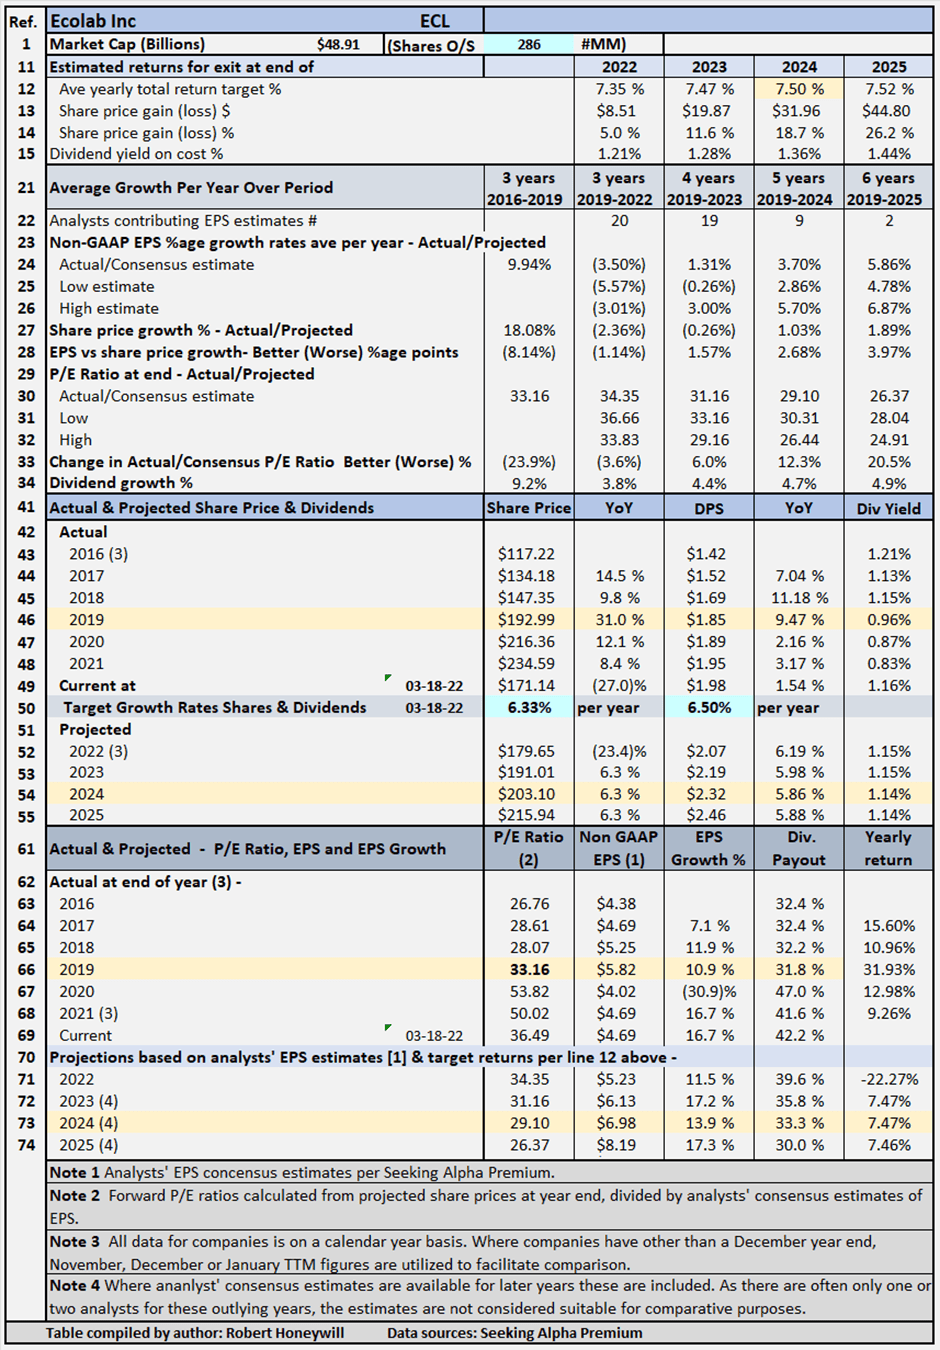
Table 1 documents historical data from 2016 to 2019, including share prices, P/E ratios, EPS and DPS, and EPS and DPS growth rates. The table also includes estimates out to 2025 for share prices, P/E ratios, EPS and DPS, and EPS and DPS growth rates (note – while estimates are shown for analysts’ EPS estimates out to 2023, 2024 and 2025 where available, estimates do tend to become less reliable, the further out the estimates go. These estimates are generally only considered sufficiently reliable if there are at least three analysts contributing estimates for the year in question). Table 1 allows modeling for target total rates of return. In the case shown above, the target set for total rate of return is 7.5% per year through the end of 2024 (see line 12), based on buying at the Mar. 18, 2022, closing share price level. As noted above, estimates become less reliable in the later years. In the case of Ecolab, I have decided to input a target return based on 2024 year, which has EPS estimates from three analysts, because that is as far out as analysts’ estimates extend. The table shows to achieve the 7.5% return, the required average yearly share price growth rate from Mar. 18, 2022, through Dec. 31, 2024, is 6.33% (line 50). Dividends, including estimated dividend increases, account for the balance of the target 7.5% total return. Table 2 below summarizes relevant data flowing from the assumption of a target 7.5% total return through the end of 2024.
Targeting A 7.5% Return
Table 2 – Targeting a 7.5% return
Data sources: Seeking Alpha Premium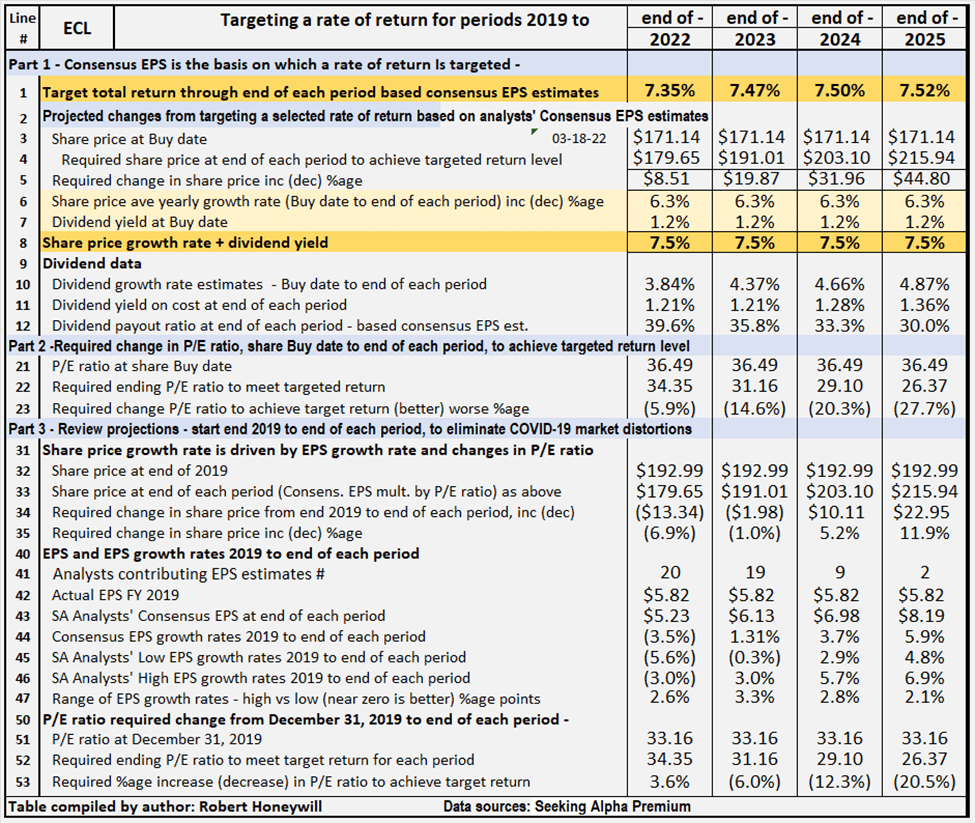
Table 2 provides comparative data for Ecolab, assuming share price grows at rates sufficient to provide total rate of return of 7.5%, from buying at closing share price on Mar. 18, 2022, and holding through the end of 2024. All EPS estimates are based on analysts’ consensus estimates per SA Premium.
Comments on Table 2 are as follows
Part 1 – Consensus EPS (Case 1.1) (lines 1 to 12)
Part 1 shows the amounts the share price would need to increase to achieve a 7.5% rate of return through the end of 2024. The share price would need to increase by $31.96 from the present $171.14 to $203.10 at the end of 2024, for the 7.5% rate of return to be achieved.
Part 2 – Required change in P/E ratio to achieve target 7.5% return (lines 21 to 23)
Part 2 shows the amount the P/E ratio would need to increase or decrease by, from buy date to the end of 2024, to achieve the share price level at the end of 2024 necessary to achieve the targeted 7.5% return. For Ecolab, the P/E ratio at buy date could decrease by (20.3)% through the end of 2024 and the 7.5% return would still be achieved. Being able to achieve a targeted return with a decrease in the P/E ratio would normally be regarded as a positive. However, due to the distortions in earnings and sentiment owing to the COVID-19 pandemic, it’s difficult to judge whether the change in P/E ratio is a positive or the result of a distorted starting point. To overcome this difficulty, in Part 3, I review the necessary change in P/E ratio from a different, pre-COVID-19 starting point.
Part 3 – Projected change in P/E ratios from 2019 to 2024 (lines 31 to 46)
In Part 3, I start with the share price at Dec. 31, 2019, before the impact of the COVID-19 pandemic on earnings and market sentiment. The end point is projected share price at the end of 2024, when it’s assumed the market and earnings are no longer materially impacted by the pandemic, and EPS growth has brought the P/E ratio back closer to historical levels. For Ecolab, the share price needs to increase by $10.11 from $192.99 at Dec. 31, 2019, to $203.10 at the end of 2024, and as detailed in Part 1, at $203.10, the targeted 7.5% rate of return would be achieved. For Ecolab, there are a number of givens in our assumptions. Using these givens, the change in the share price from Dec. 31, 2019, to the end of 2024, can be expressed as mathematical formulae as follows:
[A] Change in share price, due to the effect of EPS growth rate, equals share price at the beginning multiplied by (1 plus average yearly Consensus EPS growth rate) to the power of number of years invested.
= $192.99*(1+3.7%)^5 = $231.46 (that would be the result if the share price grew in line with EPS growth, and the P/E multiple remained constant)
[B] Change in share price due to change in P/E ratio equals share price adjusted for EPS growth rate multiplied by (1 plus/minus percentage change in P/E ratio).
= $231.46*(1- 12.3%) = $203.10 (price required at end of 2024 to provide 7.5% total return, buying at current share price).
The increase of $38.47 ($231.46 minus $192.99) due to the average yearly EPS growth rate is cumulative, and the share price will continue to increase the longer the shares are held, and the growth rate continues. The decrease of $28.36 due to a change in the P/E ratio ($231.46 minus $203.10) has a one-off effect. A continuing high or low P/E ratio has no impact on future share price growth, only a change in P/E ratio affects share price, not the level of P/E ratio.
Next, rather than targeting a specific rate of return, I look at historical P/E ratios to see the potential impact on returns of a reversion to these levels of P/E ratio. First of all, I should explain a little about the Dividend Growth Income+ Club approach to financial analysis of stocks.
Understanding The Dividend Growth Income+ Club Approach
Copyright: Robert Honeywill 2020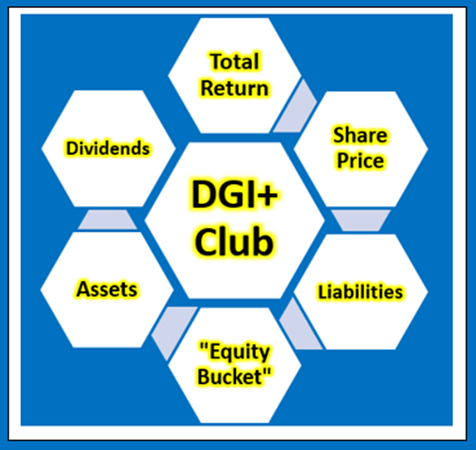
Total return, dividends, share price
The only way an investor can achieve a positive return on an investment in shares is through receipt of dividends and/or an increase in the share price above the buy price. It follows what really matters in share value assessment is the expected price at which a buyer will be able to exit shares and expected cash flow from dividends.
Changes in share price
Changes in share price are driven by increases or decreases in EPS and changes in P/E ratio. Changes in P/E ratio are driven by investor sentiment toward the stock. Investor sentiment can be influenced by many factors, not necessarily stock-specific.
“Equity bucket”
Earnings are tipped into the “Equity Bucket” for the benefit of shareholders. It’s prudent to check whether distributions out of and other reductions in the “Equity Bucket” balance are benefiting shareholders.
Ecolab’s Projected Returns Based On Selected Historical P/E Ratios Through End Of 2024
Table 3 below provides additional scenarios projecting potential returns based on select historical P/E ratios and analysts’ consensus, low, and high EPS estimates per Seeking Alpha Premium through the end of 2024.
Table 3 – Summary of relevant projections Ecolab
Data sources: Seeking Alpha Premium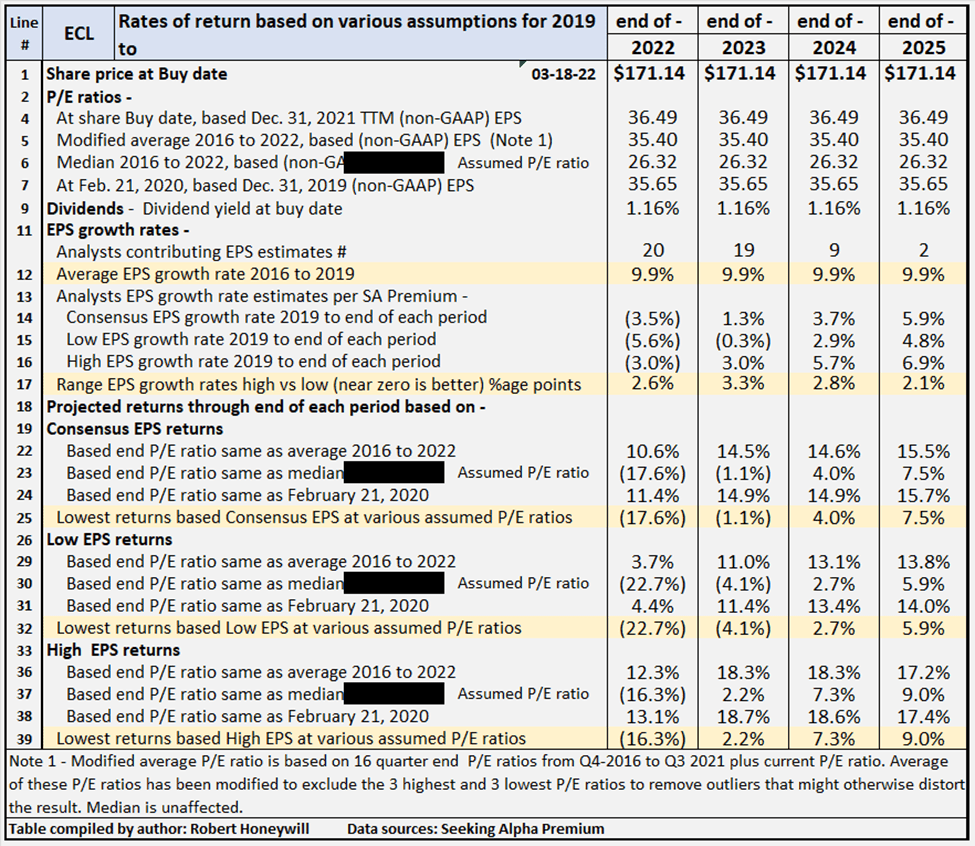
Table 3 provides comparative data for buying at closing share price on Mar. 18, 2022, and holding through the end of 2024. There’s a total of nine valuation scenarios for the year, comprised of three EPS estimates (SA Premium analysts’ consensus, low, and high) across three different P/E ratio estimates, based on historical data. Ecolab’s P/E ratio is presently 36.49. For many companies, their current P/E ratios are distorted by the impact of COVID-19. For Ecolab, the present P/E ratio is a little below the range of historical P/E ratios. Table 3 shows potential returns from an investment in shares of the company at a range of historical level P/E ratios. This analysis, from hereon, assumes an investor buying Ecolab shares today would be prepared to hold through end of 2024, if necessary, to achieve their return objectives. Comments on contents of Table 3, for the period to 2024 column follow.
Consensus, low, and high EPS estimates
All EPS estimates are based on analysts’ consensus, low, and high estimates per SA Premium. This is designed to provide a range of valuation estimates ranging from low to most likely to high based on analysts’ assessments. I could generate my own estimates, but these would likely fall within the same range and would not add to the value of the exercise. This is particularly so in respect of well-established businesses such as Ecolab. I believe the “low” estimates should be considered important. It’s prudent to manage risk by knowing the potential worst-case scenarios from whatever cause.
Alternative P/E ratios utilized in scenarios
- The actual P/E ratios at share buy date based on actual non-GAAP EPS for FYE 2021.
- A modified average P/E ratio based on 22 quarter-end P/E ratios from Q4 2016 to Q4 2021 plus current P/E ratio in Q1 2022. The average of these P/E ratios has been modified to exclude the three highest and three lowest P/E ratios to remove outliers that might otherwise distort the result.
- A median P/E ratio calculated using the same data set used for calculating the modified average P/E ratio. Of course, the median is the same whether or not the three highest and lowest P/E ratios are excluded. In the case of Ecolab, I have replaced the median P/E ratio of 33.16 with a P/E ratio of 26.32 which is at the low end of its historical P/E ratios. This is done to provide a test of effect of potential multiple contraction.
- The actual P/E ratio at Feb. 21, 2020, share price, based on 2019 non-GAAP EPS. The logic here is the market peaked around Feb. 21, 2020, before any significant impact from COVID-19 became apparent. This makes the P/E ratios at Feb. 21, 2020, reflective of most recent data before the distortion of P/E ratios by the impact of the coronavirus pandemic.
Reliability of EPS estimates (line 17)
Line 17 shows the range between high and low EPS estimates. The wider the range, the greater disagreement there is between the most optimistic and the most pessimistic analysts, which tends to suggest greater uncertainty in the estimates. There are nine analysts covering Ecolab through end of 2024. In my experience, a range of 2.8 percentage points difference in EPS growth estimates among analysts is not overly high, suggesting some degree of certainty, and thus greater reliability.
Projected returns (lines 18 to 39)
Lines 25, 32 and 39 show if Ecolab P/E multiple were to contract from present level of 36.49 to around its historical low of 26.32, low, but positive returns would be possible, provided the shares were held through end of 2024. On the other hand, if multiple decreased slightly from current level of 36.49 to the historical average of 35.40, returns of 13.1% to 18.3% are indicated. The 13.1% return is based on analysts’ low EPS estimates, and the 18.3% on their high EPS estimates, with a return of 14.6% based on consensus EPS estimates.
Review Of Historical Performance For Ecolab
Ecolab: Historical shareholder returns
In Table 4 below, I provide details of actual rates of return for Ecolab shareholders investing in the company over the last six years.
Table 4
Data sources: Seeking Alpha Premium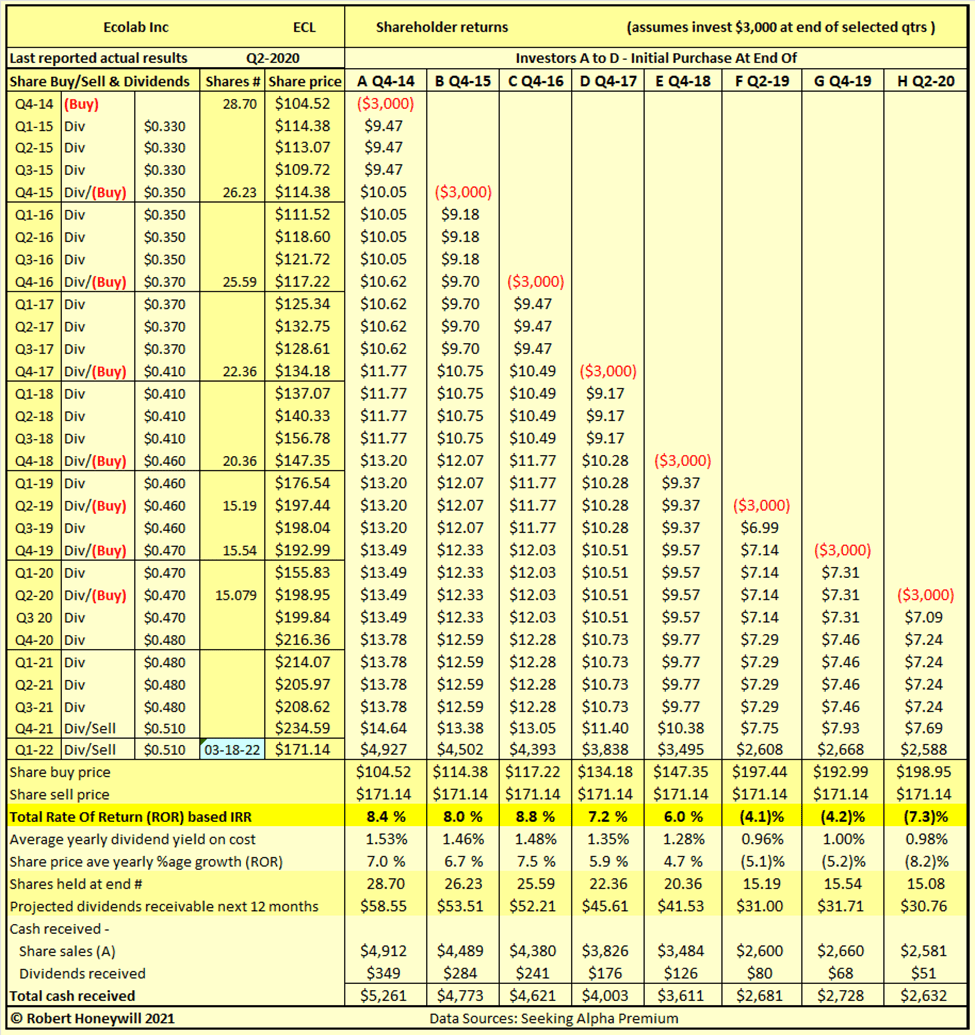
For many stocks where I create a table similar to Table 4 above, I find a wide range of returns indicating a degree of volatility and risk. When I last wrote about Ecolab, with a sell recommendation, in May 2020, all investors were showing double-digit returns. That was at a share price of $207.35. At the current share price of $171.14, returns are naturally greatly reduced. Table 4 above shows high single-digit returns for five of eight different investors, each investing $3,000 over the last seven years and holding to the present. The remaining three investors suffered negative returns of (4.1)%, (4.2)% and (7.3)%. The negative returns were due to buying during times of elevated share prices in 2019 and 2020. These rates of return, ranging from positive 8.8% to negative (7.3)%, are not just hypothetical results. They are very real results for anyone who purchased shares on the various dates and held through to Mar. 18, 2022. In the above examples, the assumed share sale price is the same for all investors, illustrating the impact on returns of the price at which an investor buys shares.
Checking Ecolab’s “Equity Bucket”
Table 5.1 Ecolab Balance Sheet – Summary Format
Data sources: Seeking Alpha Premium and SEC filings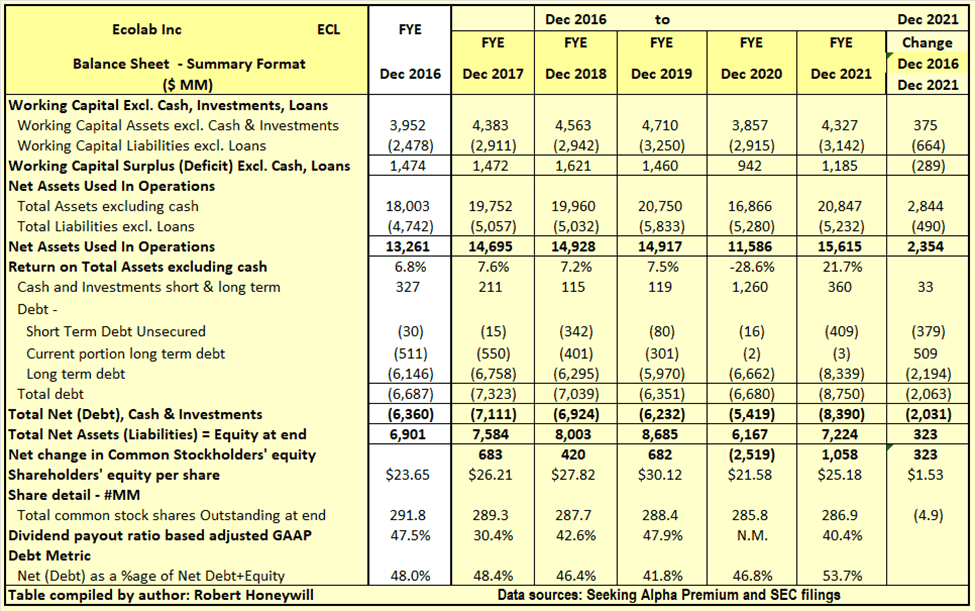
Table 5.1 shows Ecolab has increased net assets used in operations by $2,354 million over the last 5 years. The increase was primarily due to the Purolite acquisition for $3.7 billion on December 1, 2021. Ecolab used a mixture of existing cash, plus additional borrowings to fund the all-cash transaction. Looking at funding over the five years, the $2,354 million increase in operating net assets was effectively funded by $323 million in equity and $2,031 million in net debt. This resulted in net debt as a percentage of net debt plus equity increasing from 48.0% to 53.7%, over the 5-year period. Outstanding shares decreased by 4.9 million from 291.8 million to 286.9 million, over the period. While 11.9 million shares were repurchased, the 4.9 million reduction in share count was entirely due to Ecolab shareholders being required to hand over a portion of their Ecolab shares for cancellation, to receive an allocation of shares in ChampionX. The ChampionX shares were consideration for the contribution of Ecolab’s upstream oil and gas business to the merger with Apergy in mid-2020. The 11.9 million shares repurchased at a cost of $1,768 million did not reduce share count as a similar number of shares were issued as employee stock compensation. The $323 million increase in shareholders’ equity over the last 5 years is analyzed in Table 5.2 below.
Table 5.2 Ecolab Balance Sheet – Equity Section –
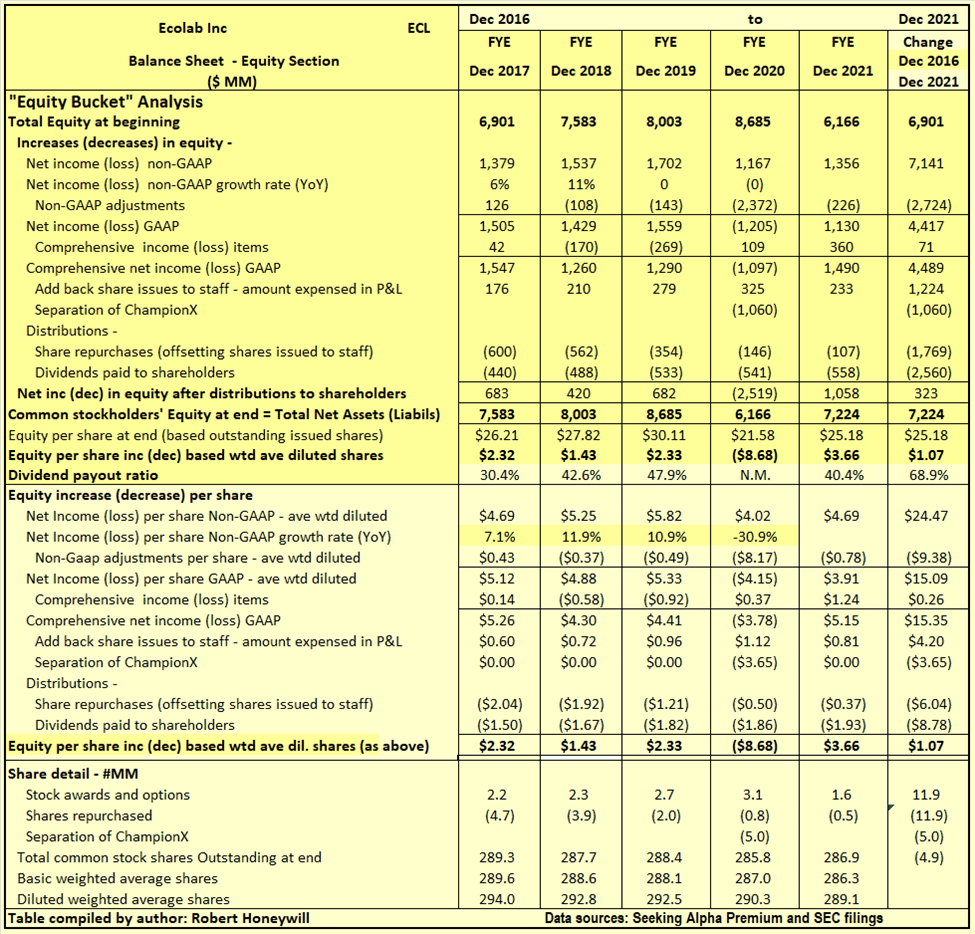
Data sources: Seeking Alpha Premium and SEC filings
I often find companies report earnings that should flow into and increase shareholders’ equity. But often the increase in shareholders’ equity does not materialize. Also, there can be distributions out of or other reductions in equity that do not benefit shareholders. Hence, the term “leaky equity bucket.” It is not the worst case I have seen, but this is happening to a worrying degree with Ecolab, as explained below.
Explanatory comments on Table 5.2 for the period from end FY-2016 to end FY-2021.
- Reported net income (non-GAAP) over the 5-year period totals $7,141 million, equivalent to diluted net income per share of $24.47.
- The non-GAAP net income excludes $2,724 million of costs regarded as unusual or of a non-recurring nature. A large component is loss of $2,172 million on the disposal of the upstream oil and gas business through the merger of that business with Apergy to create ChampionX Corporation. The balance is largely restructuring and other costs. These costs are excluded from non-GAAP profit constructs in order to better show the underlying profitability of Ecolab. Nevertheless, these are real costs and reduce shareholders’ equity. When taken into account, they reduce EPS over the 5-year period by $9.38 per share.
- Other comprehensive income includes such things as foreign exchange translation adjustments in respect to buildings, plant, and other facilities located overseas and changes in valuation of assets in the pension fund – these are not passed through net income as they fluctuate without affecting operations and can easily reverse in a following period. Nevertheless, they do impact on the value of shareholders’ equity at any point in time. For Ecolab, these items were $71 million additional income (EPS effect $0.26) over the 5-year period.
- The net income figure is arrived at after a charge of $1,224 million for 11.9 million shares issued to employees. The issue of these shares was offset by a roughly similar number of shares repurchased for $1,769 million. The difference of $545 million between the amount of $1,224 million charged against net income, and the $1,769 million paid to offset the shares issued has come out of shareholders’ equity without being recognized as a charge against net income. Taking this additional cost into account further reduces EPS by $1.84 ($545 million) over the 5-year period.
- By the time these various items are taken into account, we find the reported EPS of $24.47 ($7,141 million) has reduced to $13.51 ($3,944 million) for the 5-year period. That becomes a rather serious difference when share price is already a multiple of 36 times reported EPS.
- Balance of EPS of $13.51 ($3,944 million) is further reduced by the $3.65 per share ($1,060 million) charge against equity related to the disposal of the upstream oil and gas business in the merger with Apergy. It should be remembered this was not a distribution to shareholders – they had to pay for their shares in the merged business with portion of their Ecolab shares, which were then cancelled. This loss of equity reduces the balance of EPS available for distribution to shareholders to $9.85 ($2,884 million).
- Dividends per share of $8.78 ($2,560 million) took almost all of this remaining shareholders’ equity of $9.85 ($2,884 million) leaving an increase in shareholders’ equity of $1.07 per diluted share ($323 million) over the 5-year period, as per Table 5.1 above.
Be the first to comment