

gorodenkoffWealth-Building Goals
Wealth Building Goals
The idea in this investing approach is to assemble a portfolio of high-quality, currently out-of-favor, low P/E companies and wait for things to return to normal to earn market-beating returns over time.
Portfolio Principles For The Long Haul
To achieve this goal, a written set of guiding principles can help maintain discipline and focus. Here are few for consideration:
1. Valuation always matters: maintain the discipline to identify what shares are worth compared to that company’s own history.
2. Monitor holdings: Be willing to rotate into new names if a stock becomes materially overvalued.
3. Be patient: measure holding periods in months and years, not days and weeks.
4. Earnings matter: do not be lulled into momentum, popular stocks that don’t earn profits.
The Thesis For Eastman Chemical
The thesis here is that Eastman Chemical Company (NYSE:EMN) is a quality company that is facing temporary headwinds. Shares are undervalued based on the company’s own history and the risk/reward ratio is favorable for patient investors.
Quick Company Profile
Eastman Chemical is an $11.5 billion, large-cap company operating in the Basic Materials, Specialty Chemicals space.
The company manufactures and sells a wide range of plastics, chemicals, and fiber products. EMN serves customers in over 100 countries. Products and operations are reported in four operating segments: Additives & Functional Products, (38% of sales); Advanced Materials, (23% of sales); Chemical Intermediaries, (27% of sales); and Fibers, (12% of sales). The company has nearly 15,000 employees.
A Sound Balance Sheet And Well-Covered Dividend
EMN enjoys a decent balance sheet and current ratio within 10-year norms for the company. As we can see in the chart below, the current ratio is 1.56, slightly below the 10-year average, but appears manageable given the company’s solid market position.
EMH 10-year Current Ratio History (FastGraphs)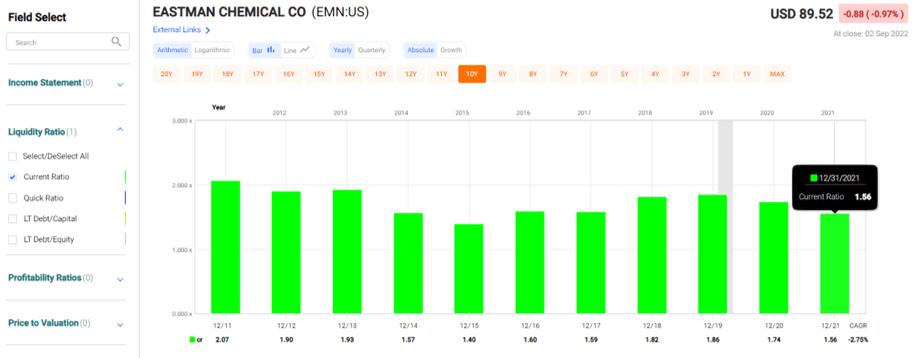
The company has a history of paying a well-covered dividend. The chart below demonstrates the dividend pay-out ratio (white line) compared to earnings per share (orange line). Note the long-term payout rate average between 35% to 45%.
EMH Dividend Payout Ratio (FastGraphs)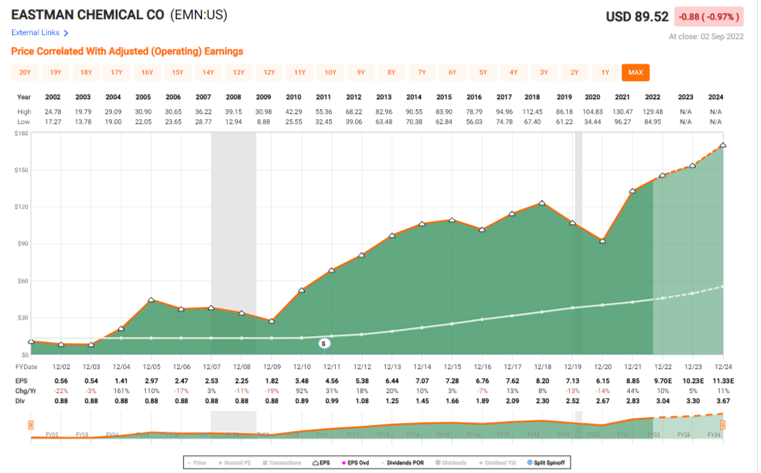
Why Is The Stock Price Down Right Now?
A rather long list of headwinds have combined to restrain recent earnings. A recent fire at a Tennessee facility negatively impacted earnings. In addition, commodity chemical cost inflation, the fear of a recession, and slowing transportation demand (a key customer segment) have had an impact.
Lastly — no surprise here — Eastman Chemical has felt the pain of supply chain pressures, increased transportation and distribution costs and labor increases.
While each of these factors is significant, there are offsetting factors to support a bull case going forward.
Catalysts To Better Future Performance
A number of company actions should serve to offset current earnings drags. For example, the company has exercised pricing power to offset inflationary input costs. Secondly, overseas demand declines appear to be moderating or even improving on a sequential basis. Lastly, the company should benefit long-term from the shift to electric vehicles as EMN sells more than 3X product for electric vehicles vs. traditional technology.
These factors, from my view, will more than serve to overcome the short-term headwinds for a patient investor willing to hold for reasonable periods as the company improves operations and headline number results.
Does EMN Have A History Of Growing Earnings?
For the investor, the story is always valuation. What are shares worth compared to the current stock price? And to determine a valuation, the company must have a relatively-predictable history of growing earnings over long periods of time.
Have a look at the chart below. With a BBB S+P rating, the company has grown operating EPS around 12% per year. The orange line represents EPS growth and the black line represents the stock price over the same time period. The blue line is the company’s own normal historical price-to-earnings ratio. The visual represents the growth and somewhat cyclical nature of EPS over time.
EMN Price and EPS History (FastGraphs)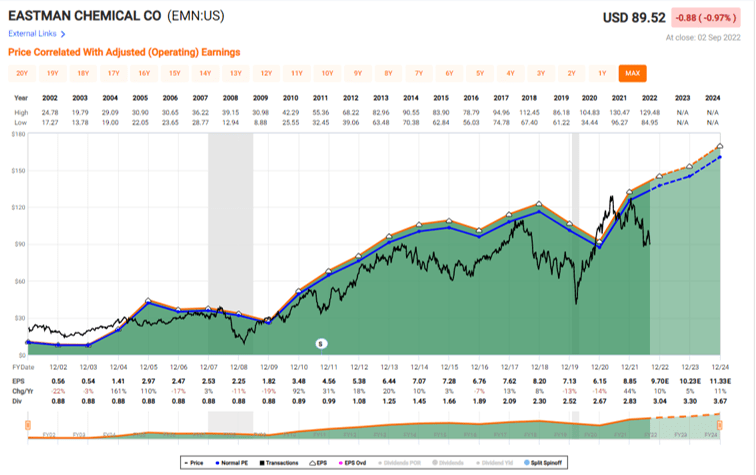
From my view, yes, EMN fits the bill: a quality company with a well-covered dividend that has grown earnings over time.
What Are Shares Worth?
One valuation method is to apply the company’s own historical P/E to earnings, with the assumption that eventually the company will overcome short-term challenges and return to normal.
Note from the chart below that EMN has a normalized P/E of 12X earnings (blue line) The current P/E is around 9X (stock price is black line).
If we apply the normalized P/E to expected earnings, we might expect a valuation over the coming year of $116 or so.
This is not unreasonable because the stock price reached $104, $130 and $129 the past three years — on lower earnings.
EMN Normalized PE Valuation (FastGraphs)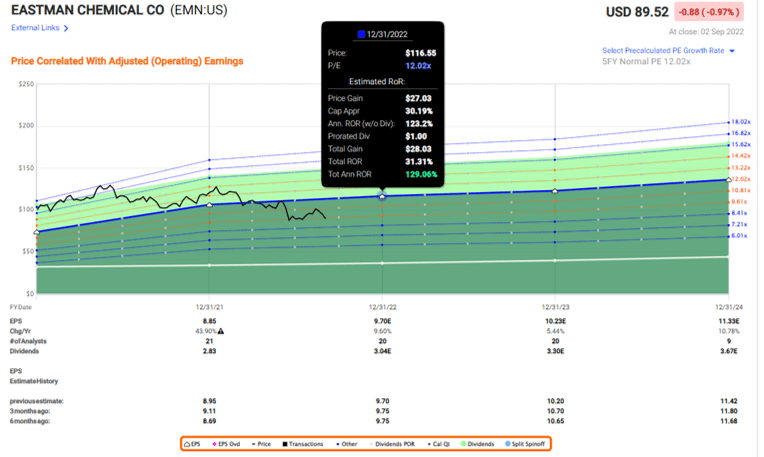
Risk/Reward Thoughts
Could the stock price fall further? Of course. But company history informs our thinking with data on this question. So EMN is currently available for about 9X earnings. What have been other “low P/E” points? The current P/E is at one of the lowest points over many years, except for 2008 and the 2020 Covid-19 low.
Historically, each time EMN cycles to a P/E around 8X or 9X, the price tends to revert to mean as the company normalizes.
Previous Low PE Points (FastGraphs and Author Notes)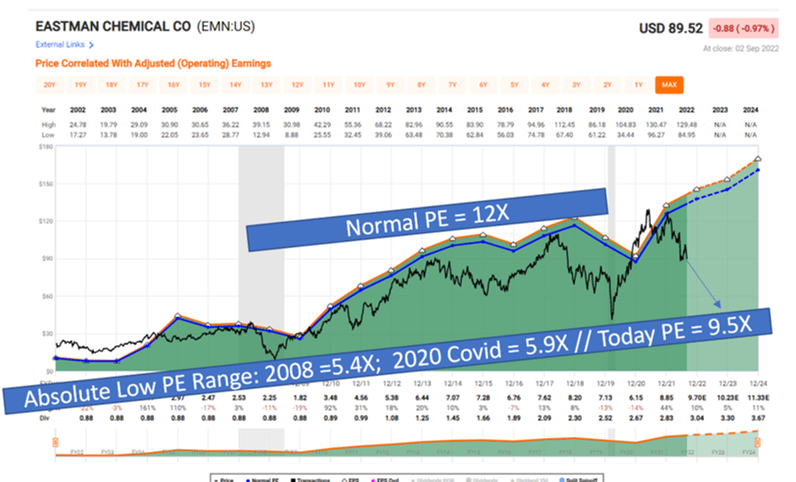
Given that the risk may be moderated due to the currently low P/E compared to history, the reward might be measured not only by a return to the normal P/E of 12X, but note also that the price has risen to a range of 14X to 17X over the past 5 years or so.
In my opinion, the current risk to reward ratio is favorable and would be an even better deal should the stock price fall further due to non-company specific sell-offs.
Concluding Thoughts
At current market price levels, one could argue that the recent bad news — and there has been plenty of that — is priced in and a return to normal would yield favorable results to an investor. Eastman Chemical is a company with a decent balance sheet and history of growing earnings now offered an attractive valuation.
This company would be a reasonable add to a patient value investor willing to wait for a return to normal.
Thank you for reading this article.
Be the first to comment