

US Dollar Outlook Hinges on Treasury Yields; Retail Sales & Consumer Inflation Expectations Eyed
- US Dollar edged slightly lower on Thursday measuring by the broader DXY Index
- Treasury yields pulled back and likely contributed to a slightly weaker US Dollar
- Retail sales and consumer sentiment data on deck could rekindle inflation fears
- Check out the DailyFX Education Center to refine your technical analysis skills
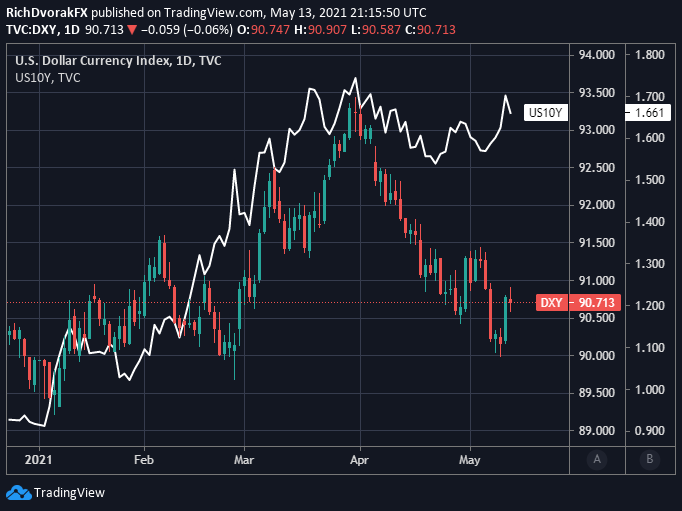
The US Dollar lost upward momentum on Thursday following yesterday’s influx of strength. USD price action was largely mixed across the board of major currency pairs with USD/JPY downside offsetting USD/CAD upside. A slight pullback in ten-year Treasury yields likely weighed negatively on USD/JPY while sharply lower crude oil prices may have helped guide USD/CAD higher. On balance, the broader DXY Index closed practically flat with a very modest -0.06% decline.
DXY – US DOLLAR INDEX WITH TEN-YEAR TREASURY YIELD OVERLAID: DAILY TIME FRAME (24 DEC 2020 TO 13 MAY 2021)
Chart by @RichDvorakFX created using TradingView
That said, it is probable that the direction of Treasury yields strongarms where the broader US Dollar heads next. The reversal lower by the US Dollar since the beginning of April coincided with the year-to-date peak in ten-year Treasury yields around 178-basis points. Yesterday’s red-hot inflation data ignited a breakout in ten-year Treasury yields above 1.65%, but 1.70% continues to present a notable level of resistance. A close above this area could be quite telling of how the bond market feels about inflation overheating and Fed taper risks. In turn, this could fuel a sustained reversal higher by the US Dollar. With FOMC officials continuing to peg rises in inflation as ‘largely transitory,’ however, there could be more headwinds experienced by Treasury yields and the broader US Dollar. Aside from just Treasury yields, it might also be prudent for traders to keep close tabs on US interest rate differentials. I discuss this fundamental driver in the EUR/USD trading guide available below.
USD PRICE OUTLOOK – US DOLLAR IMPLIED VOLATILITY TRADING RANGES (OVERNIGHT)
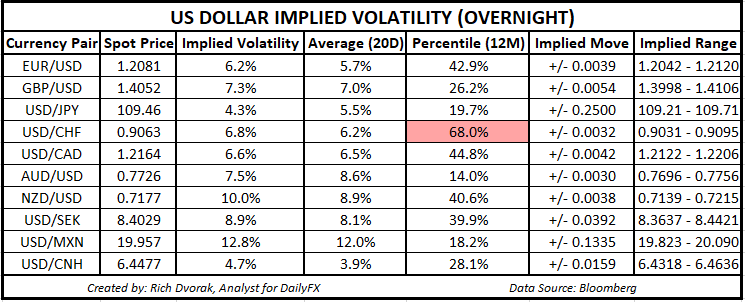
Looking ahead to Friday’s trading session on the DailyFX Economic Calendar, we have high-impact event risk posed by the release of monthly retail sales and consumer sentiment data. US Dollar implied volatility readings have cooled off from earlier in the week, however, and suggest that there may be less of a reaction by markets relative to Wednesday’s CPI report. I will be curious to see updated inflation expectations detailed in the UofM’s consumer sentiment report nonetheless. NZD/USD price action is expected to be one of the more active pairs judging by its overnight implied volatility reading of 10.0%, which compares to its 20-day average reading of 8.9% and ranks in the bottom 40th percentile of measurements taken over the last 12-months.
— Written by Rich Dvorak, Analyst for DailyFX.com
Connect with @RichDvorakFX on Twitter for real-time market insight
Be the first to comment